| |
|
|
|
Abundance Levels in Fractions
(x1000) |
|
Median Log2 (dDAVP/Ctrl)
Ratio |
|
|
|
| GI Number |
|
Gene Symbol |
|
1K |
4K |
17K |
200Kp |
200Ks |
|
1K |
4K |
17K |
200Kp |
200Ks |
|
Annotation |
| 124487289 |
|
A1cf |
|
0 |
0 |
2526 |
1375 |
0 |
|
n.v. |
n.v. |
0.27 |
0.08 |
n.v. |
|
APOBEC1 complementation factor |
| 283483963 |
|
A4galt |
|
0 |
0 |
154 |
0 |
0 |
|
n.v. |
n.v. |
0.07 |
n.v. |
n.v. |
|
lactosylceramide 4-alpha-galactosyltransferase |
| 241982696 |
|
Aaas |
|
970 |
1397 |
225 |
0 |
0 |
|
0.06 |
0.03 |
-0.21 |
n.v. |
n.v. |
|
aladin |
| 21313520 |
|
Aacs |
|
0 |
2776 |
4520 |
819 |
79368 |
|
n.v. |
0.24 |
0.16 |
0.3 |
0.09 |
|
acetoacetyl-CoA synthetase |
| 110625673 |
|
Aagab |
|
0 |
15 |
54 |
57 |
975 |
|
n.v. |
0.22 |
-0.04 |
0.19 |
-0.01 |
|
alpha- and gamma-adaptin-binding protein p34 |
| 73695877 |
|
Aak1 |
|
0 |
90 |
231 |
1211 |
5815 |
|
n.v. |
0.39 |
0.06 |
0.24 |
0.11 |
|
AP2 associated kinase 1 isoform 2 |
| 91992157 |
|
Aak1 |
|
0 |
90 |
231 |
1211 |
5815 |
|
n.v. |
0.39 |
0.06 |
0.24 |
0.11 |
|
AP2 associated kinase 1 isoform 1 |
| 295789038 |
|
Aamdc |
|
0 |
0 |
25 |
0 |
10131 |
|
n.v. |
n.v. |
0.4 |
n.v. |
0.04 |
|
UPF0366 protein C11orf67 homolog isoform 1 |
| 295789042 |
|
Aamdc |
|
0 |
0 |
25 |
0 |
6019 |
|
n.v. |
n.v. |
0.4 |
n.v. |
0.01 |
|
UPF0366 protein C11orf67 homolog isoform 3 |
| 295789044 |
|
Aamdc |
|
0 |
0 |
25 |
0 |
6019 |
|
n.v. |
n.v. |
0.4 |
n.v. |
0.01 |
|
UPF0366 protein C11orf67 homolog isoform 4 |
| 40254393 |
|
Aamdc |
|
0 |
0 |
25 |
0 |
10131 |
|
n.v. |
n.v. |
0.4 |
n.v. |
0.04 |
|
UPF0366 protein C11orf67 homolog isoform 2 |
| 299473737 |
|
Aamp |
|
0 |
211 |
206 |
25 |
12434 |
|
n.v. |
0.08 |
-0.13 |
-0.12 |
0.03 |
|
angio-associated migratory cell protein isoform 1 |
| 82524294 |
|
Aamp |
|
0 |
211 |
206 |
25 |
12434 |
|
n.v. |
0.08 |
-0.13 |
-0.12 |
0.03 |
|
angio-associated migratory cell protein isoform 2 |
| 258679441 |
|
Aar2 |
|
0 |
0 |
0 |
3332 |
0 |
|
n.v. |
n.v. |
n.v. |
-0.08 |
n.v. |
|
protein AAR2 homolog |
| 34610207 |
|
Aars |
|
183 |
1363 |
17299 |
11959 |
316626 |
|
-0.09 |
0.13 |
0.13 |
0.47 |
0.14 |
|
alanine--tRNA ligase, cytoplasmic |
| 52630311 |
|
Aars2 |
|
0 |
405 |
0 |
0 |
0 |
|
n.v. |
-0.26 |
n.v. |
n.v. |
n.v. |
|
alanine--tRNA ligase, mitochondrial precursor |
| 21450213 |
|
Aarsd1 |
|
0 |
0 |
1013 |
16 |
59780 |
|
n.v. |
n.v. |
-0.1 |
0.55 |
0.09 |
|
alanyl-tRNA editing protein Aarsd1 |
| 227496837 |
|
Aasdhppt |
|
0 |
0 |
0 |
0 |
214 |
|
n.v. |
n.v. |
n.v. |
n.v. |
0.37 |
|
L-aminoadipate-semialdehyde
dehydrogenase-phosphopantetheinyl transferase |
| 9790013 |
|
Aatf |
|
0 |
0 |
0 |
573 |
0 |
|
n.v. |
n.v. |
n.v. |
0.14 |
n.v. |
|
protein AATF |
| 283483966 |
|
Abat |
|
0 |
328 |
549 |
0 |
0 |
|
n.v. |
0.03 |
-0.2 |
n.v. |
n.v. |
|
4-aminobutyrate aminotransferase, mitochondrial isoform 2
precursor |
| 37202121 |
|
Abat |
|
0 |
328 |
549 |
0 |
0 |
|
n.v. |
0.03 |
-0.2 |
n.v. |
n.v. |
|
4-aminobutyrate aminotransferase, mitochondrial isoform 1
precursor |
| 116292744 |
|
Abca13 |
|
0 |
148 |
0 |
1244 |
0 |
|
n.v. |
0.21 |
n.v. |
0.01 |
n.v. |
|
ATP-binding cassette sub-family A member 13 |
| 110225379 |
|
Abca2 |
|
0 |
0 |
124 |
0 |
0 |
|
n.v. |
n.v. |
-0.1 |
n.v. |
n.v. |
|
ATP-binding cassette sub-family A member 2 |
| 88759350 |
|
Abca3 |
|
0 |
0 |
0 |
0 |
3106 |
|
n.v. |
n.v. |
n.v. |
n.v. |
-0.15 |
|
ATP-binding cassette sub-family A member 3 |
| 6671495 |
|
Abca4 |
|
0 |
0 |
275 |
0 |
0 |
|
n.v. |
n.v. |
0.13 |
n.v. |
n.v. |
|
retinal-specific ATP-binding cassette transporter |
| 146134400 |
|
Abca5 |
|
0 |
0 |
711 |
0 |
0 |
|
n.v. |
n.v. |
-0.38 |
n.v. |
n.v. |
|
ATP-binding cassette sub-family A member 5 |
| 15451840 |
|
Abca7 |
|
0 |
6 |
7 |
0 |
0 |
|
n.v. |
0 |
0.3 |
n.v. |
n.v. |
|
ATP-binding cassette sub-family A member 7 |
| 153792543 |
|
Abca9 |
|
0 |
825 |
0 |
0 |
0 |
|
n.v. |
-0.35 |
n.v. |
n.v. |
n.v. |
|
ATP-binding cassette sub-family A member 9 |
| 9506367 |
|
Abcb10 |
|
0 |
466 |
0 |
0 |
0 |
|
n.v. |
-0.16 |
n.v. |
n.v. |
n.v. |
|
ATP-binding cassette sub-family B member 10,
mitochondrial |
| 17647117 |
|
Abcb6 |
|
0 |
737 |
61 |
0 |
0 |
|
n.v. |
-0.66 |
-0.13 |
n.v. |
n.v. |
|
ATP-binding cassette sub-family B member 6,
mitochondrial |
| 169234938 |
|
Abcb7 |
|
0 |
357 |
0 |
0 |
0 |
|
n.v. |
-0.1 |
n.v. |
n.v. |
n.v. |
|
ATP-binding cassette sub-family B member 7,
mitochondrial |
| 27753995 |
|
Abcb8 |
|
0 |
438 |
0 |
0 |
0 |
|
n.v. |
-0.11 |
n.v. |
n.v. |
n.v. |
|
ATP-binding cassette sub-family B member 8, mitochondrial
precursor |
| 6678848 |
|
Abcc1 |
|
805 |
4920 |
4087 |
0 |
0 |
|
0.15 |
-0.14 |
-0.24 |
n.v. |
n.v. |
|
multidrug resistance-associated protein 1 |
| 116063566 |
|
Abcc2 |
|
1501 |
0 |
0 |
0 |
0 |
|
0.01 |
n.v. |
n.v. |
n.v. |
n.v. |
|
canalicular multispecific organic anion transporter 1 |
| 90403595 |
|
Abcc3 |
|
0 |
470 |
40 |
0 |
0 |
|
n.v. |
-0.25 |
-0.6 |
n.v. |
n.v. |
|
canalicular multispecific organic anion transporter 2 |
| 255683320 |
|
Abcc4 |
|
751 |
3073 |
3907 |
90 |
0 |
|
-0.39 |
0.1 |
-0.01 |
-0.58 |
n.v. |
|
ATP-binding cassette, sub-family C (CFTR/MRP), member 4
isoform 1 |
| 255683324 |
|
Abcc4 |
|
751 |
3073 |
3907 |
90 |
0 |
|
-0.39 |
0.1 |
-0.01 |
-0.58 |
n.v. |
|
ATP-binding cassette, sub-family C (CFTR/MRP), member 4
isoform 2 |
| 255683328 |
|
Abcc4 |
|
751 |
3073 |
3907 |
90 |
0 |
|
-0.39 |
0.1 |
-0.01 |
-0.58 |
n.v. |
|
ATP-binding cassette, sub-family C (CFTR/MRP), member 4
isoform 3 |
| 6671497 |
|
Abcd1 |
|
0 |
50 |
582 |
0 |
0 |
|
n.v. |
0.14 |
-0.54 |
n.v. |
n.v. |
|
ATP-binding cassette sub-family D member 1 |
| 60218877 |
|
Abcd3 |
|
137972 |
13356 |
28472 |
0 |
0 |
|
0.07 |
-0.07 |
-0.2 |
n.v. |
n.v. |
|
ATP-binding cassette sub-family D member 3 |
| 226052788 |
|
Abcd4 |
|
0 |
58 |
148 |
0 |
0 |
|
n.v. |
-0.28 |
-0.74 |
n.v. |
n.v. |
|
ATP-binding cassette sub-family D member 4 |
| 114205431 |
|
Abce1 |
|
0 |
3513 |
47314 |
151204 |
3245 |
|
n.v. |
0.12 |
0.05 |
0.08 |
0.25 |
|
ATP-binding cassette sub-family E member 1 |
| 39930335 |
|
Abcf1 |
|
1886 |
674 |
61489 |
56660 |
0 |
|
0.42 |
-0.05 |
-0.03 |
-0.06 |
n.v. |
|
ATP-binding cassette sub-family F member 1 |
| 23956078 |
|
Abcf2 |
|
0 |
6215 |
37683 |
144115 |
0 |
|
n.v. |
0.13 |
0.05 |
0.05 |
n.v. |
|
ATP-binding cassette sub-family F member 2 isoform 1 |
| 299473734 |
|
Abcf2 |
|
0 |
6215 |
33633 |
130764 |
0 |
|
n.v. |
0.13 |
0.06 |
0.05 |
n.v. |
|
ATP-binding cassette sub-family F member 2 isoform 2 |
| 29789050 |
|
Abcf3 |
|
0 |
0 |
104 |
3585 |
9189 |
|
n.v. |
n.v. |
-0.04 |
0.1 |
0.01 |
|
ATP-binding cassette sub-family F member 3 |
| 6752944 |
|
Abcg2 |
|
0 |
0 |
600 |
3233 |
0 |
|
n.v. |
n.v. |
-0.27 |
-0.19 |
n.v. |
|
ATP-binding cassette sub-family G member 2 |
| 269784760 |
|
Abhd10 |
|
0 |
1330 |
0 |
0 |
0 |
|
n.v. |
-0.24 |
n.v. |
n.v. |
n.v. |
|
abhydrolase domain-containing protein 10, mitochondrial
precursor |
| 440918693 |
|
Abhd10 |
|
0 |
1330 |
0 |
0 |
0 |
|
n.v. |
-0.24 |
n.v. |
n.v. |
n.v. |
|
mycophenolic acid acyl-glucuronide esterase,
mitochondrial isoform 2 precursor |
| 159110817 |
|
Abhd12 |
|
20375 |
3219 |
651 |
0 |
0 |
|
0.07 |
-0.33 |
-0.32 |
n.v. |
n.v. |
|
monoacylglycerol lipase ABHD12 |
| 124487441 |
|
Abhd13 |
|
0 |
186 |
51 |
0 |
0 |
|
n.v. |
-0.7 |
-0.1 |
n.v. |
n.v. |
|
abhydrolase domain-containing protein 13 |
| 171460960 |
|
Abhd14b |
|
6151 |
14569 |
13837 |
3495 |
200300 |
|
0.38 |
0.25 |
0.09 |
0.14 |
0.15 |
|
alpha/beta hydrolase domain-containing protein 14B |
| 30519896 |
|
Abhd16a |
|
0 |
1273 |
2112 |
0 |
0 |
|
n.v. |
-0.23 |
-0.32 |
n.v. |
n.v. |
|
abhydrolase domain-containing protein 16A |
| 38142456 |
|
Abhd17b |
|
0 |
0 |
66 |
0 |
0 |
|
n.v. |
n.v. |
-0.4 |
n.v. |
n.v. |
|
abhydrolase domain-containing protein FAM108B1
precursor |
| 326937491 |
|
Abhd4 |
|
0 |
0 |
186 |
9119 |
0 |
|
n.v. |
n.v. |
-0.1 |
0.06 |
n.v. |
|
abhydrolase domain-containing protein 4 isoform 1 |
| 326937494 |
|
Abhd4 |
|
0 |
0 |
186 |
9119 |
0 |
|
n.v. |
n.v. |
-0.1 |
0.06 |
n.v. |
|
abhydrolase domain-containing protein 4 isoform 2 |
| 13385690 |
|
Abhd5 |
|
0 |
1432 |
439 |
1506 |
0 |
|
n.v. |
0.33 |
0.15 |
0.14 |
n.v. |
|
1-acylglycerol-3-phosphate O-acyltransferase ABHD5 |
| 31560264 |
|
Abhd6 |
|
1831 |
5622 |
686 |
0 |
0 |
|
-0.2 |
-0.3 |
-0.59 |
n.v. |
n.v. |
|
monoacylglycerol lipase ABHD6 |
| 116089341 |
|
Abi1 |
|
0 |
3290 |
4223 |
2955 |
814 |
|
n.v. |
-0.01 |
-0.07 |
-0.29 |
-0.63 |
|
abl interactor 1 isoform 1 |
| 116089343 |
|
Abi1 |
|
0 |
3290 |
4223 |
2955 |
814 |
|
n.v. |
-0.01 |
-0.07 |
-0.29 |
-0.63 |
|
abl interactor 1 isoform 4 |
| 116089345 |
|
Abi1 |
|
0 |
3290 |
4223 |
2955 |
814 |
|
n.v. |
-0.01 |
-0.07 |
-0.29 |
-0.63 |
|
abl interactor 1 isoform 2 |
| 116089347 |
|
Abi1 |
|
0 |
3290 |
4223 |
2955 |
814 |
|
n.v. |
-0.01 |
-0.07 |
-0.29 |
-0.63 |
|
abl interactor 1 isoform 3 |
| 116089351 |
|
Abi1 |
|
0 |
3290 |
4223 |
2955 |
814 |
|
n.v. |
-0.01 |
-0.07 |
-0.29 |
-0.63 |
|
abl interactor 1 isoform 5 |
| 162951865 |
|
Abl1 |
|
0 |
0 |
1 |
0 |
0 |
|
n.v. |
n.v. |
0.36 |
n.v. |
n.v. |
|
tyrosine-protein kinase ABL1 isoform b |
| 162951870 |
|
Abl1 |
|
0 |
0 |
1 |
0 |
0 |
|
n.v. |
n.v. |
0.36 |
n.v. |
n.v. |
|
tyrosine-protein kinase ABL1 isoform a |
| 157057145 |
|
Ablim1 |
|
0 |
0 |
0 |
0 |
1981 |
|
n.v. |
n.v. |
n.v. |
n.v. |
0.81 |
|
actin-binding LIM protein 1 isoform 1 |
| 157057174 |
|
Ablim1 |
|
0 |
0 |
0 |
0 |
1981 |
|
n.v. |
n.v. |
n.v. |
n.v. |
0.81 |
|
actin-binding LIM protein 1 isoform 2 |
| 157057554 |
|
Ablim1 |
|
0 |
0 |
0 |
0 |
1981 |
|
n.v. |
n.v. |
n.v. |
n.v. |
0.81 |
|
actin-binding LIM protein 1 isoform 3 |
| 37574113 |
|
Abr |
|
0 |
23 |
18 |
0 |
0 |
|
n.v. |
0.01 |
-0.25 |
n.v. |
n.v. |
|
active breakpoint cluster region-related protein isoform
1 |
| 38683820 |
|
Abr |
|
0 |
23 |
18 |
0 |
0 |
|
n.v. |
0.01 |
-0.25 |
n.v. |
n.v. |
|
active breakpoint cluster region-related protein isoform
2 |
| 38683822 |
|
Abr |
|
0 |
23 |
18 |
0 |
0 |
|
n.v. |
0.01 |
-0.25 |
n.v. |
n.v. |
|
active breakpoint cluster region-related protein isoform
3 |
| 153791468 |
|
Abracl |
|
3442 |
1939 |
1803 |
1653 |
664 |
|
0.13 |
0.17 |
-0.01 |
0.08 |
0.39 |
|
costars family protein ABRACL |
| 49402267 |
|
Abtb2 |
|
0 |
165 |
0 |
0 |
0 |
|
n.v. |
-0.03 |
n.v. |
n.v. |
n.v. |
|
ankyrin repeat and BTB/POZ domain-containing protein
2 |
| 18700004 |
|
Acaa1a |
|
75567 |
8488 |
33302 |
0 |
0 |
|
0.05 |
-0.17 |
-0.24 |
n.v. |
n.v. |
|
3-ketoacyl-CoA thiolase A, peroxisomal precursor |
| 22122797 |
|
Acaa1b |
|
38699 |
4027 |
13973 |
0 |
0 |
|
0.04 |
-0.2 |
-0.24 |
n.v. |
n.v. |
|
3-ketoacyl-CoA thiolase B, peroxisomal precursor |
| 29126205 |
|
Acaa2 |
|
694915 |
124712 |
10371 |
29484 |
54929 |
|
-0.03 |
-0.12 |
-0.41 |
-0.2 |
-0.13 |
|
3-ketoacyl-CoA thiolase, mitochondrial |
| 125656173 |
|
Acaca |
|
0 |
1010 |
1810 |
28224 |
18602 |
|
n.v. |
-0.05 |
-0.01 |
0.24 |
-0.09 |
|
acetyl-CoA carboxylase 1 |
| 157042798 |
|
Acacb |
|
0 |
0 |
865 |
4551 |
8343 |
|
n.v. |
n.v. |
0.03 |
0.27 |
0.01 |
|
acetyl-Coenzyme A carboxylase beta precursor |
| 156255157 |
|
Acad10 |
|
622 |
3881 |
0 |
0 |
0 |
|
-0.02 |
-0.38 |
n.v. |
n.v. |
n.v. |
|
acyl-CoA dehydrogenase family member 10 |
| 74271799 |
|
Acad11 |
|
9611 |
430 |
11278 |
0 |
0 |
|
-0.06 |
-0.18 |
-0.23 |
n.v. |
n.v. |
|
acyl-CoA dehydrogenase family member 11 |
| 257467675 |
|
Acad12 |
|
0 |
3881 |
0 |
0 |
0 |
|
n.v. |
-0.38 |
n.v. |
n.v. |
n.v. |
|
acyl-Coenzyme A dehydrogenase family, member 10-like |
| 118403322 |
|
Acad8 |
|
5126 |
205 |
0 |
0 |
0 |
|
-0.12 |
-0.17 |
n.v. |
n.v. |
n.v. |
|
isobutyryl-CoA dehydrogenase, mitochondrial precursor |
| 100817933 |
|
Acad9 |
|
44648 |
16015 |
622 |
0 |
0 |
|
-0.01 |
-0.05 |
-0.37 |
n.v. |
n.v. |
|
acyl-CoA dehydrogenase family member 9, mitochondrial |
| 31982520 |
|
Acadl |
|
326927 |
79582 |
2254 |
4731 |
10999 |
|
0.01 |
-0.16 |
-0.49 |
-0.2 |
-0.29 |
|
long-chain specific acyl-CoA dehydrogenase, mitochondrial
precursor |
| 6680618 |
|
Acadm |
|
172736 |
54161 |
471 |
1997 |
8996 |
|
0.06 |
-0.12 |
-0.07 |
-0.2 |
-0.34 |
|
medium-chain specific acyl-CoA dehydrogenase,
mitochondrial precursor |
| 31982522 |
|
Acads |
|
50891 |
1198 |
0 |
4207 |
6768 |
|
-0.06 |
-0.21 |
n.v. |
-0.04 |
-0.33 |
|
short-chain specific acyl-CoA dehydrogenase,
mitochondrial precursor |
| 17647119 |
|
Acadsb |
|
824 |
246 |
0 |
0 |
0 |
|
0.29 |
-0.36 |
n.v. |
n.v. |
n.v. |
|
short/branched chain specific acyl-CoA dehydrogenase,
mitochondrial |
| 23956084 |
|
Acadvl |
|
89004 |
43583 |
3616 |
1555 |
0 |
|
-0.03 |
-0.07 |
-0.22 |
-1.17 |
n.v. |
|
very long-chain specific acyl-CoA dehydrogenase,
mitochondrial precursor |
| 62079289 |
|
Acap2 |
|
0 |
372 |
819 |
2136 |
14972 |
|
n.v. |
0.29 |
0.01 |
-0.58 |
-0.05 |
|
arf-GAP with coiled-coil, ANK repeat and PH
domain-containing protein 2 |
| 21450129 |
|
Acat1 |
|
80546 |
36172 |
896 |
2636 |
1810 |
|
-0.01 |
-0.19 |
-0.41 |
-0.22 |
-0.99 |
|
acetyl-CoA acetyltransferase, mitochondrial precursor |
| 148747461 |
|
Acat2 |
|
0 |
42 |
1204 |
43989 |
30179 |
|
n.v. |
0.18 |
0.03 |
0.29 |
0.07 |
|
acetyl-CoA acetyltransferase, cytosolic |
| 110625948 |
|
Acat3 |
|
0 |
0 |
795 |
22109 |
19898 |
|
n.v. |
n.v. |
0.03 |
0.32 |
0.08 |
|
acetyl-Coenzyme A acetyltransferase 3 |
| 229608928 |
|
Acbd3 |
|
2837 |
10394 |
1803 |
2079 |
675 |
|
0.12 |
0.08 |
0.2 |
0.02 |
0.85 |
|
Golgi resident protein GCP60 |
| 156255161 |
|
Acbd5 |
|
1391 |
2622 |
1196 |
0 |
11 |
|
0.1 |
-0.06 |
-0.16 |
n.v. |
-2.23 |
|
acyl-CoA-binding domain-containing protein 5 isoform d |
| 156255163 |
|
Acbd5 |
|
1391 |
2622 |
1196 |
0 |
11 |
|
0.1 |
-0.06 |
-0.16 |
n.v. |
-2.23 |
|
acyl-CoA-binding domain-containing protein 5 isoform a
precursor |
| 156255165 |
|
Acbd5 |
|
1391 |
2622 |
1196 |
0 |
11 |
|
0.1 |
-0.06 |
-0.16 |
n.v. |
-2.23 |
|
acyl-CoA-binding domain-containing protein 5 isoform b
precursor |
| 27229192 |
|
Acbd5 |
|
1391 |
2622 |
1196 |
0 |
11 |
|
0.1 |
-0.06 |
-0.16 |
n.v. |
-2.23 |
|
acyl-CoA-binding domain-containing protein 5 isoform c |
| 224809391 |
|
Acbd6 |
|
0 |
0 |
0 |
0 |
129 |
|
n.v. |
n.v. |
n.v. |
n.v. |
0.06 |
|
acyl-CoA-binding domain-containing protein 6 isoform 2 |
| 224809393 |
|
Acbd6 |
|
0 |
0 |
0 |
0 |
129 |
|
n.v. |
n.v. |
n.v. |
n.v. |
0.06 |
|
acyl-CoA-binding domain-containing protein 6 isoform 3 |
| 224809389 |
|
Acbd6 |
|
0 |
0 |
34 |
0 |
3074 |
|
n.v. |
n.v. |
0.14 |
n.v. |
0.09 |
|
acyl-CoA-binding domain-containing protein 6 isoform 1 |
| 60593059 |
|
Acd |
|
0 |
0 |
0 |
475 |
203 |
|
n.v. |
n.v. |
n.v. |
-0.29 |
-0.08 |
|
adrenocortical dysplasia protein |
| 194394192 |
|
Acin1 |
|
26287 |
0 |
45 |
0 |
0 |
|
-0.13 |
n.v. |
0.17 |
n.v. |
n.v. |
|
apoptotic chromatin condensation inducer in the nucleus
isoform 1 |
| 194394195 |
|
Acin1 |
|
26287 |
0 |
45 |
0 |
0 |
|
-0.13 |
n.v. |
0.17 |
n.v. |
n.v. |
|
apoptotic chromatin condensation inducer in the nucleus
isoform 3 |
| 336176080 |
|
Acin1 |
|
26287 |
0 |
45 |
0 |
0 |
|
-0.13 |
n.v. |
0.17 |
n.v. |
n.v. |
|
apoptotic chromatin condensation inducer in the nucleus
isoform 5 |
| 336176082 |
|
Acin1 |
|
26287 |
0 |
45 |
0 |
0 |
|
-0.13 |
n.v. |
0.17 |
n.v. |
n.v. |
|
apoptotic chromatin condensation inducer in the nucleus
isoform 6 |
| 146231985 |
|
Acin1 |
|
26287 |
307 |
45 |
8 |
4284 |
|
-0.13 |
0.13 |
0.17 |
-0.04 |
-0.1 |
|
apoptotic chromatin condensation inducer in the nucleus
isoform 2 |
| 194394197 |
|
Acin1 |
|
26287 |
307 |
45 |
8 |
4284 |
|
-0.13 |
0.13 |
0.17 |
-0.04 |
-0.1 |
|
apoptotic chromatin condensation inducer in the nucleus
isoform 4 |
| 29293809 |
|
Acly |
|
0 |
843 |
24622 |
526495 |
227877 |
|
n.v. |
0.02 |
-0.05 |
0.1 |
-0.07 |
|
ATP-citrate synthase isoform 2 |
| 313151222 |
|
Acly |
|
0 |
843 |
24622 |
542998 |
227877 |
|
n.v. |
0.02 |
-0.05 |
0.1 |
-0.07 |
|
ATP-citrate synthase isoform 1 |
| 110347487 |
|
Aco1 |
|
0 |
2067 |
5002 |
8079 |
78297 |
|
n.v. |
0.25 |
0.09 |
0.44 |
0.16 |
|
cytoplasmic aconitate hydratase |
| 18079339 |
|
Aco2 |
|
1252388 |
119059 |
14815 |
1195 |
42153 |
|
-0.01 |
-0.14 |
-0.34 |
-0.17 |
-0.25 |
|
aconitate hydratase, mitochondrial precursor |
| 6753550 |
|
Acot1 |
|
152031 |
16974 |
565 |
0 |
6340 |
|
-0.13 |
-0.23 |
-0.4 |
n.v. |
-0.32 |
|
acyl-coenzyme A thioesterase 1 |
| 154426268 |
|
Acot10 |
|
0 |
3707 |
0 |
0 |
0 |
|
n.v. |
-0.07 |
n.v. |
n.v. |
n.v. |
|
acyl-coenzyme A thioesterase 10, mitochondrial precursor |
| 18482377 |
|
Acot12 |
|
0 |
163 |
0 |
0 |
0 |
|
n.v. |
0.67 |
n.v. |
n.v. |
n.v. |
|
acyl-coenzyme A thioesterase 12 |
| 13385260 |
|
Acot13 |
|
7414 |
4476 |
401 |
0 |
1842 |
|
-0.03 |
-0.03 |
-0.3 |
n.v. |
-0.14 |
|
acyl-coenzyme A thioesterase 13 |
| 238624114 |
|
Acot2 |
|
223626 |
21495 |
565 |
0 |
6340 |
|
-0.06 |
-0.29 |
-0.4 |
n.v. |
-0.32 |
|
acyl-coenzyme A thioesterase 2, mitochondrial precursor |
| 19527406 |
|
Acot3 |
|
0 |
0 |
0 |
0 |
2774 |
|
n.v. |
n.v. |
n.v. |
n.v. |
-0.32 |
|
acyl-coenzyme A thioesterase 3 |
| 269308227 |
|
Acot4 |
|
52081 |
7958 |
0 |
0 |
4605 |
|
-0.18 |
-0.25 |
n.v. |
n.v. |
-0.45 |
|
acyl-coenzyme A thioesterase 4 |
| 238550185 |
|
Acot5 |
|
0 |
0 |
0 |
0 |
2774 |
|
n.v. |
n.v. |
n.v. |
n.v. |
-0.32 |
|
acyl-coenzyme A thioesterase 5 |
| 110626167 |
|
Acot6 |
|
52081 |
7958 |
0 |
0 |
4605 |
|
-0.18 |
-0.25 |
n.v. |
n.v. |
-0.45 |
|
acyl-coenzyme A thioesterase 6 |
| 225690614 |
|
Acot7 |
|
0 |
119 |
565 |
377 |
21987 |
|
n.v. |
0.36 |
-0.09 |
0.27 |
0.39 |
|
cytosolic acyl coenzyme A thioester hydrolase isoform 2 |
| 225690616 |
|
Acot7 |
|
0 |
119 |
565 |
377 |
21987 |
|
n.v. |
0.36 |
-0.09 |
0.27 |
0.39 |
|
cytosolic acyl coenzyme A thioester hydrolase isoform 1 |
| 225690618 |
|
Acot7 |
|
0 |
79 |
565 |
377 |
21987 |
|
n.v. |
1.28 |
-0.09 |
0.27 |
0.39 |
|
cytosolic acyl coenzyme A thioester hydrolase isoform 3 |
| 254587964 |
|
Acot8 |
|
476 |
7770 |
3080 |
0 |
0 |
|
0.49 |
-0.09 |
-0.26 |
n.v. |
n.v. |
|
acyl-coenzyme A thioesterase 8 |
| 31980998 |
|
Acot9 |
|
7872 |
4718 |
0 |
0 |
0 |
|
-0.06 |
-0.11 |
n.v. |
n.v. |
n.v. |
|
acyl-coenzyme A thioesterase 9, mitochondrial |
| 429484484 |
|
Acox1 |
|
16457 |
26417 |
26297 |
0 |
535 |
|
-0.13 |
-0.02 |
-0.2 |
n.v. |
-1.38 |
|
peroxisomal acyl-coenzyme A oxidase 1 isoform 2 |
| 66793429 |
|
Acox1 |
|
16457 |
26417 |
26297 |
0 |
535 |
|
-0.13 |
-0.02 |
-0.2 |
n.v. |
-1.38 |
|
peroxisomal acyl-coenzyme A oxidase 1 isoform 1 |
| 34328334 |
|
Acox3 |
|
0 |
2127 |
449 |
0 |
0 |
|
n.v. |
-0.04 |
-0.02 |
n.v. |
n.v. |
|
peroxisomal acyl-coenzyme A oxidase 3 |
| 159032062 |
|
Acp1 |
|
13675 |
8598 |
12841 |
22813 |
15465 |
|
-0.01 |
0.18 |
0.01 |
0.01 |
0.09 |
|
low molecular weight phosphotyrosine protein phosphatase
isoform 1 |
| 29150253 |
|
Acp2 |
|
11295 |
5912 |
3731 |
647 |
0 |
|
0.02 |
-0.13 |
-0.23 |
-0.41 |
n.v. |
|
lysosomal acid phosphatase precursor |
| 66773165 |
|
Acp6 |
|
0 |
7782 |
0 |
0 |
793 |
|
n.v. |
-0.24 |
n.v. |
n.v. |
0.55 |
|
lysophosphatidic acid phosphatase type 6 precursor |
| 24418933 |
|
Acsf2 |
|
18690 |
14483 |
275 |
0 |
0 |
|
-0.02 |
-0.09 |
-0.99 |
n.v. |
n.v. |
|
acyl-CoA synthetase family member 2, mitochondrial
precursor |
| 113199775 |
|
Acsf3 |
|
1501 |
1067 |
0 |
0 |
0 |
|
-0.16 |
-0.26 |
n.v. |
n.v. |
n.v. |
|
acyl-CoA synthetase family member 3, mitochondrial
precursor |
| 31560705 |
|
Acsl1 |
|
0 |
7256 |
2731 |
0 |
0 |
|
n.v. |
-0.22 |
-0.28 |
n.v. |
n.v. |
|
long-chain-fatty-acid--CoA ligase 1 |
| 209977076 |
|
Acsl3 |
|
5840 |
2749 |
10207 |
0 |
0 |
|
0.37 |
-0.14 |
-0.17 |
n.v. |
n.v. |
|
long-chain-fatty-acid--CoA ligase 3 isoform b |
| 75992920 |
|
Acsl3 |
|
5840 |
3067 |
11096 |
0 |
0 |
|
0.37 |
-0.04 |
-0.16 |
n.v. |
n.v. |
|
long-chain-fatty-acid--CoA ligase 3 isoform a |
| 46518528 |
|
Acsl4 |
|
4760 |
4471 |
7605 |
4338 |
268 |
|
-0.03 |
0.05 |
0.03 |
0.03 |
-0.39 |
|
long-chain-fatty-acid--CoA ligase 4 isoform 1 |
| 75992925 |
|
Acsl4 |
|
4760 |
4471 |
7605 |
4338 |
268 |
|
-0.03 |
0.05 |
0.03 |
0.03 |
-0.39 |
|
long-chain-fatty-acid--CoA ligase 4 isoform 2 |
| 58218988 |
|
Acsl5 |
|
3863 |
15212 |
5553 |
0 |
0 |
|
0.26 |
-0.3 |
-0.37 |
n.v. |
n.v. |
|
long-chain-fatty-acid--CoA ligase 5 |
| 31980996 |
|
Acss2 |
|
0 |
0 |
0 |
0 |
2024 |
|
n.v. |
n.v. |
n.v. |
n.v. |
-0.36 |
|
acetyl-coenzyme A synthetase, cytoplasmic |
| 33563240 |
|
Acta1 |
|
5646106 |
506364 |
954028 |
1091070 |
3808375 |
|
0 |
0.18 |
-0.04 |
-0.04 |
0.02 |
|
actin, alpha skeletal muscle |
| 6671507 |
|
Acta2 |
|
4870901 |
471728 |
862002 |
1034770 |
3713317 |
|
0 |
0.18 |
-0.04 |
-0.06 |
0.02 |
|
actin, aortic smooth muscle |
| 6671509 |
|
Actb |
|
9565955 |
664316 |
1289302 |
2003867 |
6630832 |
|
0.02 |
0.19 |
-0.02 |
0 |
0.02 |
|
actin, cytoplasmic 1 |
| 30425250 |
|
Actbl2 |
|
2546275 |
280349 |
352546 |
605396 |
2762795 |
|
0 |
0.14 |
-0.05 |
-0.08 |
0.04 |
|
beta-actin-like protein 2 |
| 14192922 |
|
Actc1 |
|
5646106 |
506364 |
954028 |
1091046 |
3738645 |
|
0 |
0.18 |
-0.04 |
-0.04 |
0.02 |
|
actin, alpha cardiac muscle 1 |
| 6752954 |
|
Actg1 |
|
9565955 |
555398 |
1289302 |
2003867 |
6506548 |
|
0.02 |
0.19 |
-0.02 |
0 |
0.03 |
|
actin, cytoplasmic 2 |
| 157823889 |
|
Actg2 |
|
4870901 |
471726 |
862002 |
1034770 |
2987962 |
|
0 |
0.17 |
-0.04 |
-0.06 |
0.02 |
|
actin, gamma-enteric smooth muscle |
| 189181668 |
|
Actl6a |
|
37930 |
810 |
1569 |
0 |
39797 |
|
0.09 |
0.4 |
-0.04 |
n.v. |
0.01 |
|
actin-like protein 6A |
| 13937393 |
|
Actl6b |
|
2636 |
0 |
35 |
0 |
18281 |
|
0.15 |
n.v. |
-0.02 |
n.v. |
0.21 |
|
actin-like protein 6B |
| 61097906 |
|
Actn1 |
|
1007252 |
108697 |
152370 |
203681 |
967497 |
|
0.05 |
0.23 |
0.23 |
0.13 |
-0.05 |
|
alpha-actinin-1 |
| 157951643 |
|
Actn2 |
|
322827 |
28664 |
39177 |
61645 |
145092 |
|
-0.01 |
0.14 |
0.21 |
0.12 |
-0.05 |
|
alpha-actinin-2 |
| 7304855 |
|
Actn3 |
|
167390 |
27211 |
40316 |
41263 |
248268 |
|
0.05 |
0.11 |
0.21 |
0.04 |
-0.05 |
|
alpha-actinin-3 |
| 11230802 |
|
Actn4 |
|
894615 |
88678 |
144741 |
119436 |
651770 |
|
0.02 |
0.23 |
0.24 |
0.14 |
-0.06 |
|
alpha-actinin-4 |
| 226246593 |
|
Actr10 |
|
0 |
0 |
958 |
27692 |
0 |
|
n.v. |
n.v. |
0.08 |
0.2 |
n.v. |
|
actin-related protein 10 |
| 8392847 |
|
Actr1a |
|
61636 |
8722 |
20479 |
255144 |
14876 |
|
0.19 |
0.22 |
0.01 |
0.07 |
-0.07 |
|
alpha-centractin |
| 22122615 |
|
Actr1b |
|
10544 |
9310 |
18335 |
285914 |
13762 |
|
0.33 |
0.23 |
-0.07 |
0.03 |
-0.27 |
|
beta-centractin |
| 22122825 |
|
Actr2 |
|
65774 |
6789 |
59281 |
223982 |
354763 |
|
0.03 |
0.23 |
0.03 |
-0.04 |
-0.06 |
|
actin-related protein 2 |
| 329664963 |
|
Actr3 |
|
84995 |
29428 |
38197 |
162475 |
129660 |
|
0.27 |
0.19 |
0.04 |
-0.01 |
-0.08 |
|
actin-related protein 3 |
| 52345394 |
|
Actr3b |
|
17574 |
4933 |
2034 |
22257 |
9917 |
|
-0.83 |
0.23 |
0.01 |
-0.05 |
0.02 |
|
actin-related protein 3B |
| 13384746 |
|
Acy1 |
|
0 |
0 |
85 |
0 |
15411 |
|
n.v. |
n.v. |
-0.03 |
n.v. |
0.1 |
|
aminoacylase-1 |
| 31982632 |
|
Acy3 |
|
0 |
0 |
0 |
0 |
26613 |
|
n.v. |
n.v. |
n.v. |
n.v. |
0.04 |
|
aspartoacylase-2 |
| 13384810 |
|
Acyp1 |
|
4668 |
1864 |
3099 |
1220 |
36766 |
|
0 |
0.08 |
-0.05 |
0.04 |
0.04 |
|
acylphosphatase-1 |
| 150378458 |
|
Adam10 |
|
0 |
6073 |
18763 |
0 |
0 |
|
n.v. |
0.02 |
-0.04 |
n.v. |
n.v. |
|
disintegrin and metalloproteinase domain-containing
protein 10 precursor |
| 471270257 |
|
Adam17 |
|
0 |
0 |
167 |
0 |
0 |
|
n.v. |
n.v. |
0.34 |
n.v. |
n.v. |
|
disintegrin and metalloproteinase domain-containing
protein 17 isoform 2 |
| 110347485 |
|
Adam17 |
|
0 |
27 |
916 |
0 |
0 |
|
n.v. |
-0.05 |
0.16 |
n.v. |
n.v. |
|
disintegrin and metalloproteinase domain-containing
protein 17 precursor |
| 160358787 |
|
Adam9 |
|
0 |
251 |
5670 |
827 |
0 |
|
n.v. |
-0.04 |
0.07 |
-0.64 |
n.v. |
|
disintegrin and metalloproteinase domain-containing
protein 9 precursor |
| 401782598 |
|
Adam9 |
|
0 |
251 |
5670 |
827 |
0 |
|
n.v. |
-0.04 |
0.07 |
-0.64 |
n.v. |
|
disintegrin and metalloproteinase domain-containing
protein 9 isoform 1 |
| 148529020 |
|
Adamts17 |
|
29894 |
4296 |
18251 |
4355 |
82046 |
|
0.14 |
0.12 |
0.06 |
0.2 |
0.14 |
|
ADAM metallopeptidase with thrombospondin type 1 motif,
17 precursor |
| 165905595 |
|
Adamtsl5 |
|
0 |
0 |
0 |
655 |
0 |
|
n.v. |
n.v. |
n.v. |
0.12 |
n.v. |
|
ADAMTS-like protein 5 isoform 1 precursor |
| 148368976 |
|
Adap1 |
|
0 |
0 |
0 |
0 |
4187 |
|
n.v. |
n.v. |
n.v. |
n.v. |
0.58 |
|
centaurin, alpha 1 |
| 26006859 |
|
Adap2 |
|
0 |
0 |
0 |
0 |
225 |
|
n.v. |
n.v. |
n.v. |
n.v. |
0.4 |
|
arf-GAP with dual PH domain-containing protein 2 |
| 226371677 |
|
Adar |
|
0 |
0 |
1005 |
0 |
0 |
|
n.v. |
n.v. |
0.03 |
n.v. |
n.v. |
|
double-stranded RNA-specific adenosine deaminase isoform
3 |
| 226371679 |
|
Adar |
|
0 |
0 |
1005 |
0 |
0 |
|
n.v. |
n.v. |
0.03 |
n.v. |
n.v. |
|
double-stranded RNA-specific adenosine deaminase isoform
1 |
| 226371684 |
|
Adar |
|
0 |
0 |
979 |
0 |
0 |
|
n.v. |
n.v. |
-0.07 |
n.v. |
n.v. |
|
double-stranded RNA-specific adenosine deaminase isoform
2 |
| 7304859 |
|
Adat1 |
|
0 |
0 |
0 |
0 |
1660 |
|
n.v. |
n.v. |
n.v. |
n.v. |
0.05 |
|
tRNA-specific adenosine deaminase 1 |
| 61098160 |
|
Adat2 |
|
0 |
0 |
0 |
0 |
8857 |
|
n.v. |
n.v. |
n.v. |
n.v. |
-0.01 |
|
tRNA-specific adenosine deaminase 2 |
| 154759286 |
|
Adat3 |
|
0 |
0 |
0 |
0 |
3020 |
|
n.v. |
n.v. |
n.v. |
n.v. |
-0.05 |
|
tRNA-specific adenosine deaminase-like protein 3 |
| 21312430 |
|
Adck1 |
|
0 |
1121 |
0 |
0 |
0 |
|
n.v. |
-0.29 |
n.v. |
n.v. |
n.v. |
|
uncharacterized aarF domain-containing protein kinase 1
precursor |
| 169234776 |
|
Adck5 |
|
0 |
273 |
0 |
0 |
0 |
|
n.v. |
0.21 |
n.v. |
n.v. |
n.v. |
|
uncharacterized aarF domain-containing protein kinase 5 |
| 148747309 |
|
Adcy5 |
|
0 |
0 |
50 |
0 |
0 |
|
n.v. |
n.v. |
-0.25 |
n.v. |
n.v. |
|
adenylate cyclase type 5 |
| 86604721 |
|
Adcy6 |
|
0 |
202 |
50 |
0 |
0 |
|
n.v. |
0.63 |
-0.25 |
n.v. |
n.v. |
|
adenylate cyclase type 6 |
| 156255171 |
|
Add1 |
|
3570 |
253 |
780 |
0 |
1028 |
|
-0.01 |
-0.73 |
-0.09 |
n.v. |
-1.89 |
|
alpha-adducin isoform 1 |
| 156255173 |
|
Add1 |
|
3570 |
253 |
780 |
0 |
214 |
|
-0.01 |
-0.73 |
-0.09 |
n.v. |
-1.07 |
|
alpha-adducin isoform 3 |
| 7304861 |
|
Add1 |
|
3570 |
253 |
780 |
0 |
214 |
|
-0.01 |
-0.73 |
-0.09 |
n.v. |
-1.07 |
|
alpha-adducin isoform 2 |
| 427918090 |
|
Add2 |
|
0 |
0 |
852 |
0 |
0 |
|
n.v. |
n.v. |
0.06 |
n.v. |
n.v. |
|
beta-adducin isoform 1 |
| 427918097 |
|
Add2 |
|
0 |
0 |
852 |
0 |
0 |
|
n.v. |
n.v. |
0.06 |
n.v. |
n.v. |
|
beta-adducin isoform 2 |
| 6724311 |
|
Adh1 |
|
0 |
6 |
900 |
3160 |
10784 |
|
n.v. |
2.05 |
0.16 |
0.25 |
0.33 |
|
alcohol dehydrogenase 1 |
| 31982511 |
|
Adh5 |
|
3716 |
177 |
8831 |
17460 |
370849 |
|
0.12 |
0.15 |
0.06 |
0.23 |
0.06 |
|
alcohol dehydrogenase class-3 |
| 31560625 |
|
Adh7 |
|
0 |
96 |
1396 |
368 |
168653 |
|
n.v. |
-0.29 |
-0.05 |
0.56 |
-0.19 |
|
alcohol dehydrogenase class 4 mu/sigma chain |
| 19527270 |
|
Adi1 |
|
0 |
236 |
31 |
0 |
18003 |
|
n.v. |
0.55 |
0.61 |
n.v. |
0.07 |
|
1,2-dihydroxy-3-keto-5-methylthiopentene dioxygenase |
| 38259186 |
|
Adipor1 |
|
0 |
0 |
0 |
0 |
0 |
|
n.v. |
n.v. |
0.17 |
n.v. |
n.v. |
|
adiponectin receptor protein 1 |
| 19527306 |
|
Adk |
|
0 |
6256 |
2416 |
16 |
112600 |
|
n.v. |
0.16 |
0.24 |
0.26 |
0.1 |
|
adenosine kinase isoform 1 |
| 339895909 |
|
Adk |
|
0 |
6256 |
2416 |
16 |
112600 |
|
n.v. |
0.16 |
0.24 |
0.26 |
0.1 |
|
adenosine kinase isoform 2 |
| 90093349 |
|
Adnp |
|
1007 |
0 |
0 |
0 |
0 |
|
0.05 |
n.v. |
n.v. |
n.v. |
n.v. |
|
activity-dependent neuroprotector homeobox protein |
| 225703118 |
|
Ado |
|
0 |
0 |
217 |
0 |
3320 |
|
n.v. |
n.v. |
0.13 |
n.v. |
-0.02 |
|
2-aminoethanethiol dioxygenase |
| 21312406 |
|
Adpgk |
|
0 |
1328 |
155 |
0 |
0 |
|
n.v. |
-0.25 |
-0.4 |
n.v. |
n.v. |
|
ADP-dependent glucokinase precursor |
| 6680658 |
|
Adprh |
|
0 |
0 |
29 |
0 |
3470 |
|
n.v. |
n.v. |
-0.09 |
n.v. |
0.29 |
|
[Protein ADP-ribosylarginine] hydrolase |
| 28916671 |
|
Adprhl2 |
|
0 |
33 |
822 |
0 |
52359 |
|
n.v. |
0.47 |
0.05 |
n.v. |
0.1 |
|
poly(ADP-ribose) glycohydrolase ARH3 |
| 33859769 |
|
Adrbk1 |
|
0 |
230 |
492 |
41 |
7325 |
|
n.v. |
0.55 |
0.21 |
1.15 |
-0.01 |
|
beta-adrenergic receptor kinase 1 |
| 78711830 |
|
Adrbk2 |
|
0 |
230 |
335 |
0 |
2677 |
|
n.v. |
0.55 |
0.23 |
n.v. |
-0.05 |
|
beta-adrenergic receptor kinase 2 isoform 1 |
| 31981027 |
|
Adrm1 |
|
4595 |
359 |
941 |
7015 |
0 |
|
0.21 |
0.01 |
0.16 |
0.05 |
n.v. |
|
proteasomal ubiquitin receptor ADRM1 |
| 29788764 |
|
Adsl |
|
0 |
4367 |
11453 |
65689 |
77258 |
|
n.v. |
0.18 |
-0.02 |
0.3 |
-0.06 |
|
adenylosuccinate lyase |
| 31560737 |
|
Adss |
|
0 |
2417 |
3582 |
778 |
207122 |
|
n.v. |
0.32 |
0 |
0.24 |
0.09 |
|
adenylosuccinate synthetase isozyme 2 |
| 6671519 |
|
Adssl1 |
|
513 |
194 |
830 |
13735 |
48461 |
|
-0.09 |
-0.25 |
-0.16 |
0.06 |
-0.05 |
|
adenylosuccinate synthetase isozyme 1 |
| 33859696 |
|
Afap1 |
|
0 |
0 |
184 |
0 |
0 |
|
n.v. |
n.v. |
0.84 |
n.v. |
n.v. |
|
actin filament-associated protein 1 |
| 22122607 |
|
Afap1l2 |
|
0 |
0 |
0 |
115 |
0 |
|
n.v. |
n.v. |
n.v. |
1.78 |
n.v. |
|
actin filament-associated protein 1-like 2 isoform 3 |
| 295317357 |
|
Afap1l2 |
|
0 |
0 |
0 |
115 |
0 |
|
n.v. |
n.v. |
n.v. |
1.78 |
n.v. |
|
actin filament-associated protein 1-like 2 isoform 1 |
| 295317359 |
|
Afap1l2 |
|
0 |
0 |
0 |
115 |
0 |
|
n.v. |
n.v. |
n.v. |
1.78 |
n.v. |
|
actin filament-associated protein 1-like 2 isoform 2 |
| 17298672 |
|
Aff4 |
|
0 |
58 |
0 |
0 |
0 |
|
n.v. |
-0.31 |
n.v. |
n.v. |
n.v. |
|
AF4/FMR2 family member 4 |
| 66792806 |
|
Afg3l1 |
|
0 |
1689 |
0 |
0 |
0 |
|
n.v. |
0.17 |
n.v. |
n.v. |
n.v. |
|
AFG3-like protein 1 |
| 110625761 |
|
Afg3l2 |
|
0 |
1436 |
271 |
0 |
0 |
|
n.v. |
-0.03 |
-0.44 |
n.v. |
n.v. |
|
AFG3-like protein 2 |
| 21746157 |
|
Afmid |
|
0 |
0 |
0 |
0 |
32 |
|
n.v. |
n.v. |
n.v. |
n.v. |
0.4 |
|
kynurenine formamidase |
| 31088896 |
|
Aftph |
|
0 |
0 |
92 |
0 |
4584 |
|
n.v. |
n.v. |
0.22 |
n.v. |
0.08 |
|
aftiphilin isoform 1 |
| 357394879 |
|
Aftph |
|
0 |
0 |
92 |
0 |
4584 |
|
n.v. |
n.v. |
0.22 |
n.v. |
0.08 |
|
aftiphilin isoform 2 |
| 326439050 |
|
Aga |
|
1519 |
4062 |
275 |
0 |
16493 |
|
0.16 |
-0.05 |
-0.29 |
n.v. |
0.02 |
|
N(4)-(beta-N-acetylglucosaminyl)-L-asparaginase isoform 2
precursor |
| 54292135 |
|
Aga |
|
1519 |
4062 |
275 |
0 |
16493 |
|
0.16 |
-0.05 |
-0.29 |
n.v. |
0.02 |
|
N(4)-(beta-N-acetylglucosaminyl)-L-asparaginase isoform 1
precursor |
| 312839828 |
|
Agbl1 |
|
0 |
1129 |
4232 |
0 |
12519 |
|
n.v. |
-0.12 |
-0.43 |
n.v. |
-0.19 |
|
cytosolic carboxypeptidase 4 |
| 33563260 |
|
Agfg1 |
|
0 |
0 |
0 |
0 |
1371 |
|
n.v. |
n.v. |
n.v. |
n.v. |
-0.21 |
|
arf-GAP domain and FG repeat-containing protein 1 |
| 21704138 |
|
Agfg2 |
|
0 |
56 |
0 |
0 |
5633 |
|
n.v. |
0.58 |
n.v. |
n.v. |
0.28 |
|
arf-GAP domain and FG repeat-containing protein 2 isoform
1 |
| 30039690 |
|
Agfg2 |
|
0 |
56 |
0 |
0 |
5633 |
|
n.v. |
0.58 |
n.v. |
n.v. |
0.28 |
|
arf-GAP domain and FG repeat-containing protein 2 isoform
2 |
| 37537518 |
|
Agk |
|
0 |
1689 |
0 |
0 |
0 |
|
n.v. |
0.46 |
n.v. |
n.v. |
n.v. |
|
acylglycerol kinase, mitochondrial precursor |
| 124486747 |
|
Agl |
|
0 |
0 |
0 |
0 |
2667 |
|
n.v. |
n.v. |
n.v. |
n.v. |
-0.1 |
|
glycogen debranching enzyme |
| 251823852 |
|
Ago1 |
|
0 |
1369 |
22264 |
2300 |
0 |
|
n.v. |
0.29 |
0.07 |
0.38 |
n.v. |
|
protein argonaute-1 |
| 219842353 |
|
Ago2 |
|
0 |
4931 |
56954 |
30434 |
0 |
|
n.v. |
0.07 |
0.1 |
0.15 |
n.v. |
|
protein argonaute-2 |
| 240120065 |
|
Ago3 |
|
0 |
1369 |
18801 |
2300 |
0 |
|
n.v. |
0.29 |
0.07 |
0.38 |
n.v. |
|
protein argonaute-3 |
| 68448547 |
|
Ago4 |
|
0 |
956 |
10330 |
876 |
0 |
|
n.v. |
0.31 |
0.08 |
0.62 |
n.v. |
|
protein argonaute-4 |
| 23956162 |
|
Agpat2 |
|
0 |
1040 |
549 |
0 |
0 |
|
n.v. |
-0.33 |
-0.86 |
n.v. |
n.v. |
|
1-acyl-sn-glycerol-3-phosphate acyltransferase beta
precursor |
| 27229278 |
|
Agpat3 |
|
5602 |
6229 |
2750 |
270 |
0 |
|
-0.02 |
-0.23 |
-0.41 |
-0.37 |
n.v. |
|
1-acyl-sn-glycerol-3-phosphate acyltransferase gamma |
| 27229064 |
|
Agpat4 |
|
0 |
0 |
23 |
0 |
0 |
|
n.v. |
n.v. |
-0.36 |
n.v. |
n.v. |
|
1-acyl-sn-glycerol-3-phosphate acyltransferase delta |
| 27229077 |
|
Agpat5 |
|
0 |
1680 |
0 |
0 |
0 |
|
n.v. |
-0.47 |
n.v. |
n.v. |
n.v. |
|
1-acyl-sn-glycerol-3-phosphate acyltransferase
epsilon |
| 295444834 |
|
Agps |
|
6059 |
13137 |
17027 |
0 |
0 |
|
0.12 |
-0.06 |
-0.2 |
n.v. |
n.v. |
|
alkyldihydroxyacetonephosphate synthase, peroxisomal |
| 344217723 |
|
Agrn |
|
0 |
123 |
16 |
0 |
0 |
|
n.v. |
-0.14 |
-0.67 |
n.v. |
n.v. |
|
agrin precursor |
| 262263372 |
|
Ahcy |
|
34598 |
33507 |
59111 |
341968 |
567657 |
|
0.23 |
0.15 |
0 |
0.17 |
0 |
|
adenosylhomocysteinase |
| 27734986 |
|
Ahcyl1 |
|
0 |
1177 |
17544 |
9782 |
20423 |
|
n.v. |
-0.16 |
-0.21 |
0.18 |
0.18 |
|
putative adenosylhomocysteinase 2 |
| 283837832 |
|
Ahcyl2 |
|
0 |
601 |
12413 |
9782 |
8503 |
|
n.v. |
-0.13 |
-0.23 |
0.18 |
0.21 |
|
putative adenosylhomocysteinase 3 isoform 3 |
| 342307099 |
|
Ahcyl2 |
|
0 |
601 |
12413 |
9782 |
9863 |
|
n.v. |
-0.13 |
-0.23 |
0.18 |
0.24 |
|
putative adenosylhomocysteinase 3 isoform 1 |
| 342307101 |
|
Ahcyl2 |
|
0 |
601 |
12413 |
9782 |
9863 |
|
n.v. |
-0.13 |
-0.23 |
0.18 |
0.24 |
|
putative adenosylhomocysteinase 3 isoform 2 |
| 90403607 |
|
Ahnak |
|
0 |
0 |
388 |
0 |
0 |
|
n.v. |
n.v. |
0.48 |
n.v. |
n.v. |
|
AHNAK nucleoprotein isoform 3 |
| 61743961 |
|
Ahnak |
|
283176 |
100075 |
312862 |
36966 |
546313 |
|
0.22 |
0 |
0.05 |
-0.72 |
-0.5 |
|
AHNAK nucleoprotein isoform 1 |
| 309262791 |
|
Ahnak2 |
|
0 |
0 |
3 |
0 |
0 |
|
n.v. |
n.v. |
-1.19 |
n.v. |
n.v. |
|
PREDICTED: protein AHNAK2 |
| 22122515 |
|
Ahsa1 |
|
2966 |
3131 |
5438 |
23484 |
109365 |
|
-0.17 |
0.15 |
0.01 |
0.01 |
-0.01 |
|
activator of 90 kDa heat shock protein ATPase homolog 1 |
| 62530188 |
|
Ahsa2 |
|
0 |
0 |
0 |
0 |
1307 |
|
n.v. |
n.v. |
n.v. |
n.v. |
0.27 |
|
activator of 90 kDa heat shock protein ATPase homolog 2 |
| 37718970 |
|
AI314180 |
|
0 |
841 |
5634 |
85294 |
45066 |
|
n.v. |
0.44 |
0 |
0.08 |
0.03 |
|
proteasome-associated protein ECM29 homolog |
| 237858808 |
|
AI462493 |
|
0 |
977 |
76 |
0 |
0 |
|
n.v. |
0.1 |
-0.04 |
n.v. |
n.v. |
|
UPF0723 protein C11orf83 homolog precursor |
| 61557491 |
|
AI597468 |
|
0 |
1054 |
1637 |
5664 |
0 |
|
n.v. |
0.34 |
0.19 |
0.07 |
n.v. |
|
UPF0444 transmembrane protein C12orf23 homolog |
| 161484644 |
|
AI661453 |
|
0 |
0 |
12147 |
90 |
0 |
|
n.v. |
n.v. |
-0.49 |
-0.18 |
n.v. |
|
uncharacterized protein C6orf132 homolog |
| 208431789 |
|
AI837181 |
|
0 |
1192 |
686 |
794 |
11363 |
|
n.v. |
0.29 |
0.05 |
0.34 |
0.24 |
|
UPF0696 protein C11orf68 homolog isoform a |
| 32189430 |
|
Aida |
|
0 |
0 |
0 |
0 |
118 |
|
n.v. |
n.v. |
n.v. |
n.v. |
0.55 |
|
axin interactor, dorsalization-associated protein |
| 21553105 |
|
Aif1l |
|
220 |
831 |
4607 |
1080 |
13483 |
|
0.56 |
0.22 |
0.03 |
0.42 |
0.19 |
|
allograft inflammatory factor 1-like |
| 6755004 |
|
Aifm1 |
|
46754 |
20441 |
6382 |
0 |
0 |
|
-0.01 |
-0.06 |
-0.34 |
n.v. |
n.v. |
|
apoptosis-inducing factor 1, mitochondrial precursor |
| 262050654 |
|
Aifm2 |
|
0 |
23 |
3266 |
1359 |
0 |
|
n.v. |
0.09 |
0 |
0.12 |
n.v. |
|
apoptosis-inducing factor 2 isoform 1 |
| 30017355 |
|
Aifm2 |
|
0 |
54 |
4908 |
1359 |
0 |
|
n.v. |
0.07 |
0.01 |
0.12 |
n.v. |
|
apoptosis-inducing factor 2 isoform 2 |
| 163965368 |
|
Aim1 |
|
0 |
0 |
9 |
2136 |
4905 |
|
n.v. |
n.v. |
0.74 |
-0.22 |
-0.21 |
|
absent in melanoma 1 protein |
| 126012517 |
|
Aimp1 |
|
0 |
67 |
4369 |
310405 |
13333 |
|
n.v. |
0.12 |
0.01 |
0.06 |
-0.17 |
|
aminoacyl tRNA synthase complex-interacting
multifunctional protein 1 |
| 22122695 |
|
Aimp2 |
|
348 |
2653 |
1184 |
120230 |
2752 |
|
0.41 |
0.11 |
0.04 |
0.01 |
-0.05 |
|
aminoacyl tRNA synthase complex-interacting
multifunctional protein 2 isoform 2 |
| 288541337 |
|
Aimp2 |
|
348 |
4528 |
2453 |
137370 |
8643 |
|
0.41 |
0.1 |
0.03 |
0.01 |
-0.08 |
|
aminoacyl tRNA synthase complex-interacting
multifunctional protein 2 isoform 1 |
| 7709982 |
|
Aip |
|
1098 |
3835 |
1759 |
1449 |
21515 |
|
0.2 |
0.14 |
-0.03 |
-0.04 |
0.19 |
|
AH receptor-interacting protein |
| 219283242 |
|
AK010878 |
|
0 |
0 |
0 |
319 |
107 |
|
n.v. |
n.v. |
n.v. |
0.52 |
-0.19 |
|
uncharacterized protein C14orf142 homolog |
| 34328230 |
|
Ak2 |
|
11771 |
8755 |
86 |
0 |
7904 |
|
0.03 |
-0.16 |
-0.07 |
n.v. |
0.24 |
|
adenylate kinase 2, mitochondrial isoform b |
| 77020262 |
|
Ak2 |
|
11771 |
8755 |
86 |
0 |
7904 |
|
0.03 |
-0.16 |
-0.07 |
n.v. |
0.24 |
|
adenylate kinase 2, mitochondrial isoform a |
| 23956104 |
|
Ak3 |
|
64785 |
23084 |
72 |
0 |
6586 |
|
-0.02 |
-0.08 |
0.01 |
n.v. |
0.07 |
|
GTP:AMP phosphotransferase AK3, mitochondrial |
| 13626040 |
|
Akap12 |
|
10142 |
19631 |
64698 |
471169 |
551100 |
|
0.23 |
0.14 |
-0.04 |
-0.1 |
0.19 |
|
A-kinase anchor protein 12 |
| 189181672 |
|
Akap13 |
|
0 |
0 |
82 |
0 |
18956 |
|
n.v. |
n.v. |
0.27 |
0.41 |
-0.18 |
|
A kinase (PRKA) anchor protein 13 |
| 78711832 |
|
Akap2 |
|
0 |
0 |
0 |
0 |
728 |
|
n.v. |
n.v. |
n.v. |
n.v. |
0.48 |
|
A-kinase anchor protein 2 isoform 3 |
| 78711834 |
|
Akap2 |
|
0 |
0 |
0 |
0 |
728 |
|
n.v. |
n.v. |
n.v. |
n.v. |
0.48 |
|
A-kinase anchor protein 2 isoform 2 |
| 78711836 |
|
Akap2 |
|
0 |
0 |
0 |
0 |
728 |
|
n.v. |
n.v. |
n.v. |
n.v. |
0.48 |
|
A-kinase anchor protein 2 isoform 1 |
| 31560394 |
|
Akap8 |
|
0 |
0 |
310 |
10175 |
19620 |
|
n.v. |
n.v. |
-0.05 |
0.37 |
-0.7 |
|
A-kinase anchor protein 8 |
| 125661048 |
|
Akap9 |
|
0 |
165 |
329 |
3012 |
16803 |
|
n.v. |
-0.22 |
-0.21 |
0.16 |
0.04 |
|
A-kinase anchor protein 9 |
| 10946870 |
|
Akr1a1 |
|
0 |
6187 |
6885 |
5763 |
160300 |
|
n.v. |
0.15 |
0.05 |
0.06 |
0.06 |
|
alcohol dehydrogenase [NADP(+)] |
| 71067102 |
|
Akr1b10 |
|
2783 |
0 |
413 |
0 |
11288 |
|
0.29 |
n.v. |
-0.15 |
n.v. |
0.06 |
|
aldo-keto reductase family 1, member B10 |
| 160707894 |
|
Akr1b3 |
|
65005 |
34156 |
55223 |
31203 |
474549 |
|
0.15 |
0.18 |
0.07 |
0.13 |
0.14 |
|
aldose reductase |
| 160415215 |
|
Akr1b7 |
|
2783 |
0 |
243 |
0 |
9071 |
|
0.29 |
n.v. |
-0.27 |
n.v. |
0.06 |
|
aldose reductase-related protein 1 |
| 6679791 |
|
Akr1b8 |
|
2783 |
0 |
42 |
0 |
13387 |
|
0.29 |
n.v. |
-0.15 |
n.v. |
0.06 |
|
aldose reductase-related protein 2 |
| 85719330 |
|
Akr1c12 |
|
2783 |
1108 |
1838 |
0 |
9339 |
|
0.29 |
0.12 |
-0.11 |
n.v. |
0.18 |
|
aldo-keto reductase family 1, member C12 |
| 171846276 |
|
Akr1c13 |
|
2783 |
1858 |
2360 |
0 |
13558 |
|
0.29 |
0.21 |
-0.05 |
n.v. |
0.18 |
|
aldo-keto reductase family 1 member C13 |
| 282398141 |
|
Akr1c19 |
|
3808 |
5035 |
8318 |
5214 |
96418 |
|
0.29 |
0.24 |
-0.02 |
0.21 |
0.18 |
|
aldo-keto reductase family 1, member C19 |
| 93277108 |
|
Akr1e1 |
|
0 |
3490 |
1573 |
5059 |
163888 |
|
n.v. |
0.19 |
0 |
0.23 |
-0.01 |
|
1,5-anhydro-D-fructose reductase |
| 240120054 |
|
Akr7a5 |
|
220 |
1754 |
559 |
663 |
12723 |
|
0.33 |
0.08 |
0.04 |
-0.43 |
0.16 |
|
aflatoxin B1 aldehyde reductase member 2 |
| 260166608 |
|
Akt1 |
|
0 |
1192 |
237 |
8136 |
13494 |
|
n.v. |
0.04 |
-0.33 |
-0.02 |
0.13 |
|
RAC-alpha serine/threonine-protein kinase isoform 2 |
| 6753034 |
|
Akt1 |
|
0 |
1192 |
237 |
8136 |
13494 |
|
n.v. |
0.04 |
-0.33 |
-0.02 |
0.13 |
|
RAC-alpha serine/threonine-protein kinase isoform 1 |
| 21312878 |
|
Akt1s1 |
|
0 |
0 |
0 |
0 |
86 |
|
n.v. |
n.v. |
n.v. |
n.v. |
-0.11 |
|
proline-rich AKT1 substrate 1 |
| 6680674 |
|
Akt2 |
|
0 |
119 |
0 |
1293 |
3191 |
|
n.v. |
0.04 |
n.v. |
0.31 |
0.24 |
|
RAC-beta serine/threonine-protein kinase |
| 190883484 |
|
Akt3 |
|
0 |
119 |
0 |
1228 |
2688 |
|
n.v. |
0.04 |
n.v. |
0.47 |
0.13 |
|
RAC-gamma serine/threonine-protein kinase |
| 6753918 |
|
Aktip |
|
0 |
706 |
160 |
1408 |
3256 |
|
n.v. |
0.54 |
0.01 |
0.42 |
0.01 |
|
AKT-interacting protein |
| 34328485 |
|
Alad |
|
7670 |
14410 |
23726 |
111340 |
186827 |
|
0.02 |
0.07 |
0.01 |
0.16 |
-0.01 |
|
delta-aminolevulinic acid dehydratase |
| 163310765 |
|
Alb |
|
0 |
13 |
0 |
0 |
0 |
|
n.v. |
-1.46 |
n.v. |
n.v. |
n.v. |
|
serum albumin precursor |
| 31791059 |
|
Alcam |
|
42232 |
10246 |
30857 |
0 |
0 |
|
0.11 |
-0.13 |
-0.31 |
n.v. |
n.v. |
|
CD166 antigen precursor |
| 26080429 |
|
Aldh16a1 |
|
0 |
33 |
1080 |
46306 |
4509 |
|
n.v. |
0.59 |
0.07 |
0.02 |
-0.04 |
|
aldehyde dehydrogenase family 16 member A1 |
| 255958292 |
|
Aldh18a1 |
|
70332 |
12995 |
275 |
57 |
129 |
|
0 |
-0.12 |
-0.31 |
0.3 |
-0.15 |
|
delta-1-pyrroline-5-carboxylate synthase isoform 1 |
| 255958294 |
|
Aldh18a1 |
|
70332 |
12995 |
275 |
57 |
129 |
|
0 |
-0.12 |
-0.31 |
0.3 |
-0.15 |
|
delta-1-pyrroline-5-carboxylate synthase isoform 2 |
| 85861182 |
|
Aldh1a1 |
|
0 |
0 |
0 |
3495 |
8203 |
|
n.v. |
n.v. |
n.v. |
0.64 |
0.27 |
|
retinal dehydrogenase 1 |
| 7106242 |
|
Aldh1a7 |
|
0 |
0 |
0 |
1678 |
4584 |
|
n.v. |
n.v. |
n.v. |
0.7 |
0.29 |
|
aldehyde dehydrogenase, cytosolic 1 |
| 6753036 |
|
Aldh2 |
|
5968 |
9728 |
518 |
0 |
0 |
|
-0.04 |
-0.22 |
-0.01 |
n.v. |
n.v. |
|
aldehyde dehydrogenase, mitochondrial precursor |
| 163310769 |
|
Aldh3a1 |
|
0 |
1424 |
1023 |
0 |
0 |
|
n.v. |
-0.09 |
-0.18 |
n.v. |
n.v. |
|
aldehyde dehydrogenase, dimeric NADP-preferring |
| 75677435 |
|
Aldh3a2 |
|
10325 |
10160 |
8219 |
3070 |
0 |
|
-0.1 |
-0.1 |
-0.26 |
0.04 |
n.v. |
|
fatty aldehyde dehydrogenase |
| 34328288 |
|
Aldh3b1 |
|
696 |
9461 |
21827 |
1179 |
1092 |
|
0.38 |
-0.03 |
-0.18 |
-0.21 |
0.13 |
|
aldehyde dehydrogenase family 3 member B1 |
| 294460012 |
|
Aldh3b2 |
|
696 |
19881 |
28080 |
16797 |
1349 |
|
0.38 |
-0.14 |
-0.14 |
-0.21 |
-0.57 |
|
aldehyde dehydrogenase 3 family, member B2 |
| 407262588 |
|
Aldh3b2 |
|
696 |
9348 |
17681 |
1179 |
1092 |
|
0.38 |
-0.09 |
-0.16 |
-0.21 |
0.13 |
|
PREDICTED: aldehyde dehydrogenase family 3 member B1 |
| 27369748 |
|
Aldh5a1 |
|
1373 |
5208 |
0 |
0 |
0 |
|
0.09 |
-0.19 |
n.v. |
n.v. |
n.v. |
|
succinate-semialdehyde dehydrogenase, mitochondrial
precursor |
| 19527258 |
|
Aldh6a1 |
|
23761 |
31336 |
0 |
0 |
0 |
|
-0.06 |
-0.16 |
n.v. |
n.v. |
n.v. |
|
methylmalonate-semialdehyde dehydrogenase [acylating],
mitochondrial precursor |
| 188035915 |
|
Aldh7a1 |
|
0 |
2973 |
1822 |
17304 |
33382 |
|
n.v. |
-0.1 |
-0.09 |
0.23 |
0.03 |
|
alpha-aminoadipic semialdehyde dehydrogenase isoform
b |
| 188219757 |
|
Aldh7a1 |
|
0 |
2973 |
1822 |
17304 |
33382 |
|
n.v. |
-0.1 |
-0.09 |
0.23 |
0.03 |
|
alpha-aminoadipic semialdehyde dehydrogenase isoform
a |
| 115334671 |
|
Aldh9a1 |
|
0 |
3697 |
3329 |
9528 |
93858 |
|
n.v. |
0.23 |
-0.03 |
0.2 |
0.03 |
|
4-trimethylaminobutyraldehyde dehydrogenase |
| 293597567 |
|
Aldoa |
|
411153 |
58799 |
168779 |
662638 |
1634120 |
|
0.17 |
0.1 |
0 |
0.18 |
0.01 |
|
fructose-bisphosphate aldolase A isoform 1 precursor |
| 6671539 |
|
Aldoa |
|
411153 |
58799 |
175470 |
757091 |
1696921 |
|
0.17 |
0.1 |
0 |
0.18 |
0.02 |
|
fructose-bisphosphate aldolase A isoform 2 |
| 312922382 |
|
Aldoart1 |
|
327257 |
14158 |
117967 |
382683 |
1121167 |
|
0.15 |
0.09 |
0 |
0.18 |
-0.01 |
|
aldolase 1 A retrogene 1 |
| 476007882 |
|
Aldoart2 |
|
49847 |
0 |
21584 |
0 |
0 |
|
0.15 |
n.v. |
-0.13 |
n.v. |
n.v. |
|
fructose-bisphosphate aldolase A-like |
| 21450291 |
|
Aldob |
|
0 |
1405 |
14607 |
2529 |
479454 |
|
n.v. |
0.16 |
0.01 |
0.24 |
-0.01 |
|
fructose-bisphosphate aldolase B |
| 60687506 |
|
Aldoc |
|
20356 |
6108 |
18571 |
114254 |
672075 |
|
0.58 |
0.21 |
0.03 |
0.26 |
-0.01 |
|
fructose-bisphosphate aldolase C |
| 215276946 |
|
Alg12 |
|
0 |
125 |
4 |
0 |
0 |
|
n.v. |
-0.37 |
-0.93 |
n.v. |
n.v. |
|
dol-P-Man:Man(7)GlcNAc(2)-PP-Dol
alpha-1,6-mannosyltransferase isoform 1 |
| 13195608 |
|
Alg14 |
|
128 |
582 |
78 |
0 |
0 |
|
-0.06 |
1.07 |
0.92 |
n.v. |
n.v. |
|
UDP-N-acetylglucosamine transferase subunit ALG14
homolog |
| 21728372 |
|
Alg5 |
|
0 |
514 |
0 |
0 |
0 |
|
n.v. |
0.98 |
n.v. |
n.v. |
n.v. |
|
dolichyl-phosphate beta-glucosyltransferase |
| 110625726 |
|
Alkbh3 |
|
0 |
167 |
31 |
0 |
2217 |
|
n.v. |
-0.46 |
0.05 |
n.v. |
-0.13 |
|
alpha-ketoglutarate-dependent dioxygenase alkB homolog
3 |
| 31044423 |
|
Alkbh5 |
|
0 |
0 |
320 |
1089 |
54 |
|
n.v. |
n.v. |
0.08 |
0.67 |
0.27 |
|
RNA demethylase ALKBH5 |
| 189181674 |
|
Als2 |
|
0 |
0 |
0 |
0 |
1124 |
|
n.v. |
n.v. |
n.v. |
n.v. |
-0.77 |
|
alsin isoform 2 |
| 237757295 |
|
Als2 |
|
0 |
0 |
0 |
0 |
1124 |
|
n.v. |
n.v. |
n.v. |
n.v. |
-0.77 |
|
alsin isoform 1 |
| 6755763 |
|
Alyref |
|
33335 |
0 |
1596 |
5804 |
0 |
|
0 |
n.v. |
-0.1 |
0.05 |
n.v. |
|
THO complex subunit 4 |
| 148238335 |
|
Alyref2 |
|
20301 |
0 |
1566 |
2177 |
0 |
|
-0.06 |
n.v. |
-0.1 |
-0.15 |
n.v. |
|
aly/REF export factor 2 |
| 46518506 |
|
Amacr |
|
0 |
58 |
776 |
0 |
0 |
|
n.v. |
-0.11 |
0 |
n.v. |
n.v. |
|
alpha-methylacyl-CoA racemase |
| 31982133 |
|
Amdhd2 |
|
0 |
0 |
612 |
2194 |
23390 |
|
n.v. |
n.v. |
0.09 |
-0.33 |
-0.04 |
|
putative N-acetylglucosamine-6-phosphate deacetylase |
| 113205073 |
|
Amfr |
|
0 |
401 |
0 |
0 |
0 |
|
n.v. |
-0.62 |
n.v. |
n.v. |
n.v. |
|
E3 ubiquitin-protein ligase AMFR |
| 9506383 |
|
Ammecr1 |
|
0 |
0 |
0 |
0 |
0 |
|
n.v. |
n.v. |
n.v. |
2.03 |
n.v. |
|
AMME syndrome candidate gene 1 protein homolog |
| 23943793 |
|
Ammecr1l |
|
0 |
10 |
0 |
0 |
0 |
|
n.v. |
0.45 |
n.v. |
n.v. |
n.v. |
|
AMMECR1-like protein isoform 2 |
| 334848200 |
|
Ammecr1l |
|
0 |
10 |
0 |
0 |
0 |
|
n.v. |
0.45 |
n.v. |
n.v. |
n.v. |
|
AMMECR1-like protein isoform 1 |
| 114431240 |
|
Ampd1 |
|
0 |
0 |
0 |
352 |
0 |
|
n.v. |
-0.33 |
n.v. |
0.19 |
n.v. |
|
AMP deaminase 1 |
| 21311925 |
|
Ampd2 |
|
0 |
0 |
162 |
12532 |
5944 |
|
n.v. |
n.v. |
0.31 |
0.21 |
-0.11 |
|
AMP deaminase 2 |
| 66792802 |
|
Ampd3 |
|
0 |
81 |
179 |
41861 |
8214 |
|
n.v. |
0.09 |
0.06 |
0.2 |
0.27 |
|
AMP deaminase 3 |
| 228008323 |
|
Anapc1 |
|
0 |
0 |
13 |
6270 |
0 |
|
n.v. |
n.v. |
0.66 |
-0.04 |
n.v. |
|
anaphase-promoting complex subunit 1 |
| 84039696 |
|
Anapc11 |
|
0 |
44 |
0 |
524 |
214 |
|
n.v. |
0.59 |
n.v. |
0.02 |
0.17 |
|
anaphase-promoting complex subunit 11 |
| 31088920 |
|
Anapc13 |
|
0 |
0 |
0 |
508 |
0 |
|
n.v. |
n.v. |
n.v. |
-0.36 |
n.v. |
|
anaphase-promoting complex subunit 13 |
| 13384936 |
|
Anapc16 |
|
0 |
0 |
0 |
0 |
21 |
|
n.v. |
n.v. |
n.v. |
n.v. |
0.48 |
|
anaphase-promoting complex subunit 16 |
| 260763928 |
|
Anapc2 |
|
0 |
0 |
376 |
4813 |
525 |
|
n.v. |
n.v. |
0.08 |
-0.27 |
0.45 |
|
anaphase-promoting complex subunit 2 |
| 23956182 |
|
Anapc4 |
|
0 |
0 |
0 |
3544 |
0 |
|
n.v. |
n.v. |
n.v. |
0.17 |
n.v. |
|
anaphase-promoting complex subunit 4 |
| 109809751 |
|
Anapc5 |
|
0 |
0 |
142 |
23828 |
771 |
|
n.v. |
n.v. |
0.09 |
-0.01 |
-2.88 |
|
anaphase-promoting complex subunit 5 isoform a |
| 109809753 |
|
Anapc5 |
|
0 |
0 |
142 |
23378 |
771 |
|
n.v. |
n.v. |
0.09 |
-0.02 |
-2.88 |
|
anaphase-promoting complex subunit 5 isoform b |
| 163310734 |
|
Angel1 |
|
0 |
0 |
405 |
0 |
0 |
|
n.v. |
n.v. |
0.17 |
n.v. |
n.v. |
|
protein angel homolog 1 |
| 116256499 |
|
Ank3 |
|
0 |
63 |
0 |
0 |
0 |
|
n.v. |
2.82 |
n.v. |
n.v. |
n.v. |
|
ankyrin-3 isoform i |
| 22129789 |
|
Ank3 |
|
0 |
63 |
0 |
0 |
0 |
|
n.v. |
2.82 |
n.v. |
n.v. |
n.v. |
|
ankyrin-3 isoform g |
| 86262153 |
|
Ank3 |
|
0 |
63 |
0 |
0 |
0 |
|
n.v. |
2.82 |
n.v. |
n.v. |
n.v. |
|
ankyrin-3 isoform f |
| 116256491 |
|
Ank3 |
|
0 |
63 |
148 |
0 |
0 |
|
n.v. |
2.82 |
0.35 |
n.v. |
n.v. |
|
ankyrin-3 isoform a |
| 116256493 |
|
Ank3 |
|
0 |
63 |
148 |
0 |
0 |
|
n.v. |
2.82 |
0.35 |
n.v. |
n.v. |
|
ankyrin-3 isoform d |
| 116256497 |
|
Ank3 |
|
0 |
63 |
148 |
0 |
0 |
|
n.v. |
2.82 |
0.35 |
n.v. |
n.v. |
|
ankyrin-3 isoform b |
| 116256503 |
|
Ank3 |
|
0 |
63 |
148 |
0 |
0 |
|
n.v. |
2.82 |
0.35 |
n.v. |
n.v. |
|
ankyrin-3 isoform e |
| 116256505 |
|
Ank3 |
|
0 |
63 |
148 |
0 |
0 |
|
n.v. |
2.82 |
0.35 |
n.v. |
n.v. |
|
ankyrin-3 isoform h |
| 25121946 |
|
Ank3 |
|
0 |
63 |
148 |
0 |
0 |
|
n.v. |
2.82 |
0.35 |
n.v. |
n.v. |
|
ankyrin-3 isoform c |
| 85702366 |
|
Ankfy1 |
|
1593 |
2670 |
7707 |
2177 |
31957 |
|
-0.03 |
-0.08 |
-0.07 |
0.52 |
0.1 |
|
ankyrin repeat and FYVE domain-containing protein 1 |
| 158749543 |
|
Ankhd1 |
|
0 |
29 |
5915 |
3086 |
2581 |
|
n.v. |
0.77 |
0.3 |
0.32 |
-0.44 |
|
ankyrin repeat and KH domain-containing protein 1 |
| 61656165 |
|
Ankib1 |
|
0 |
0 |
13 |
0 |
139 |
|
n.v. |
n.v. |
0.15 |
n.v. |
0.29 |
|
ankyrin repeat and IBR domain-containing protein 1 |
| 189181677 |
|
Ankle1 |
|
0 |
340 |
0 |
0 |
0 |
|
n.v. |
-0.05 |
n.v. |
n.v. |
n.v. |
|
ankyrin repeat and LEM domain containing 1 |
| 269308251 |
|
Ankmy2 |
|
0 |
499 |
641 |
2341 |
11791 |
|
n.v. |
0.19 |
0.28 |
0.18 |
0.1 |
|
ankyrin repeat and MYND domain-containing protein 2 |
| 61651675 |
|
Ankrd13a |
|
0 |
0 |
4 |
0 |
0 |
|
n.v. |
n.v. |
-0.54 |
n.v. |
n.v. |
|
ankyrin repeat domain-containing protein 13A |
| 142363888 |
|
Ankrd13d |
|
0 |
0 |
4 |
0 |
0 |
|
n.v. |
n.v. |
-0.54 |
n.v. |
n.v. |
|
ankyrin repeat domain-containing protein 13D |
| 40549395 |
|
Ankrd17 |
|
0 |
86 |
7039 |
3086 |
2206 |
|
n.v. |
-0.48 |
0.27 |
0.32 |
-0.48 |
|
ankyrin repeat domain-containing protein 17 isoform
b |
| 40549397 |
|
Ankrd17 |
|
0 |
86 |
7039 |
3086 |
2206 |
|
n.v. |
-0.48 |
0.27 |
0.32 |
-0.48 |
|
ankyrin repeat domain-containing protein 17 isoform
a |
| 48597001 |
|
Ankrd22 |
|
0 |
52 |
0 |
0 |
0 |
|
n.v. |
-0.11 |
n.v. |
n.v. |
n.v. |
|
ankyrin repeat domain-containing protein 22 |
| 66841376 |
|
Ankrd28 |
|
0 |
0 |
0 |
982 |
2388 |
|
n.v. |
n.v. |
n.v. |
-0.12 |
-0.07 |
|
serine/threonine-protein phosphatase 6 regulatory ankyrin
repeat subunit A |
| 125656161 |
|
Ankrd40 |
|
0 |
79 |
41 |
336 |
0 |
|
n.v. |
0.19 |
0.07 |
0.89 |
n.v. |
|
ankyrin repeat domain-containing protein 40 isoform
1 |
| 125656167 |
|
Ankrd40 |
|
0 |
79 |
41 |
336 |
0 |
|
n.v. |
0.19 |
0.07 |
0.89 |
n.v. |
|
ankyrin repeat domain-containing protein 40 isoform
2 |
| 29789417 |
|
Ankrd46 |
|
0 |
1749 |
0 |
0 |
0 |
|
n.v. |
-0.27 |
n.v. |
n.v. |
n.v. |
|
ankyrin repeat domain-containing protein 46 |
| 31088892 |
|
Anks1 |
|
0 |
0 |
31 |
0 |
278 |
|
n.v. |
n.v. |
-0.06 |
n.v. |
0.85 |
|
ankyrin repeat and SAM domain-containing protein 1A |
| 188528655 |
|
Anks3 |
|
0 |
0 |
0 |
0 |
2292 |
|
n.v. |
n.v. |
n.v. |
n.v. |
-0.15 |
|
ankyrin repeat and SAM domain-containing protein 3 |
| 110556649 |
|
Ankzf1 |
|
0 |
0 |
328 |
794 |
0 |
|
n.v. |
n.v. |
-2.14 |
0.25 |
n.v. |
|
ankyrin repeat and zinc finger domain-containing protein
1 isoform 1 |
| 251823794 |
|
Anln |
|
0 |
251 |
860 |
0 |
0 |
|
n.v. |
0.22 |
0.21 |
n.v. |
n.v. |
|
actin-binding protein anillin |
| 30794236 |
|
Ano10 |
|
0 |
405 |
0 |
0 |
0 |
|
n.v. |
-0.38 |
n.v. |
n.v. |
n.v. |
|
anoctamin-10 isoform 1 |
| 428673529 |
|
Ano10 |
|
0 |
405 |
0 |
0 |
0 |
|
n.v. |
-0.38 |
n.v. |
n.v. |
n.v. |
|
anoctamin-10 isoform 2 |
| 359465539 |
|
Ano6 |
|
0 |
2288 |
8209 |
0 |
0 |
|
n.v. |
0.14 |
0 |
n.v. |
n.v. |
|
anoctamin-6 isoform 1 |
| 40254290 |
|
Ano6 |
|
0 |
2288 |
8209 |
0 |
0 |
|
n.v. |
0.14 |
0 |
n.v. |
n.v. |
|
anoctamin-6 isoform 2 |
| 40254600 |
|
Anp32a |
|
9592 |
1488 |
5378 |
3847 |
170260 |
|
0.02 |
0.05 |
0.11 |
0.3 |
0 |
|
acidic leucine-rich nuclear phosphoprotein 32 family
member A |
| 18700032 |
|
Anp32b |
|
6792 |
4127 |
2802 |
10248 |
178645 |
|
0.03 |
0.12 |
0.17 |
0.03 |
-0.02 |
|
acidic leucine-rich nuclear phosphoprotein 32 family
member B |
| 359279954 |
|
Anp32e |
|
0 |
0 |
0 |
0 |
7186 |
|
n.v. |
n.v. |
n.v. |
n.v. |
0.09 |
|
acidic leucine-rich nuclear phosphoprotein 32 family
member E isoform 3 |
| 254587996 |
|
Anp32e |
|
586 |
2336 |
1076 |
819 |
40867 |
|
0.02 |
0.31 |
0.15 |
-0.05 |
0.1 |
|
acidic leucine-rich nuclear phosphoprotein 32 family
member E isoform 1 |
| 359279956 |
|
Anp32e |
|
586 |
2336 |
1076 |
819 |
40867 |
|
0.02 |
0.31 |
0.15 |
-0.05 |
0.1 |
|
acidic leucine-rich nuclear phosphoprotein 32 family
member E isoform 2 |
| 225637487 |
|
Anpep |
|
0 |
0 |
4337 |
0 |
0 |
|
n.v. |
n.v. |
-0.31 |
n.v. |
n.v. |
|
aminopeptidase N |
| 124517663 |
|
Anxa1 |
|
286782 |
76301 |
140073 |
154200 |
693526 |
|
0.09 |
0.19 |
-0.01 |
0.05 |
0.07 |
|
annexin A1 |
| 160707921 |
|
Anxa11 |
|
31505 |
84306 |
169887 |
536318 |
99288 |
|
0.08 |
0.04 |
-0.04 |
0.09 |
-0.05 |
|
annexin A11 |
| 6996913 |
|
Anxa2 |
|
1621803 |
235762 |
444728 |
757607 |
94843 |
|
-0.05 |
-0.11 |
-0.22 |
-0.35 |
-0.33 |
|
annexin A2 |
| 160707925 |
|
Anxa3 |
|
48914 |
55044 |
46554 |
64756 |
448535 |
|
0.29 |
0.27 |
0.14 |
0.17 |
0.21 |
|
annexin A3 |
| 161016799 |
|
Anxa4 |
|
145624 |
67796 |
140695 |
471046 |
110618 |
|
0.02 |
0.06 |
-0.02 |
0.02 |
0.02 |
|
annexin A4 |
| 6753060 |
|
Anxa5 |
|
224981 |
87133 |
129441 |
69487 |
552878 |
|
-0.01 |
0.05 |
-0.14 |
-0.07 |
0.09 |
|
annexin A5 |
| 158966670 |
|
Anxa6 |
|
18471 |
85786 |
169005 |
228025 |
247036 |
|
0.11 |
0.02 |
-0.09 |
0.04 |
0.04 |
|
annexin A6 isoform b |
| 31981302 |
|
Anxa6 |
|
18471 |
84300 |
163071 |
223040 |
235588 |
|
0.11 |
0.02 |
-0.09 |
0.06 |
0.04 |
|
annexin A6 isoform a |
| 160707956 |
|
Anxa7 |
|
0 |
15953 |
20738 |
3454 |
119218 |
|
n.v. |
0.11 |
-0.16 |
0.13 |
0.15 |
|
annexin A7 |
| 145864475 |
|
Anxa9 |
|
82340 |
21190 |
1967 |
9291 |
11566 |
|
0.16 |
-0.01 |
-0.01 |
-0.46 |
-0.22 |
|
annexin A9 |
| 34098972 |
|
Aoc2 |
|
2343 |
0 |
0 |
0 |
0 |
|
0.07 |
n.v. |
n.v. |
n.v. |
n.v. |
|
retina-specific copper amine oxidase |
| 6753066 |
|
Aoc3 |
|
2343 |
0 |
0 |
0 |
0 |
|
0.07 |
n.v. |
n.v. |
n.v. |
n.v. |
|
membrane primary amine oxidase |
| 339895913 |
|
Ap1b1 |
|
82670 |
20890 |
87929 |
112699 |
63946 |
|
0.09 |
0.11 |
0.17 |
-0.07 |
-0.24 |
|
AP-1 complex subunit beta-1 isoform 1 |
| 339895916 |
|
Ap1b1 |
|
82670 |
20890 |
87929 |
112822 |
63946 |
|
0.09 |
0.11 |
0.17 |
-0.07 |
-0.24 |
|
AP-1 complex subunit beta-1 isoform 3 |
| 88853578 |
|
Ap1b1 |
|
82670 |
20890 |
87929 |
112822 |
63946 |
|
0.09 |
0.11 |
0.17 |
-0.07 |
-0.24 |
|
AP-1 complex subunit beta-1 isoform 2 |
| 56744242 |
|
Ap1g1 |
|
16713 |
9348 |
41219 |
30712 |
23261 |
|
0.46 |
-0.02 |
0.18 |
-0.11 |
-0.15 |
|
AP-1 complex subunit gamma-1 |
| 160707961 |
|
Ap1g2 |
|
586 |
607 |
6941 |
3143 |
2249 |
|
0.18 |
-0.16 |
0.18 |
-0.05 |
-0.98 |
|
AP-1 complex subunit gamma-like 2 |
| 6671557 |
|
Ap1m1 |
|
0 |
7244 |
14477 |
0 |
9992 |
|
n.v. |
-0.04 |
0.19 |
n.v. |
-0.2 |
|
AP-1 complex subunit mu-1 |
| 160333502 |
|
Ap1m2 |
|
11258 |
14698 |
28418 |
26497 |
37044 |
|
0.08 |
0.04 |
0.2 |
0.07 |
-0.18 |
|
AP-1 complex subunit mu-2 isoform 1 |
| 160333508 |
|
Ap1m2 |
|
11258 |
14166 |
30216 |
25817 |
34881 |
|
0.08 |
0.04 |
0.18 |
0.08 |
-0.14 |
|
AP-1 complex subunit mu-2 isoform 2 |
| 6671559 |
|
Ap1s1 |
|
3405 |
5000 |
4655 |
7842 |
8129 |
|
0.06 |
0.07 |
0.2 |
0.07 |
-0.02 |
|
AP-1 complex subunit sigma-1A |
| 40254484 |
|
Ap1s2 |
|
0 |
553 |
227 |
3274 |
568 |
|
n.v. |
-0.07 |
0.2 |
0.1 |
0.03 |
|
AP-1 complex subunit sigma-2 |
| 35215317 |
|
Ap1s3 |
|
0 |
768 |
438 |
5787 |
0 |
|
n.v. |
0 |
0.15 |
-0.03 |
n.v. |
|
AP-1 complex subunit sigma-3 |
| 116256510 |
|
Ap2a1 |
|
3625 |
5254 |
23363 |
38300 |
3984 |
|
0.58 |
0.2 |
0.14 |
-0.35 |
-0.42 |
|
AP-2 complex subunit alpha-1 isoform b |
| 6671561 |
|
Ap2a1 |
|
3625 |
5254 |
23363 |
38300 |
3984 |
|
0.58 |
0.2 |
0.14 |
-0.35 |
-0.42 |
|
AP-2 complex subunit alpha-1 isoform a |
| 163644277 |
|
Ap2a2 |
|
4284 |
8728 |
18455 |
46478 |
5954 |
|
0.74 |
0.32 |
0.2 |
-0.44 |
-0.6 |
|
AP-2 complex subunit alpha-2 |
| 21313640 |
|
Ap2b1 |
|
86679 |
24407 |
69780 |
127277 |
57628 |
|
0.1 |
0.19 |
0.17 |
-0.31 |
-0.27 |
|
AP-2 complex subunit beta isoform b |
| 78711838 |
|
Ap2b1 |
|
86679 |
24407 |
69780 |
127277 |
57628 |
|
0.1 |
0.19 |
0.17 |
-0.31 |
-0.27 |
|
AP-2 complex subunit beta isoform a |
| 6753074 |
|
Ap2m1 |
|
897 |
5121 |
27475 |
25801 |
1221 |
|
-0.38 |
0.42 |
0.15 |
-0.39 |
-0.68 |
|
AP-2 complex subunit mu |
| 161086984 |
|
Ap2s1 |
|
0 |
1468 |
63 |
172 |
2131 |
|
n.v. |
0.56 |
0.09 |
-0.69 |
-0.25 |
|
AP-2 complex subunit sigma |
| 163310776 |
|
Ap3b1 |
|
18 |
7755 |
5692 |
56186 |
20519 |
|
-0.27 |
0.09 |
-0.11 |
0 |
-0.01 |
|
AP-3 complex subunit beta-1 |
| 52317148 |
|
Ap3b2 |
|
0 |
269 |
356 |
4600 |
0 |
|
n.v. |
-0.19 |
-0.21 |
0 |
n.v. |
|
AP-3 complex subunit beta-2 |
| 6671565 |
|
Ap3d1 |
|
73 |
1219 |
11629 |
38955 |
4016 |
|
1.49 |
-0.21 |
0.01 |
0.16 |
0.03 |
|
AP-3 complex subunit delta-1 |
| 254281313 |
|
Ap3m1 |
|
0 |
4555 |
5776 |
7563 |
3941 |
|
n.v. |
0.09 |
-0.07 |
0 |
-0.19 |
|
AP-3 complex subunit mu-1 |
| 170763481 |
|
Ap3m2 |
|
0 |
2019 |
3481 |
1441 |
1307 |
|
n.v. |
0.07 |
0.04 |
-0.06 |
0.2 |
|
AP-3 complex subunit mu-2 |
| 6753078 |
|
Ap3s1 |
|
0 |
520 |
781 |
900 |
707 |
|
n.v. |
0.11 |
-0.1 |
0.12 |
-0.27 |
|
AP-3 complex subunit sigma-1 |
| 160707971 |
|
Ap3s2 |
|
0 |
1010 |
540 |
2439 |
707 |
|
n.v. |
0.19 |
-0.11 |
0.1 |
-0.02 |
|
AP-3 complex subunit sigma-2 |
| 254588018 |
|
Ap4b1 |
|
0 |
69 |
15 |
540 |
0 |
|
n.v. |
-0.02 |
0.43 |
0.27 |
n.v. |
|
AP-4 complex subunit beta-1 isoform a |
| 254588022 |
|
Ap4b1 |
|
0 |
69 |
15 |
540 |
0 |
|
n.v. |
-0.02 |
0.43 |
0.27 |
n.v. |
|
AP-4 complex subunit beta-1 isoform b |
| 17998681 |
|
Ap4s1 |
|
0 |
115 |
0 |
1105 |
236 |
|
n.v. |
0.09 |
n.v. |
0.14 |
0.63 |
|
AP-4 complex subunit sigma-1 |
| 75677454 |
|
Ap5b1 |
|
0 |
77 |
164 |
1490 |
0 |
|
n.v. |
-0.28 |
-0.57 |
0.34 |
n.v. |
|
AP-5 complex subunit beta-1 |
| 225543139 |
|
Ap5m1 |
|
0 |
0 |
102 |
172 |
0 |
|
n.v. |
n.v. |
-0.34 |
0.67 |
n.v. |
|
AP-5 complex subunit mu-1 |
| 31980819 |
|
Ap5s1 |
|
0 |
0 |
38 |
1547 |
0 |
|
n.v. |
n.v. |
-0.07 |
-0.01 |
n.v. |
|
AP-5 complex subunit sigma-1 |
| 82546849 |
|
Ap5z1 |
|
0 |
660 |
426 |
0 |
203 |
|
n.v. |
0.16 |
-0.23 |
n.v. |
0.37 |
|
AP-5 complex subunit zeta-1 |
| 110347471 |
|
Apaf1 |
|
0 |
0 |
0 |
450 |
4680 |
|
n.v. |
n.v. |
n.v. |
0.09 |
0.13 |
|
apoptotic protease-activating factor 1 |
| 110625864 |
|
Apcdd1 |
|
0 |
0 |
0 |
0 |
728 |
|
n.v. |
n.v. |
n.v. |
n.v. |
-0.41 |
|
protein APCDD1 precursor |
| 214010153 |
|
Apeh |
|
0 |
1403 |
759 |
21553 |
10249 |
|
n.v. |
0.01 |
-0.09 |
0.2 |
-0.03 |
|
acylamino-acid-releasing enzyme |
| 6753086 |
|
Apex1 |
|
99603 |
21040 |
30065 |
134816 |
104353 |
|
0.05 |
0.12 |
0.01 |
-0.27 |
0.01 |
|
DNA-(apurinic or apyrimidinic site) lyase |
| 189339191 |
|
Aph1a |
|
0 |
1386 |
1605 |
0 |
0 |
|
n.v. |
0.06 |
-0.01 |
n.v. |
n.v. |
|
gamma-secretase subunit APH-1A isoform 2 |
| 22203751 |
|
Aph1a |
|
0 |
1386 |
1605 |
0 |
0 |
|
n.v. |
0.06 |
-0.01 |
n.v. |
n.v. |
|
gamma-secretase subunit APH-1A isoform 1 |
| 94158994 |
|
Api5 |
|
20558 |
3069 |
7363 |
14513 |
10592 |
|
0.21 |
-0.01 |
-0.09 |
0.03 |
0.33 |
|
apoptosis inhibitor 5 |
| 258613873 |
|
Apip |
|
0 |
88 |
222 |
1408 |
9307 |
|
n.v. |
0.38 |
0.35 |
-0.32 |
0.04 |
|
methylthioribulose-1-phosphate dehydratase |
| 281427262 |
|
Aplf |
|
0 |
0 |
3 |
0 |
0 |
|
n.v. |
n.v. |
0.07 |
n.v. |
n.v. |
|
aprataxin and PNK-like factor isoform 1 |
| 31541860 |
|
Aplf |
|
0 |
0 |
3 |
0 |
0 |
|
n.v. |
n.v. |
0.07 |
n.v. |
n.v. |
|
aprataxin and PNK-like factor isoform 2 |
| 156255192 |
|
Aplp2 |
|
0 |
967 |
174 |
0 |
0 |
|
n.v. |
-0.12 |
-0.46 |
n.v. |
n.v. |
|
amyloid-like protein 2 isoform a precursor |
| 156255194 |
|
Aplp2 |
|
0 |
967 |
174 |
0 |
0 |
|
n.v. |
-0.12 |
-0.46 |
n.v. |
n.v. |
|
amyloid-like protein 2 isoform b precursor |
| 6753094 |
|
Aplp2 |
|
0 |
967 |
174 |
0 |
0 |
|
n.v. |
-0.12 |
-0.46 |
n.v. |
n.v. |
|
amyloid-like protein 2 isoform c precursor |
| 21313668 |
|
Apmap |
|
4577 |
10886 |
4084 |
0 |
0 |
|
0.28 |
-0.29 |
-0.37 |
n.v. |
n.v. |
|
adipocyte plasma membrane-associated protein |
| 21553309 |
|
Apoa1bp |
|
62240 |
9127 |
2650 |
1072 |
15036 |
|
0.03 |
-0.1 |
-0.04 |
-0.15 |
-0.12 |
|
NAD(P)H-hydrate epimerase precursor |
| 238018108 |
|
Apobec3 |
|
0 |
0 |
2779 |
0 |
0 |
|
n.v. |
n.v. |
0.09 |
n.v. |
n.v. |
|
DNA dC-_dU-editing enzyme APOBEC-3 isoform 1 |
| 85861172 |
|
Apobec3 |
|
0 |
0 |
2779 |
0 |
0 |
|
n.v. |
n.v. |
0.09 |
n.v. |
n.v. |
|
DNA dC-_dU-editing enzyme APOBEC-3 isoform 2 |
| 238776830 |
|
Apol10b |
|
0 |
0 |
0 |
106240 |
0 |
|
n.v. |
n.v. |
n.v. |
-0.3 |
n.v. |
|
apolipoprotein L 10b |
| 161484642 |
|
Apoo |
|
4741 |
3515 |
104 |
0 |
0 |
|
-0.13 |
-0.1 |
-0.57 |
n.v. |
n.v. |
|
apolipoprotein O isoform 1 |
| 313569763 |
|
Apoo |
|
4741 |
3515 |
104 |
0 |
0 |
|
-0.13 |
-0.1 |
-0.57 |
n.v. |
n.v. |
|
apolipoprotein O isoform 3 |
| 313569872 |
|
Apoo |
|
4741 |
3515 |
104 |
0 |
0 |
|
-0.13 |
-0.1 |
-0.57 |
n.v. |
n.v. |
|
apolipoprotein O isoform 2 |
| 13386062 |
|
Apool |
|
8531 |
7571 |
398 |
0 |
0 |
|
0.05 |
-0.14 |
-0.45 |
n.v. |
n.v. |
|
apolipoprotein O-like precursor |
| 311893401 |
|
App |
|
28502 |
5357 |
8784 |
262 |
2752 |
|
-0.09 |
-0.27 |
-0.36 |
-0.15 |
0.44 |
|
amyloid beta A4 protein isoform 1 precursor |
| 311893404 |
|
App |
|
28502 |
5357 |
8784 |
262 |
2752 |
|
-0.09 |
-0.27 |
-0.36 |
-0.15 |
0.44 |
|
amyloid beta A4 protein isoform 3 precursor |
| 311893406 |
|
App |
|
28502 |
5357 |
8784 |
262 |
2752 |
|
-0.09 |
-0.27 |
-0.36 |
-0.15 |
0.44 |
|
amyloid beta A4 protein isoform 5 precursor |
| 311893408 |
|
App |
|
28502 |
5357 |
8784 |
262 |
2752 |
|
-0.09 |
-0.27 |
-0.36 |
-0.15 |
0.44 |
|
amyloid beta A4 protein isoform 6 precursor |
| 47271504 |
|
App |
|
15597 |
5334 |
7192 |
262 |
2752 |
|
-0.07 |
-0.24 |
-0.21 |
-0.15 |
0.44 |
|
amyloid beta A4 protein isoform 2 precursor |
| 21699066 |
|
Appl1 |
|
0 |
177 |
0 |
0 |
3620 |
|
n.v. |
0.05 |
n.v. |
n.v. |
-0.08 |
|
DCC-interacting protein 13-alpha |
| 21644587 |
|
Appl2 |
|
0 |
0 |
56 |
0 |
0 |
|
n.v. |
n.v. |
-0.01 |
n.v. |
n.v. |
|
DCC-interacting protein 13-beta |
| 118601013 |
|
Aprt |
|
2105 |
1726 |
5252 |
2759 |
62790 |
|
0.16 |
-0.06 |
0.08 |
0.18 |
0.12 |
|
adenine phosphoribosyltransferase |
| 160415209 |
|
Aqp2 |
|
15816 |
97287 |
82660 |
2128 |
0 |
|
0.08 |
-0.07 |
0.32 |
-1.48 |
n.v. |
|
aquaporin-2 |
| 163644327 |
|
Aqr |
|
0 |
0 |
546 |
8 |
0 |
|
n.v. |
n.v. |
0.13 |
0.07 |
n.v. |
|
intron-binding protein aquarius |
| 227496776 |
|
Araf |
|
0 |
213 |
518 |
5083 |
278 |
|
n.v. |
0.11 |
-0.11 |
0.26 |
0.47 |
|
serine/threonine-protein kinase A-Raf isoform 2 |
| 27545181 |
|
Araf |
|
0 |
1342 |
1222 |
26734 |
278 |
|
n.v. |
0.13 |
-0.06 |
0.28 |
0.47 |
|
serine/threonine-protein kinase A-Raf isoform 1 |
| 148747410 |
|
Arcn1 |
|
48200 |
7429 |
21997 |
124527 |
2153 |
|
0.27 |
-0.07 |
-0.04 |
0.01 |
-0.35 |
|
coatomer subunit delta |
| 6680716 |
|
Arf1 |
|
232761 |
47481 |
102042 |
269461 |
147684 |
|
0.08 |
0.01 |
-0.03 |
-0.04 |
-0.02 |
|
ADP-ribosylation factor 1 |
| 6671571 |
|
Arf2 |
|
193440 |
37129 |
95038 |
262503 |
107920 |
|
0.08 |
0.02 |
-0.02 |
-0.04 |
-0.04 |
|
ADP-ribosylation factor 2 |
| 6680718 |
|
Arf3 |
|
232761 |
47481 |
102042 |
268904 |
94319 |
|
0.08 |
0.01 |
-0.03 |
-0.04 |
-0.05 |
|
ADP-ribosylation factor 3 |
| 6680720 |
|
Arf4 |
|
76757 |
17331 |
40061 |
114958 |
67481 |
|
0.08 |
0.02 |
0.01 |
-0.03 |
-0.03 |
|
ADP-ribosylation factor 4 |
| 6680722 |
|
Arf5 |
|
128289 |
26434 |
39586 |
111144 |
42988 |
|
0.08 |
0.03 |
-0.04 |
-0.02 |
-0.03 |
|
ADP-ribosylation factor 5 |
| 6680724 |
|
Arf6 |
|
23871 |
14859 |
14594 |
54704 |
7165 |
|
0.4 |
0.06 |
-0.02 |
-0.01 |
-0.05 |
|
ADP-ribosylation factor 6 |
| 295148126 |
|
Arfgap1 |
|
0 |
0 |
64 |
810 |
0 |
|
n.v. |
n.v. |
0.22 |
0.39 |
n.v. |
|
ADP-ribosylation factor GTPase-activating protein 1
isoform b |
| 295148131 |
|
Arfgap1 |
|
0 |
0 |
64 |
810 |
0 |
|
n.v. |
n.v. |
0.22 |
0.39 |
n.v. |
|
ADP-ribosylation factor GTPase-activating protein 1
isoform c |
| 295148135 |
|
Arfgap1 |
|
0 |
0 |
277 |
4420 |
0 |
|
n.v. |
n.v. |
0.06 |
-0.2 |
n.v. |
|
ADP-ribosylation factor GTPase-activating protein 1
isoform d |
| 31542139 |
|
Arfgap1 |
|
0 |
0 |
277 |
4420 |
0 |
|
n.v. |
n.v. |
0.06 |
-0.2 |
n.v. |
|
ADP-ribosylation factor GTPase-activating protein 1
isoform a |
| 260763915 |
|
Arfgap2 |
|
0 |
660 |
1551 |
0 |
1339 |
|
n.v. |
-0.53 |
0.4 |
n.v. |
0.11 |
|
ADP-ribosylation factor GTPase-activating protein 2
isoform 1 |
| 260763917 |
|
Arfgap2 |
|
0 |
660 |
1551 |
0 |
1339 |
|
n.v. |
-0.53 |
0.4 |
n.v. |
0.11 |
|
ADP-ribosylation factor GTPase-activating protein 2
isoform 2 |
| 30841021 |
|
Arfgap3 |
|
0 |
330 |
20 |
0 |
0 |
|
n.v. |
0.12 |
0.3 |
n.v. |
n.v. |
|
ADP-ribosylation factor GTPase-activating protein 3 |
| 156231075 |
|
Arfgef1 |
|
0 |
4561 |
7118 |
113321 |
140552 |
|
n.v. |
0.16 |
0.04 |
0.09 |
0 |
|
brefeldin A-inhibited guanine nucleotide-exchange protein
1 |
| 148229140 |
|
Arfgef2 |
|
0 |
2077 |
4652 |
61916 |
18067 |
|
n.v. |
0.1 |
0.12 |
0.12 |
0.06 |
|
brefeldin A-inhibited guanine nucleotide-exchange protein
2 |
| 124487362 |
|
Arfip1 |
|
4979 |
19877 |
28716 |
101362 |
56771 |
|
0.75 |
0.05 |
-0.02 |
-0.05 |
-0.06 |
|
arfaptin-1 |
| 228008331 |
|
Arfip2 |
|
0 |
0 |
650 |
6630 |
750 |
|
n.v. |
n.v. |
0.08 |
-0.27 |
-1.24 |
|
arfaptin-2 |
| 260763870 |
|
Arfrp1 |
|
238 |
1593 |
143 |
0 |
0 |
|
0.29 |
-0.2 |
-0.33 |
n.v. |
n.v. |
|
ADP-ribosylation factor-related protein 1 isoform 1 |
| 260763882 |
|
Arfrp1 |
|
238 |
1593 |
143 |
0 |
0 |
|
0.29 |
-0.2 |
-0.33 |
n.v. |
n.v. |
|
ADP-ribosylation factor-related protein 1 isoform 2 |
| 7106255 |
|
Arg1 |
|
0 |
0 |
1241 |
0 |
0 |
|
n.v. |
n.v. |
0 |
n.v. |
n.v. |
|
arginase-1 |
| 6753110 |
|
Arg2 |
|
118239 |
9634 |
762 |
0 |
9392 |
|
0.07 |
-0.04 |
-0.34 |
n.v. |
-0.2 |
|
arginase-2, mitochondrial precursor |
| 134152669 |
|
Arglu1 |
|
0 |
1121 |
1049 |
0 |
0 |
|
n.v. |
-0.05 |
-0.04 |
n.v. |
n.v. |
|
arginine and glutamate-rich protein 1 |
| 225543420 |
|
Arhgap1 |
|
2142 |
11966 |
25023 |
65959 |
25424 |
|
0.04 |
0.14 |
0.01 |
0.05 |
0.13 |
|
rho GTPase-activating protein 1 isoform 2 |
| 225543424 |
|
Arhgap1 |
|
2142 |
11966 |
25023 |
65959 |
25424 |
|
0.04 |
0.14 |
0.01 |
0.05 |
0.13 |
|
rho GTPase-activating protein 1 isoform 1 |
| 116174786 |
|
Arhgap10 |
|
0 |
651 |
1017 |
0 |
0 |
|
n.v. |
-0.52 |
-0.03 |
n.v. |
n.v. |
|
rho GTPase-activating protein 10 |
| 169790939 |
|
Arhgap17 |
|
0 |
0 |
9 |
0 |
0 |
|
n.v. |
n.v. |
-0.02 |
n.v. |
n.v. |
|
rho GTPase-activating protein 17 isoform a |
| 169790941 |
|
Arhgap17 |
|
0 |
0 |
9 |
0 |
0 |
|
n.v. |
n.v. |
-0.02 |
n.v. |
n.v. |
|
rho GTPase-activating protein 17 isoform b |
| 169790943 |
|
Arhgap17 |
|
0 |
0 |
9 |
0 |
0 |
|
n.v. |
n.v. |
-0.02 |
n.v. |
n.v. |
|
rho GTPase-activating protein 17 isoform c |
| 169790945 |
|
Arhgap17 |
|
0 |
0 |
9 |
0 |
0 |
|
n.v. |
n.v. |
-0.02 |
n.v. |
n.v. |
|
rho GTPase-activating protein 17 isoform d |
| 169790947 |
|
Arhgap17 |
|
0 |
0 |
9 |
0 |
0 |
|
n.v. |
n.v. |
-0.02 |
n.v. |
n.v. |
|
rho GTPase-activating protein 17 isoform e |
| 33563313 |
|
Arhgap18 |
|
0 |
0 |
129 |
0 |
889 |
|
n.v. |
n.v. |
-0.25 |
n.v. |
0.69 |
|
rho GTPase-activating protein 18 |
| 83582811 |
|
Arhgap25 |
|
0 |
0 |
121 |
0 |
0 |
|
n.v. |
n.v. |
0.08 |
n.v. |
n.v. |
|
rho GTPase-activating protein 25 isoform a |
| 83582813 |
|
Arhgap25 |
|
0 |
0 |
121 |
0 |
0 |
|
n.v. |
n.v. |
0.08 |
n.v. |
n.v. |
|
rho GTPase-activating protein 25 isoform b |
| 83776555 |
|
Arhgap27 |
|
0 |
0 |
0 |
2464 |
0 |
|
n.v. |
n.v. |
n.v. |
-2.68 |
n.v. |
|
rho GTPase-activating protein 27 isoform 2 |
| 118130870 |
|
Arhgap27 |
|
0 |
0 |
354 |
0 |
2774 |
|
n.v. |
n.v. |
-0.32 |
n.v. |
-0.02 |
|
rho GTPase-activating protein 27 isoform 3 |
| 327412300 |
|
Arhgap27 |
|
0 |
0 |
354 |
2464 |
2774 |
|
n.v. |
n.v. |
-0.32 |
-2.68 |
-0.02 |
|
rho GTPase-activating protein 27 isoform 1 |
| 33563303 |
|
Arhgap29 |
|
0 |
0 |
345 |
0 |
3888 |
|
n.v. |
n.v. |
0.03 |
n.v. |
-0.27 |
|
rho GTPase-activating protein 29 |
| 229608953 |
|
Arhgap30 |
|
0 |
0 |
0 |
4428 |
0 |
|
n.v. |
n.v. |
n.v. |
-0.66 |
n.v. |
|
rho GTPase-activating protein 30 |
| 30142699 |
|
Arhgap33 |
|
0 |
165 |
0 |
0 |
0 |
|
n.v. |
-0.03 |
n.v. |
n.v. |
n.v. |
|
rho GTPase-activating protein 33 |
| 86262151 |
|
Arhgap5 |
|
0 |
0 |
177 |
0 |
9585 |
|
n.v. |
n.v. |
0 |
n.v. |
0.06 |
|
rho GTPase-activating protein 5 |
| 31982030 |
|
Arhgdia |
|
80894 |
22827 |
32852 |
12786 |
453505 |
|
0.13 |
0.23 |
0.05 |
0.06 |
0.17 |
|
rho GDP-dissociation inhibitor 1 |
| 33563236 |
|
Arhgdib |
|
10087 |
3098 |
6759 |
6638 |
35052 |
|
0.24 |
0.46 |
0.18 |
0.3 |
0.32 |
|
rho GDP-dissociation inhibitor 2 |
| 194306547 |
|
Arhgef1 |
|
0 |
0 |
0 |
3176 |
2613 |
|
n.v. |
n.v. |
n.v. |
-0.07 |
0.11 |
|
rho guanine nucleotide exchange factor 1 isoform a |
| 194306549 |
|
Arhgef1 |
|
0 |
0 |
0 |
3176 |
2613 |
|
n.v. |
n.v. |
n.v. |
-0.07 |
0.11 |
|
rho guanine nucleotide exchange factor 1 isoform b |
| 194306551 |
|
Arhgef1 |
|
0 |
0 |
0 |
3176 |
2613 |
|
n.v. |
n.v. |
n.v. |
-0.07 |
0.11 |
|
rho guanine nucleotide exchange factor 1 isoform c |
| 6678668 |
|
Arhgef1 |
|
0 |
0 |
0 |
3176 |
2613 |
|
n.v. |
n.v. |
n.v. |
-0.07 |
0.11 |
|
rho guanine nucleotide exchange factor 1 isoform d |
| 111378383 |
|
Arhgef10 |
|
0 |
0 |
0 |
115 |
246 |
|
n.v. |
n.v. |
n.v. |
0.28 |
-0.02 |
|
rho guanine nucleotide exchange factor 10 isoform b |
| 111378388 |
|
Arhgef10 |
|
0 |
0 |
0 |
115 |
246 |
|
n.v. |
n.v. |
n.v. |
0.28 |
-0.02 |
|
rho guanine nucleotide exchange factor 10 isoform a |
| 163310755 |
|
Arhgef10l |
|
0 |
0 |
121 |
2120 |
4830 |
|
n.v. |
n.v. |
0.45 |
-0.05 |
-0.07 |
|
rho guanine nucleotide exchange factor 10-like protein
isoform b |
| 163310757 |
|
Arhgef10l |
|
0 |
0 |
121 |
2120 |
4830 |
|
n.v. |
n.v. |
0.45 |
-0.05 |
-0.07 |
|
rho guanine nucleotide exchange factor 10-like protein
isoform c |
| 163310759 |
|
Arhgef10l |
|
0 |
0 |
121 |
2120 |
4830 |
|
n.v. |
n.v. |
0.45 |
-0.05 |
-0.07 |
|
rho guanine nucleotide exchange factor 10-like protein
isoform a |
| 51491850 |
|
Arhgef11 |
|
0 |
182 |
894 |
0 |
0 |
|
n.v. |
0.51 |
0.06 |
n.v. |
n.v. |
|
rho guanine nucleotide exchange factor 11 |
| 145046273 |
|
Arhgef12 |
|
0 |
664 |
1422 |
0 |
4284 |
|
n.v. |
0.57 |
0.17 |
n.v. |
0.18 |
|
rho guanine nucleotide exchange factor 12 |
| 163838664 |
|
Arhgef16 |
|
0 |
0 |
3263 |
0 |
3556 |
|
n.v. |
n.v. |
-0.18 |
n.v. |
-0.33 |
|
rho guanine nucleotide exchange factor 16 |
| 41056261 |
|
Arhgef18 |
|
0 |
0 |
0 |
0 |
1264 |
|
n.v. |
n.v. |
n.v. |
n.v. |
0.06 |
|
rho guanine nucleotide exchange factor 18 |
| 170650647 |
|
Arhgef2 |
|
0 |
0 |
17806 |
36655 |
0 |
|
n.v. |
n.v. |
0.08 |
0.22 |
n.v. |
|
rho guanine nucleotide exchange factor 2 isoform 1 |
| 312032458 |
|
Arhgef2 |
|
0 |
0 |
17806 |
36655 |
0 |
|
n.v. |
n.v. |
0.08 |
0.22 |
n.v. |
|
rho guanine nucleotide exchange factor 2 isoform 2 |
| 312032460 |
|
Arhgef2 |
|
0 |
0 |
17806 |
36655 |
0 |
|
n.v. |
n.v. |
0.08 |
0.22 |
n.v. |
|
rho guanine nucleotide exchange factor 2 isoform 3 |
| 312032462 |
|
Arhgef2 |
|
0 |
0 |
17806 |
36655 |
0 |
|
n.v. |
n.v. |
0.08 |
0.22 |
n.v. |
|
rho guanine nucleotide exchange factor 2 isoform 4 |
| 123702010 |
|
Arhgef28 |
|
0 |
0 |
0 |
0 |
5076 |
|
n.v. |
n.v. |
n.v. |
n.v. |
-0.24 |
|
rho guanine nucleotide exchange factor 28 |
| 160333547 |
|
Arhgef37 |
|
0 |
61 |
0 |
0 |
139 |
|
n.v. |
-0.09 |
n.v. |
n.v. |
1.16 |
|
rho guanine nucleotide exchange factor 37 |
| 56699448 |
|
Arhgef4 |
|
0 |
0 |
38 |
0 |
0 |
|
n.v. |
n.v. |
-0.2 |
n.v. |
n.v. |
|
rho guanine nucleotide exchange factor 4 |
| 110625819 |
|
Arhgef40 |
|
0 |
0 |
174 |
0 |
0 |
|
n.v. |
n.v. |
0.4 |
n.v. |
n.v. |
|
rho guanine nucleotide exchange factor 40 isoform 1 |
| 225543507 |
|
Arhgef40 |
|
0 |
0 |
174 |
0 |
0 |
|
n.v. |
n.v. |
0.4 |
n.v. |
n.v. |
|
rho guanine nucleotide exchange factor 40 isoform 2 |
| 225543509 |
|
Arhgef40 |
|
0 |
0 |
174 |
0 |
0 |
|
n.v. |
n.v. |
0.4 |
n.v. |
n.v. |
|
rho guanine nucleotide exchange factor 40 isoform 3 |
| 169234803 |
|
Arhgef5 |
|
0 |
0 |
241 |
0 |
0 |
|
n.v. |
n.v. |
0.31 |
n.v. |
n.v. |
|
rho guanine nucleotide exchange factor 5 |
| 270132620 |
|
Arhgef6 |
|
0 |
0 |
0 |
5042 |
0 |
|
n.v. |
n.v. |
n.v. |
0.08 |
n.v. |
|
rho guanine nucleotide exchange factor 6 |
| 165377085 |
|
Arhgef7 |
|
0 |
0 |
294 |
9225 |
0 |
|
n.v. |
n.v. |
-0.01 |
0.03 |
n.v. |
|
rho guanine nucleotide exchange factor 7 isoform a |
| 165377089 |
|
Arhgef7 |
|
0 |
0 |
294 |
12753 |
0 |
|
n.v. |
n.v. |
-0.01 |
0 |
n.v. |
|
rho guanine nucleotide exchange factor 7 isoform b |
| 31980859 |
|
Arhgef7 |
|
0 |
0 |
294 |
12753 |
0 |
|
n.v. |
n.v. |
-0.01 |
0 |
n.v. |
|
rho guanine nucleotide exchange factor 7 isoform c |
| 84370312 |
|
Arhgef9 |
|
0 |
0 |
38 |
0 |
0 |
|
n.v. |
n.v. |
-0.2 |
n.v. |
n.v. |
|
rho guanine nucleotide exchange factor 9 |
| 124249109 |
|
Arid1a |
|
0 |
1918 |
16897 |
16101 |
39850 |
|
n.v. |
0.17 |
0.02 |
0.13 |
0.18 |
|
AT-rich interactive domain-containing protein 1A |
| 163954953 |
|
Arih1 |
|
0 |
0 |
0 |
0 |
13483 |
|
n.v. |
n.v. |
n.v. |
n.v. |
-0.19 |
|
E3 ubiquitin-protein ligase ARIH1 |
| 6753118 |
|
Arih2 |
|
0 |
71 |
0 |
311 |
3963 |
|
n.v. |
0.12 |
n.v. |
0.58 |
0.24 |
|
E3 ubiquitin-protein ligase ARIH2 |
| 153792526 |
|
Arl1 |
|
35587 |
14416 |
2908 |
7694 |
9756 |
|
0 |
-0.13 |
-0.14 |
-0.28 |
-0.04 |
|
ADP-ribosylation factor-like protein 1 |
| 255683326 |
|
Arl13b |
|
0 |
0 |
18 |
0 |
0 |
|
n.v. |
n.v. |
0.14 |
n.v. |
n.v. |
|
ADP-ribosylation factor-like protein 13B |
| 27369856 |
|
Arl15 |
|
0 |
2394 |
3132 |
0 |
0 |
|
n.v. |
-0.01 |
-0.05 |
n.v. |
n.v. |
|
ADP-ribosylation factor-like protein 15 |
| 31980988 |
|
Arl2 |
|
751 |
3814 |
1147 |
9471 |
21205 |
|
0.65 |
0.05 |
0.06 |
0.13 |
0.03 |
|
ADP-ribosylation factor-like protein 2 |
| 18859591 |
|
Arl2bp |
|
0 |
0 |
9 |
0 |
3202 |
|
n.v. |
n.v. |
-0.16 |
n.v. |
0.07 |
|
ADP-ribosylation factor-like protein 2-binding protein
isoform 1 |
| 30348958 |
|
Arl2bp |
|
0 |
0 |
9 |
0 |
3202 |
|
n.v. |
n.v. |
-0.16 |
n.v. |
0.07 |
|
ADP-ribosylation factor-like protein 2-binding protein
isoform 2 |
| 9789881 |
|
Arl3 |
|
732 |
5225 |
3170 |
6925 |
64525 |
|
0.11 |
0.11 |
0.05 |
0.05 |
0.01 |
|
ADP-ribosylation factor-like protein 3 |
| 113462000 |
|
Arl4c |
|
0 |
0 |
10 |
0 |
0 |
|
n.v. |
n.v. |
0.27 |
n.v. |
n.v. |
|
ADP-ribosylation factor-like protein 4C |
| 33695144 |
|
Arl5a |
|
0 |
870 |
733 |
1031 |
0 |
|
n.v. |
0.05 |
-0.18 |
-0.06 |
n.v. |
|
ADP-ribosylation factor-like protein 5A |
| 27229225 |
|
Arl5b |
|
0 |
610 |
427 |
720 |
0 |
|
n.v. |
0.08 |
0.04 |
-0.06 |
n.v. |
|
ADP-ribosylation factor-like protein 5B |
| 46402217 |
|
Arl5c |
|
0 |
610 |
427 |
720 |
0 |
|
n.v. |
0.08 |
0.04 |
-0.06 |
n.v. |
|
ADP-ribosylation factor-like protein 5C |
| 188528681 |
|
Arl6 |
|
0 |
3071 |
473 |
2701 |
7111 |
|
n.v. |
0.08 |
0.14 |
0.1 |
0.13 |
|
ADP-ribosylation factor-like protein 6 |
| 45433590 |
|
Arl6ip1 |
|
14096 |
0 |
7 |
0 |
0 |
|
0.04 |
n.v. |
-0.32 |
n.v. |
n.v. |
|
ADP-ribosylation factor-like protein 6-interacting
protein 1 |
| 21362283 |
|
Arl6ip4 |
|
0 |
1173 |
898 |
3094 |
0 |
|
n.v. |
0.04 |
-0.05 |
-0.1 |
n.v. |
|
ADP-ribosylation factor-like protein 6-interacting
protein 4 |
| 14149750 |
|
Arl6ip5 |
|
3863 |
800 |
237 |
0 |
0 |
|
-0.09 |
-0.35 |
-0.44 |
n.v. |
n.v. |
|
PRA1 family protein 3 |
| 254281227 |
|
Arl6ip6 |
|
1739 |
0 |
0 |
0 |
0 |
|
-0.13 |
n.v. |
n.v. |
n.v. |
n.v. |
|
ADP-ribosylation factor-like protein 6-interacting
protein 6 |
| 23956194 |
|
Arl8a |
|
86368 |
14598 |
34713 |
37187 |
771 |
|
0.1 |
-0.01 |
-0.09 |
-0.19 |
-0.24 |
|
ADP-ribosylation factor-like protein 8A |
| 13385518 |
|
Arl8b |
|
91201 |
25246 |
34009 |
48917 |
889 |
|
0.03 |
-0.03 |
-0.11 |
-0.26 |
-0.09 |
|
ADP-ribosylation factor-like protein 8B |
| 21312676 |
|
Armc1 |
|
0 |
835 |
186 |
0 |
3898 |
|
n.v. |
-0.01 |
0.19 |
n.v. |
0.78 |
|
armadillo repeat-containing protein 1 |
| 377833866 |
|
Armc1 |
|
0 |
568 |
186 |
0 |
3898 |
|
n.v. |
0.15 |
0.19 |
n.v. |
0.78 |
|
PREDICTED: armadillo repeat-containing protein 1 |
| 13385536 |
|
Armc10 |
|
25537 |
2394 |
260 |
0 |
0 |
|
0.03 |
-0.03 |
-0.18 |
n.v. |
n.v. |
|
armadillo repeat-containing protein 10 |
| 113199755 |
|
Armc6 |
|
0 |
0 |
7 |
0 |
6565 |
|
n.v. |
n.v. |
-0.15 |
n.v. |
0.02 |
|
armadillo repeat-containing protein 6 |
| 29244300 |
|
Armc7 |
|
0 |
0 |
0 |
0 |
396 |
|
n.v. |
n.v. |
n.v. |
n.v. |
-0.46 |
|
armadillo repeat-containing protein 7 |
| 260763997 |
|
Armc8 |
|
0 |
0 |
262 |
40551 |
0 |
|
n.v. |
n.v. |
0.05 |
0.09 |
n.v. |
|
armadillo repeat-containing protein 8 isoform 1 |
| 260763999 |
|
Armc8 |
|
0 |
0 |
63 |
26218 |
0 |
|
n.v. |
n.v. |
-0.15 |
0.12 |
n.v. |
|
armadillo repeat-containing protein 8 isoform 2 |
| 83627702 |
|
Arnt |
|
0 |
0 |
133 |
0 |
0 |
|
n.v. |
n.v. |
0.01 |
n.v. |
n.v. |
|
aryl hydrocarbon receptor nuclear translocator isoform
b |
| 83627709 |
|
Arnt |
|
0 |
0 |
133 |
0 |
0 |
|
n.v. |
n.v. |
0.01 |
n.v. |
n.v. |
|
aryl hydrocarbon receptor nuclear translocator isoform
a |
| 34328095 |
|
Arnt2 |
|
0 |
0 |
133 |
0 |
0 |
|
n.v. |
n.v. |
0.01 |
n.v. |
n.v. |
|
aryl hydrocarbon receptor nuclear translocator 2 |
| 9790221 |
|
Arpc1a |
|
0 |
0 |
541 |
19997 |
343 |
|
n.v. |
n.v. |
-0.01 |
-0.06 |
0.07 |
|
actin-related protein 41673 complex subunit 1A |
| 160837788 |
|
Arpc1b |
|
21327 |
440 |
16363 |
119534 |
84809 |
|
0.2 |
0.17 |
0.06 |
0.07 |
0.01 |
|
actin-related protein 41673 complex subunit 1B |
| 112363072 |
|
Arpc2 |
|
13967 |
9809 |
17699 |
164309 |
60905 |
|
0.17 |
0.14 |
0.02 |
-0.06 |
-0.04 |
|
actin-related protein 41673 complex subunit 2 |
| 9790141 |
|
Arpc3 |
|
5913 |
5002 |
8186 |
117487 |
19813 |
|
0.21 |
0.26 |
0.02 |
-0.08 |
-0.03 |
|
actin-related protein 41673 complex subunit 3 |
| 13386054 |
|
Arpc4 |
|
67641 |
21272 |
11948 |
99978 |
68744 |
|
0.14 |
0.12 |
0.01 |
-0.08 |
-0.13 |
|
actin-related protein 41673 complex subunit 4 isoform 1 |
| 281427242 |
|
Arpc4 |
|
23084 |
20577 |
5180 |
81913 |
55133 |
|
0.19 |
0.04 |
-0.03 |
-0.06 |
-0.24 |
|
actin-related protein 41673 complex subunit 4 isoform 2 |
| 281427244 |
|
Arpc4 |
|
23084 |
20577 |
5180 |
81946 |
55133 |
|
0.19 |
0.04 |
-0.03 |
-0.07 |
-0.24 |
|
actin-related protein 41673 complex subunit 4 isoform 3 |
| 224809382 |
|
Arpc5 |
|
10050 |
8638 |
5211 |
98292 |
35341 |
|
0.29 |
0.17 |
0.02 |
0.04 |
0.04 |
|
actin-related protein 41673 complex subunit 5 |
| 21312654 |
|
Arpc5l |
|
3698 |
2232 |
2041 |
11476 |
7475 |
|
0.04 |
0.15 |
-0.04 |
-0.17 |
-0.19 |
|
actin-related protein 41673 complex subunit 5-like
protein |
| 10946986 |
|
Arpp19 |
|
0 |
0 |
0 |
0 |
4444 |
|
n.v. |
n.v. |
n.v. |
n.v. |
-0.08 |
|
cAMP-regulated phosphoprotein 19 isoform 1 |
| 217416411 |
|
Arpp19 |
|
0 |
0 |
0 |
0 |
4444 |
|
n.v. |
n.v. |
n.v. |
n.v. |
-0.08 |
|
cAMP-regulated phosphoprotein 19 isoform 2 |
| 244798004 |
|
Arrdc1 |
|
0 |
54 |
91 |
0 |
0 |
|
n.v. |
0.04 |
0.02 |
n.v. |
n.v. |
|
arrestin domain-containing protein 1 isoform a |
| 244798112 |
|
Arrdc1 |
|
0 |
54 |
91 |
0 |
0 |
|
n.v. |
0.04 |
0.02 |
n.v. |
n.v. |
|
arrestin domain-containing protein 1 isoform b |
| 67972647 |
|
Arsa |
|
0 |
2991 |
476 |
33 |
20284 |
|
n.v. |
-0.13 |
-0.39 |
0.06 |
-0.19 |
|
arylsulfatase A precursor |
| 125656171 |
|
Arsb |
|
915 |
653 |
9 |
0 |
1553 |
|
0.07 |
0.21 |
-0.36 |
n.v. |
-0.05 |
|
arylsulfatase B precursor |
| 433809355;40254129 |
|
Arvcf |
|
1721 |
0 |
0 |
0 |
0 |
|
0.06 |
n.v. |
n.v. |
n.v. |
n.v. |
|
armadillo repeat protein deleted in velo-cardio-facial
syndrome homolog isoform 1 |
| 40254129 |
|
Arvcf |
|
0 |
207 |
426 |
0 |
0 |
|
n.v. |
-0.09 |
-0.05 |
n.v. |
n.v. |
|
armadillo repeat protein deleted in velo-cardio-facial
syndrome homolog isoform 1 |
| 433809348 |
|
Arvcf |
|
1721 |
207 |
426 |
0 |
0 |
|
0.06 |
-0.09 |
-0.05 |
n.v. |
n.v. |
|
armadillo repeat protein deleted in velo-cardio-facial
syndrome homolog isoform 3 |
| 433809350 |
|
Arvcf |
|
1721 |
207 |
426 |
0 |
0 |
|
0.06 |
-0.09 |
-0.05 |
n.v. |
n.v. |
|
armadillo repeat protein deleted in velo-cardio-facial
syndrome homolog isoform 4 |
| 433809357 |
|
Arvcf |
|
1721 |
207 |
426 |
0 |
0 |
|
0.06 |
-0.09 |
-0.05 |
n.v. |
n.v. |
|
armadillo repeat protein deleted in velo-cardio-facial
syndrome homolog isoform 2 |
| 21624631 |
|
Arxes2 |
|
0 |
0 |
404 |
0 |
0 |
|
n.v. |
n.v. |
-0.23 |
n.v. |
n.v. |
|
signal peptidase complex subunit 3 |
| 9790019 |
|
Asah1 |
|
142348 |
63901 |
16199 |
41624 |
23165 |
|
0.12 |
-0.09 |
-0.25 |
-0.19 |
-0.16 |
|
acid ceramidase precursor |
| 9055168 |
|
Asah2 |
|
0 |
209 |
430 |
0 |
0 |
|
n.v. |
-0.13 |
0.08 |
n.v. |
n.v. |
|
neutral ceramidase |
| 451327597 |
|
Asap1 |
|
0 |
0 |
18 |
0 |
257 |
|
n.v. |
n.v. |
0.18 |
n.v. |
-0.19 |
|
arf-GAP with SH3 domain, ANK repeat and PH
domain-containing protein 1 isoform b |
| 451327599 |
|
Asap1 |
|
0 |
0 |
18 |
0 |
257 |
|
n.v. |
n.v. |
0.18 |
n.v. |
-0.19 |
|
arf-GAP with SH3 domain, ANK repeat and PH
domain-containing protein 1 isoform c |
| 451327601 |
|
Asap1 |
|
0 |
0 |
18 |
0 |
257 |
|
n.v. |
n.v. |
0.18 |
n.v. |
-0.19 |
|
arf-GAP with SH3 domain, ANK repeat and PH
domain-containing protein 1 isoform d |
| 451327606 |
|
Asap1 |
|
0 |
0 |
18 |
0 |
257 |
|
n.v. |
n.v. |
0.18 |
n.v. |
-0.19 |
|
arf-GAP with SH3 domain, ANK repeat and PH
domain-containing protein 1 isoform e |
| 65301464 |
|
Asap1 |
|
0 |
0 |
18 |
0 |
257 |
|
n.v. |
n.v. |
0.18 |
n.v. |
-0.19 |
|
arf-GAP with SH3 domain, ANK repeat and PH
domain-containing protein 1 |
| 147907212 |
|
Asap2 |
|
0 |
0 |
1456 |
72450 |
8171 |
|
n.v. |
n.v. |
0.13 |
-0.01 |
-0.05 |
|
arf-GAP with SH3 domain, ANK repeat and PH
domain-containing protein 2 isoform b |
| 148223355 |
|
Asap2 |
|
0 |
0 |
1456 |
72450 |
8171 |
|
n.v. |
n.v. |
0.13 |
-0.01 |
-0.05 |
|
arf-GAP with SH3 domain, ANK repeat and PH
domain-containing protein 2 isoform a |
| 206597526 |
|
Asap2 |
|
0 |
0 |
1456 |
72450 |
8171 |
|
n.v. |
n.v. |
0.13 |
-0.01 |
-0.05 |
|
arf-GAP with SH3 domain, ANK repeat and PH
domain-containing protein 2 isoform c |
| 282721040 |
|
Asb14 |
|
0 |
0 |
63 |
0 |
0 |
|
n.v. |
n.v. |
0.33 |
n.v. |
n.v. |
|
ankyrin repeat and SOCS box protein 14 isoform 2 |
| 268370092 |
|
Asb15 |
|
10398 |
0 |
0 |
0 |
0 |
|
-0.07 |
n.v. |
n.v. |
n.v. |
n.v. |
|
ankyrin repeat and SOCS box protein 15 |
| 17505202 |
|
Asb4 |
|
0 |
0 |
426 |
0 |
0 |
|
n.v. |
n.v. |
-0.04 |
n.v. |
n.v. |
|
ankyrin repeat and SOCS box protein 4 |
| 58037141 |
|
Ascc1 |
|
0 |
0 |
470 |
598 |
0 |
|
n.v. |
n.v. |
0.13 |
0.05 |
n.v. |
|
activating signal cointegrator 1 complex subunit 1 |
| 20270208 |
|
Ascc2 |
|
0 |
0 |
227 |
262 |
0 |
|
n.v. |
n.v. |
0.06 |
1.05 |
n.v. |
|
activating signal cointegrator 1 complex subunit 2 |
| 225703058 |
|
Ascc3 |
|
0 |
0 |
2158 |
7670 |
0 |
|
n.v. |
n.v. |
0.04 |
0.2 |
n.v. |
|
activating signal cointegrator 1 complex subunit 3 |
| 13384964 |
|
Asf1a |
|
0 |
0 |
407 |
1735 |
610 |
|
n.v. |
n.v. |
-0.06 |
-0.15 |
0.18 |
|
histone chaperone ASF1A |
| 21313226 |
|
Asf1b |
|
0 |
0 |
145 |
745 |
1446 |
|
n.v. |
n.v. |
0.27 |
0.31 |
0.09 |
|
histone chaperone ASF1B |
| 124248550 |
|
Ash2l |
|
0 |
6 |
6 |
876 |
6019 |
|
n.v. |
0.52 |
-0.04 |
-0.24 |
0.04 |
|
set1/Ash2 histone methyltransferase complex subunit ASH2
isoform b |
| 124248552 |
|
Ash2l |
|
0 |
6 |
6 |
876 |
6019 |
|
n.v. |
0.52 |
-0.04 |
-0.24 |
0.04 |
|
set1/Ash2 histone methyltransferase complex subunit ASH2
isoform a |
| 19526986 |
|
Asl |
|
0 |
3350 |
3938 |
59886 |
111539 |
|
n.v. |
0.22 |
0.07 |
0.16 |
0.05 |
|
argininosuccinate lyase |
| 12025542 |
|
Asna1 |
|
2636 |
4895 |
8818 |
35182 |
86522 |
|
0.12 |
-0.05 |
-0.06 |
0.14 |
0.16 |
|
ATPase Asna1 |
| 33469123 |
|
Asns |
|
0 |
154 |
76 |
0 |
2003 |
|
n.v. |
0.62 |
0.01 |
n.v. |
0.25 |
|
asparagine synthetase [glutamine-hydrolyzing] |
| 125628654 |
|
Asph |
|
0 |
772 |
0 |
0 |
0 |
|
n.v. |
-0.19 |
n.v. |
n.v. |
n.v. |
|
aspartyl/asparaginyl beta-hydroxylase isoform 2 |
| 295390570 |
|
Asph |
|
0 |
772 |
0 |
0 |
0 |
|
n.v. |
-0.19 |
n.v. |
n.v. |
n.v. |
|
aspartyl/asparaginyl beta-hydroxylase isoform 6 |
| 295390587 |
|
Asph |
|
0 |
772 |
0 |
0 |
0 |
|
n.v. |
-0.19 |
n.v. |
n.v. |
n.v. |
|
aspartyl/asparaginyl beta-hydroxylase isoform 7 |
| 295390598 |
|
Asph |
|
0 |
772 |
0 |
0 |
0 |
|
n.v. |
-0.19 |
n.v. |
n.v. |
n.v. |
|
aspartyl/asparaginyl beta-hydroxylase isoform 9 |
| 125628659 |
|
Asph |
|
22150 |
1221 |
3611 |
0 |
0 |
|
0.01 |
-0.2 |
-0.31 |
n.v. |
n.v. |
|
aspartyl/asparaginyl beta-hydroxylase isoform 1 |
| 295390525 |
|
Asph |
|
22150 |
1221 |
3611 |
0 |
0 |
|
0.01 |
-0.2 |
-0.31 |
n.v. |
n.v. |
|
aspartyl/asparaginyl beta-hydroxylase isoform 3 |
| 295390538 |
|
Asph |
|
641 |
779 |
3 |
0 |
0 |
|
0.11 |
-0.26 |
-0.55 |
n.v. |
n.v. |
|
aspartyl/asparaginyl beta-hydroxylase isoform 4 |
| 295390552 |
|
Asph |
|
641 |
779 |
3 |
0 |
0 |
|
0.11 |
-0.26 |
-0.55 |
n.v. |
n.v. |
|
aspartyl/asparaginyl beta-hydroxylase isoform 5 |
| 295390613 |
|
Asph |
|
641 |
779 |
3 |
0 |
0 |
|
0.11 |
-0.26 |
-0.55 |
n.v. |
n.v. |
|
aspartyl/asparaginyl beta-hydroxylase isoform 8 |
| 295390633 |
|
Asph |
|
641 |
779 |
3 |
0 |
0 |
|
0.11 |
-0.26 |
-0.55 |
n.v. |
n.v. |
|
aspartyl/asparaginyl beta-hydroxylase isoform 10 |
| 87298845 |
|
Aspm |
|
0 |
0 |
9 |
0 |
0 |
|
n.v. |
n.v. |
-0.68 |
n.v. |
n.v. |
|
abnormal spindle-like microcephaly-associated protein
homolog |
| 255982537 |
|
Aspscr1 |
|
0 |
0 |
0 |
5771 |
0 |
|
n.v. |
n.v. |
n.v. |
0.09 |
n.v. |
|
tether containing UBX domain for GLUT4 isoform 3 |
| 38016200 |
|
Aspscr1 |
|
0 |
0 |
0 |
5771 |
0 |
|
n.v. |
n.v. |
n.v. |
0.09 |
n.v. |
|
tether containing UBX domain for GLUT4 isoform 2 |
| 30794438 |
|
Aspscr1 |
|
0 |
21 |
0 |
10347 |
760 |
|
n.v. |
-2.37 |
n.v. |
0.04 |
-0.86 |
|
tether containing UBX domain for GLUT4 isoform 1 |
| 6996911 |
|
Ass1 |
|
0 |
2497 |
4605 |
17247 |
37858 |
|
n.v. |
-0.12 |
0.01 |
-0.05 |
-0.06 |
|
argininosuccinate synthase |
| 31560168 |
|
Atad1 |
|
0 |
4647 |
1029 |
0 |
0 |
|
n.v. |
-0.13 |
-0.1 |
n.v. |
n.v. |
|
ATPase family AAA domain-containing protein 1 |
| 91199557 |
|
Atad2 |
|
421 |
0 |
0 |
0 |
0 |
|
0.63 |
n.v. |
n.v. |
n.v. |
n.v. |
|
ATPase family AAA domain-containing protein 2 |
| 239985513 |
|
Atad3a |
|
4247 |
3325 |
241 |
0 |
0 |
|
-0.05 |
-0.25 |
-0.49 |
n.v. |
n.v. |
|
ATPase family AAA domain-containing protein 3 |
| 209862913 |
|
Ate1 |
|
0 |
0 |
0 |
0 |
760 |
|
n.v. |
n.v. |
n.v. |
n.v. |
0.05 |
|
arginyl-tRNA--protein transferase 1 isoform 4 |
| 31542151 |
|
Ate1 |
|
0 |
0 |
0 |
0 |
760 |
|
n.v. |
n.v. |
n.v. |
n.v. |
0.05 |
|
arginyl-tRNA--protein transferase 1 isoform 1 |
| 405113032 |
|
Ate1 |
|
0 |
0 |
0 |
0 |
760 |
|
n.v. |
n.v. |
n.v. |
n.v. |
0.05 |
|
arginyl-tRNA--protein transferase 1 isoform 2 |
| 71274127 |
|
Ate1 |
|
0 |
0 |
0 |
0 |
760 |
|
n.v. |
n.v. |
n.v. |
n.v. |
0.05 |
|
arginyl-tRNA--protein transferase 1 isoform 3 |
| 124486811 |
|
Atf6 |
|
0 |
0 |
0 |
0 |
2677 |
|
n.v. |
n.v. |
n.v. |
n.v. |
0.09 |
|
cyclic AMP-dependent transcription factor ATF-6 alpha |
| 34328232 |
|
Atf7ip |
|
0 |
0 |
0 |
0 |
2506 |
|
n.v. |
n.v. |
n.v. |
n.v. |
0.22 |
|
activating transcription factor 7-interacting protein 1 |
| 27777650 |
|
Atg16l1 |
|
0 |
0 |
42 |
0 |
1039 |
|
n.v. |
n.v. |
-0.19 |
n.v. |
-0.4 |
|
autophagy-related protein 16-1 isoform 2 |
| 329663747 |
|
Atg16l1 |
|
0 |
0 |
42 |
0 |
1039 |
|
n.v. |
n.v. |
-0.19 |
n.v. |
-0.4 |
|
autophagy-related protein 16-1 isoform 1 |
| 329663755 |
|
Atg16l1 |
|
0 |
0 |
42 |
0 |
1039 |
|
n.v. |
n.v. |
-0.19 |
n.v. |
-0.4 |
|
autophagy-related protein 16-1 isoform 3 |
| 118197274 |
|
Atg2b |
|
0 |
0 |
0 |
0 |
2367 |
|
n.v. |
n.v. |
n.v. |
n.v. |
-0.07 |
|
autophagy-related protein 2 homolog B |
| 13385890 |
|
Atg3 |
|
0 |
0 |
130 |
0 |
32364 |
|
n.v. |
n.v. |
0.25 |
n.v. |
0.01 |
|
ubiquitin-like-conjugating enzyme ATG3 |
| 27883848 |
|
Atg4b |
|
0 |
0 |
0 |
0 |
5408 |
|
n.v. |
n.v. |
n.v. |
n.v. |
0.28 |
|
cysteine protease ATG4B |
| 16716341 |
|
Atg5 |
|
0 |
0 |
1349 |
1162 |
14736 |
|
n.v. |
n.v. |
-0.13 |
0.01 |
0.06 |
|
autophagy protein 5 |
| 22550098 |
|
Atg7 |
|
0 |
248 |
0 |
0 |
0 |
|
n.v. |
-0.25 |
n.v. |
n.v. |
n.v. |
|
ubiquitin-like modifier-activating enzyme ATG7 |
| 22550098;358679371 |
|
Atg7 |
|
0 |
0 |
738 |
2873 |
9232 |
|
n.v. |
n.v. |
-0.09 |
-0.32 |
0.09 |
|
ubiquitin-like modifier-activating enzyme ATG7 |
| 358679369 |
|
Atg7 |
|
0 |
248 |
738 |
2873 |
9232 |
|
n.v. |
-0.25 |
-0.09 |
-0.32 |
0.09 |
|
ubiquitin-like modifier-activating enzyme ATG7 isoform 1 |
| 227908823 |
|
Atic |
|
0 |
6148 |
24786 |
55514 |
65671 |
|
n.v. |
0.21 |
0 |
0.29 |
0.04 |
|
bifunctional purine biosynthesis protein PURH |
| 30519971 |
|
Atl1 |
|
0 |
382 |
0 |
0 |
0 |
|
n.v. |
-0.12 |
n.v. |
n.v. |
n.v. |
|
atlastin-1 |
| 557786119 |
|
Atl2 |
|
879 |
0 |
0 |
0 |
0 |
|
0.01 |
n.v. |
n.v. |
n.v. |
n.v. |
|
atlastin-2 isoform 3 |
| 119372300 |
|
Atl2 |
|
879 |
171 |
184 |
0 |
0 |
|
0.01 |
-0.58 |
-0.36 |
n.v. |
n.v. |
|
atlastin-2 isoform 1 |
| 119372304 |
|
Atl2 |
|
879 |
171 |
184 |
0 |
0 |
|
0.01 |
-0.58 |
-0.36 |
n.v. |
n.v. |
|
atlastin-2 isoform 2 |
| 254826716 |
|
Atl3 |
|
50543 |
7569 |
7917 |
6450 |
0 |
|
0.2 |
-0.31 |
-0.42 |
-0.33 |
n.v. |
|
atlastin-3 isoform 1 |
| 254826718 |
|
Atl3 |
|
50543 |
7569 |
8256 |
6450 |
0 |
|
0.2 |
-0.31 |
-0.42 |
-0.33 |
n.v. |
|
atlastin-3 isoform 2 |
| 163838660 |
|
Atm |
|
0 |
0 |
60 |
98 |
0 |
|
n.v. |
n.v. |
0.07 |
-1.57 |
n.v. |
|
serine-protein kinase ATM |
| 239049657 |
|
Atmin |
|
0 |
0 |
0 |
0 |
2335 |
|
n.v. |
n.v. |
n.v. |
n.v. |
-0.58 |
|
ATM interactor |
| 6753136 |
|
Atox1 |
|
494 |
15 |
945 |
0 |
0 |
|
0.22 |
0.31 |
0.11 |
n.v. |
n.v. |
|
copper transport protein ATOX1 |
| 7656914 |
|
Atp11a |
|
0 |
0 |
3911 |
0 |
0 |
|
n.v. |
n.v. |
-0.03 |
n.v. |
n.v. |
|
probable phospholipid-transporting ATPase IH |
| 62632754 |
|
Atp11b |
|
0 |
0 |
1062 |
0 |
0 |
|
n.v. |
n.v. |
-0.14 |
n.v. |
n.v. |
|
ATPase, class VI, type 11B |
| 157168326 |
|
Atp12a |
|
22773 |
62062 |
84223 |
8497 |
0 |
|
-0.14 |
0.08 |
0 |
0.15 |
n.v. |
|
potassium-transporting ATPase alpha chain 2 |
| 283135194 |
|
Atp13a1 |
|
2618 |
833 |
4443 |
0 |
11963 |
|
0.13 |
0.05 |
-0.31 |
n.v. |
0.06 |
|
probable cation-transporting ATPase 13A1 |
| 189339252 |
|
Atp13a3 |
|
0 |
0 |
151 |
0 |
0 |
|
n.v. |
n.v. |
-0.28 |
n.v. |
n.v. |
|
probable cation-transporting ATPase 13A3 isoform 2 |
| 189339254 |
|
Atp13a3 |
|
0 |
0 |
151 |
0 |
0 |
|
n.v. |
n.v. |
-0.28 |
n.v. |
n.v. |
|
probable cation-transporting ATPase 13A3 isoform 1 |
| 21450277 |
|
Atp1a1 |
|
1620174 |
316642 |
737010 |
104775 |
0 |
|
-0.02 |
0.09 |
0.01 |
-0.12 |
n.v. |
|
sodium/potassium-transporting ATPase subunit alpha-1
precursor |
| 30409956 |
|
Atp1a2 |
|
547295 |
117402 |
284077 |
35730 |
0 |
|
-0.06 |
0.07 |
0 |
-0.07 |
n.v. |
|
sodium/potassium-transporting ATPase subunit alpha-2
precursor |
| 21450321 |
|
Atp1a3 |
|
536311 |
117358 |
275596 |
35730 |
0 |
|
-0.07 |
0.07 |
0.01 |
-0.07 |
n.v. |
|
sodium/potassium-transporting ATPase subunit alpha-3 |
| 226958351 |
|
Atp1a4 |
|
70972 |
85237 |
152719 |
10829 |
0 |
|
-0.04 |
0.15 |
0 |
0.18 |
n.v. |
|
sodium/potassium-transporting ATPase subunit alpha-4 |
| 6753138 |
|
Atp1b1 |
|
245923 |
97994 |
176656 |
31916 |
0 |
|
0.03 |
0.05 |
0.04 |
-0.25 |
n.v. |
|
sodium/potassium-transporting ATPase subunit beta-1 |
| 6680744 |
|
Atp1b3 |
|
3130 |
6561 |
8341 |
0 |
0 |
|
0.29 |
-0.07 |
-0.15 |
n.v. |
n.v. |
|
sodium/potassium-transporting ATPase subunit beta-3 |
| 36031132 |
|
Atp2a1 |
|
30553 |
4327 |
14225 |
0 |
0 |
|
0.04 |
-0.55 |
-0.34 |
n.v. |
n.v. |
|
sarcoplasmic/endoplasmic reticulum calcium ATPase 1 |
| 158635979 |
|
Atp2a2 |
|
131089 |
14256 |
38234 |
0 |
0 |
|
-0.04 |
-0.37 |
-0.34 |
n.v. |
n.v. |
|
sarcoplasmic/endoplasmic reticulum calcium ATPase 2
isoform a |
| 6806903 |
|
Atp2a2 |
|
131089 |
14256 |
38140 |
0 |
0 |
|
-0.04 |
-0.37 |
-0.34 |
n.v. |
n.v. |
|
sarcoplasmic/endoplasmic reticulum calcium ATPase 2
isoform b |
| 254039658 |
|
Atp2a3 |
|
80766 |
4889 |
12664 |
0 |
0 |
|
0.03 |
-0.41 |
-0.43 |
n.v. |
n.v. |
|
sarcoplasmic/endoplasmic reticulum calcium ATPase 3
isoform a |
| 254039660 |
|
Atp2a3 |
|
80766 |
4889 |
12664 |
0 |
0 |
|
0.03 |
-0.41 |
-0.43 |
n.v. |
n.v. |
|
sarcoplasmic/endoplasmic reticulum calcium ATPase 3
isoform c |
| 31542159 |
|
Atp2a3 |
|
80766 |
4889 |
12664 |
0 |
0 |
|
0.03 |
-0.41 |
-0.43 |
n.v. |
n.v. |
|
sarcoplasmic/endoplasmic reticulum calcium ATPase 3
isoform b |
| 62234487 |
|
Atp2b1 |
|
2966 |
6521 |
25094 |
1179 |
0 |
|
-0.13 |
0.05 |
-0.06 |
0.26 |
n.v. |
|
plasma membrane calcium ATPase 1 |
| 6753140 |
|
Atp2b2 |
|
1812 |
0 |
0 |
0 |
0 |
|
-0.08 |
n.v. |
n.v. |
n.v. |
n.v. |
|
plasma membrane calcium-transporting ATPase 2 |
| 80861454 |
|
Atp2b2 |
|
0 |
2079 |
11677 |
1179 |
0 |
|
n.v. |
0.09 |
0 |
0.26 |
n.v. |
|
plasma membrane calcium-transporting ATPase 2 |
| 56699478 |
|
Atp2b3 |
|
1812 |
1812 |
10283 |
1179 |
0 |
|
-0.08 |
0.04 |
0 |
0.26 |
n.v. |
|
plasma membrane calcium ATPase 3 |
| 269784615 |
|
Atp2b4 |
|
0 |
1760 |
4718 |
1179 |
0 |
|
n.v. |
0.02 |
-0.06 |
0.26 |
n.v. |
|
plasma membrane calcium ATPase 4 isoform a |
| 54261793 |
|
Atp2b4 |
|
0 |
1760 |
4718 |
1179 |
0 |
|
n.v. |
0.02 |
-0.06 |
0.26 |
n.v. |
|
plasma membrane calcium ATPase 4 isoform b |
| 225690606 |
|
Atp2c1 |
|
0 |
850 |
458 |
0 |
0 |
|
n.v. |
-0.49 |
0.24 |
n.v. |
n.v. |
|
calcium-transporting ATPase type 2C member 1 isoform 2 |
| 359465596 |
|
Atp2c1 |
|
0 |
850 |
458 |
0 |
0 |
|
n.v. |
-0.49 |
0.24 |
n.v. |
n.v. |
|
calcium-transporting ATPase type 2C member 1 isoform 1 |
| 359465610 |
|
Atp2c1 |
|
0 |
850 |
458 |
0 |
0 |
|
n.v. |
-0.49 |
0.24 |
n.v. |
n.v. |
|
calcium-transporting ATPase type 2C member 1 isoform 3 |
| 110225337 |
|
Atp4a |
|
167171 |
28492 |
78378 |
19285 |
0 |
|
-0.07 |
0.06 |
-0.01 |
-0.07 |
n.v. |
|
potassium-transporting ATPase alpha chain 1 |
| 6680748 |
|
Atp5a1 |
|
3406255 |
201777 |
98612 |
26448 |
12712 |
|
-0.04 |
-0.13 |
-0.34 |
-0.28 |
-0.36 |
|
ATP synthase subunit alpha, mitochondrial precursor |
| 31980648 |
|
Atp5b |
|
3029224 |
467904 |
118280 |
33135 |
12744 |
|
-0.04 |
-0.12 |
-0.29 |
-0.23 |
-0.15 |
|
ATP synthase subunit beta, mitochondrial precursor |
| 163838641 |
|
Atp5c1 |
|
276457 |
47426 |
11860 |
1244 |
0 |
|
-0.12 |
-0.12 |
-0.38 |
-0.36 |
n.v. |
|
ATP synthase subunit gamma, mitochondrial isoform a |
| 163838648 |
|
Atp5c1 |
|
276457 |
47426 |
11860 |
1244 |
0 |
|
-0.12 |
-0.12 |
-0.38 |
-0.36 |
n.v. |
|
ATP synthase subunit gamma, mitochondrial isoform b |
| 166851828 |
|
Atp5d |
|
149615 |
5254 |
8938 |
0 |
1360 |
|
0 |
0.06 |
-0.29 |
n.v. |
-0.12 |
|
ATP synthase subunit delta, mitochondrial precursor |
| 13385484 |
|
Atp5e |
|
45216 |
21 |
0 |
0 |
0 |
|
-0.07 |
-0.2 |
n.v. |
n.v. |
n.v. |
|
ATP synthase subunit epsilon, mitochondrial |
| 78214312 |
|
Atp5f1 |
|
49316 |
37053 |
7093 |
2611 |
0 |
|
0.05 |
-0.08 |
-0.3 |
-0.17 |
n.v. |
|
ATP synthase subunit b, mitochondrial precursor |
| 21313679 |
|
Atp5h |
|
147675 |
14178 |
5909 |
0 |
0 |
|
0.09 |
-0.09 |
-0.25 |
n.v. |
n.v. |
|
ATP synthase subunit d, mitochondrial |
| 7949005 |
|
Atp5j |
|
366 |
7110 |
669 |
0 |
0 |
|
-0.2 |
-0.06 |
-0.3 |
n.v. |
n.v. |
|
ATP synthase-coupling factor 6, mitochondrial precursor |
| 10181184 |
|
Atp5j2 |
|
65828 |
5824 |
2248 |
0 |
0 |
|
-0.06 |
-0.16 |
-0.31 |
n.v. |
n.v. |
|
ATP synthase subunit f, mitochondrial |
| 83715998 |
|
Atp5k |
|
92720 |
19489 |
5340 |
1744 |
0 |
|
-0.15 |
-0.23 |
-0.44 |
-0.4 |
n.v. |
|
ATP synthase subunit e, mitochondrial |
| 31980744 |
|
Atp5l |
|
11258 |
13354 |
1433 |
0 |
0 |
|
0.04 |
0.02 |
-0.27 |
n.v. |
n.v. |
|
ATP synthase subunit g, mitochondrial |
| 20070412;149251053 |
|
Atp5o |
|
0 |
59006 |
0 |
3512 |
0 |
|
n.v. |
-0.14 |
n.v. |
-0.45 |
n.v. |
|
ATP synthase subunit O, mitochondrial precursor |
| 13386040 |
|
Atp5s |
|
0 |
514 |
0 |
0 |
0 |
|
n.v. |
-0.08 |
n.v. |
n.v. |
n.v. |
|
ATP synthase subunit s, mitochondrial precursor |
| 21361250 |
|
Atp6ap2 |
|
146 |
564 |
429 |
49 |
0 |
|
0.27 |
0.13 |
0.14 |
0.31 |
n.v. |
|
renin receptor precursor |
| 12025532 |
|
Atp6v0a1 |
|
0 |
908 |
6541 |
188 |
0 |
|
n.v. |
0.11 |
0.08 |
-0.24 |
n.v. |
|
V-type proton ATPase 116 kDa subunit a isoform 1 isoform
1 |
| 340007375 |
|
Atp6v0a1 |
|
0 |
908 |
6541 |
188 |
0 |
|
n.v. |
0.11 |
0.08 |
-0.24 |
n.v. |
|
V-type proton ATPase 116 kDa subunit a isoform 1 isoform
2 |
| 340007377 |
|
Atp6v0a1 |
|
0 |
908 |
6541 |
188 |
0 |
|
n.v. |
0.11 |
0.08 |
-0.24 |
n.v. |
|
V-type proton ATPase 116 kDa subunit a isoform 1 isoform
3 |
| 340007379 |
|
Atp6v0a1 |
|
0 |
908 |
6541 |
188 |
0 |
|
n.v. |
0.11 |
0.08 |
-0.24 |
n.v. |
|
V-type proton ATPase 116 kDa subunit a isoform 1 isoform
4 |
| 83627707 |
|
Atp6v0a2 |
|
0 |
4956 |
846 |
0 |
0 |
|
n.v. |
-0.36 |
-0.1 |
n.v. |
n.v. |
|
V-type proton ATPase 116 kDa subunit a isoform 2 |
| 171543866 |
|
Atp6v0a4 |
|
0 |
0 |
710 |
0 |
0 |
|
n.v. |
n.v. |
0.07 |
n.v. |
n.v. |
|
V-type proton ATPase 116 kDa subunit a isoform 4 |
| 6753144 |
|
Atp6v0c |
|
1776 |
7851 |
7147 |
10437 |
0 |
|
0.13 |
-0.01 |
-0.12 |
-0.14 |
n.v. |
|
V-type proton ATPase 16 kDa proteolipid subunit |
| 31981304 |
|
Atp6v0d1 |
|
15798 |
23981 |
26258 |
5812 |
2228 |
|
0.37 |
0.01 |
-0.02 |
-0.11 |
0.25 |
|
V-type proton ATPase subunit d 1 |
| 31560731 |
|
Atp6v1a |
|
4448 |
27983 |
39094 |
199294 |
69537 |
|
0.09 |
-0.02 |
-0.11 |
0.19 |
0.06 |
|
V-type proton ATPase catalytic subunit A |
| 19527064 |
|
Atp6v1b1 |
|
15286 |
12581 |
18341 |
13211 |
55839 |
|
-0.02 |
-0.02 |
-0.12 |
0.17 |
0.02 |
|
V-type proton ATPase subunit B, kidney isoform |
| 19705578 |
|
Atp6v1b2 |
|
15286 |
32498 |
40167 |
55474 |
73874 |
|
-0.02 |
0.03 |
-0.12 |
0.21 |
0.06 |
|
V-type proton ATPase subunit B, brain isoform |
| 189339262 |
|
Atp6v1c1 |
|
0 |
63 |
13269 |
19785 |
53044 |
|
n.v. |
0.04 |
-0.09 |
0.13 |
0.17 |
|
V-type proton ATPase subunit C 1 |
| 19526870 |
|
Atp6v1c2 |
|
0 |
0 |
1030 |
0 |
0 |
|
n.v. |
n.v. |
-0.06 |
n.v. |
n.v. |
|
V-type proton ATPase subunit C 2 isoform 2 |
| 227499977 |
|
Atp6v1c2 |
|
0 |
0 |
1030 |
0 |
0 |
|
n.v. |
n.v. |
-0.06 |
n.v. |
n.v. |
|
V-type proton ATPase subunit C 2 isoform 1 |
| 12963799 |
|
Atp6v1d |
|
146 |
1428 |
2931 |
18475 |
6319 |
|
0.51 |
0.07 |
-0.25 |
0.2 |
0.09 |
|
V-type proton ATPase subunit D |
| 45504359 |
|
Atp6v1e1 |
|
11075 |
4979 |
5565 |
27094 |
20305 |
|
0.11 |
0.06 |
-0.13 |
0.18 |
0.12 |
|
V-type proton ATPase subunit E 1 |
| 254911018 |
|
Atp6v1e2 |
|
0 |
219 |
688 |
3004 |
2388 |
|
n.v. |
0.13 |
-0.09 |
0.48 |
-0.2 |
|
V-type proton ATPase subunit E 2 |
| 21314824 |
|
Atp6v1f |
|
0 |
735 |
689 |
696 |
2656 |
|
n.v. |
-0.08 |
-0.11 |
-0.06 |
-0.22 |
|
V-type proton ATPase subunit F |
| 15617197 |
|
Atp6v1g1 |
|
1867 |
1067 |
4089 |
2595 |
5280 |
|
-0.04 |
-0.05 |
-0.13 |
0.05 |
0.21 |
|
V-type proton ATPase subunit G 1 |
| 31981588 |
|
Atp6v1h |
|
2123 |
7551 |
3951 |
15356 |
5751 |
|
0.19 |
0 |
-0.06 |
0.29 |
0.34 |
|
V-type proton ATPase subunit H |
| 157951680 |
|
Atp7a |
|
0 |
19 |
319 |
0 |
0 |
|
n.v. |
-0.86 |
-0.03 |
n.v. |
n.v. |
|
copper-transporting ATPase 1 isoform 2 |
| 157951682 |
|
Atp7a |
|
0 |
19 |
319 |
0 |
0 |
|
n.v. |
-0.86 |
-0.03 |
n.v. |
n.v. |
|
copper-transporting ATPase 1 isoform 1 |
| 167716841 |
|
ATP8 |
|
11130 |
1580 |
596 |
205 |
0 |
|
-0.07 |
-0.02 |
-0.41 |
-0.42 |
n.v. |
|
ATP synthase F0 subunit 8musculus |
| 34538602 |
|
ATP8 |
|
11130 |
1580 |
596 |
205 |
0 |
|
-0.07 |
-0.02 |
-0.41 |
-0.42 |
n.v. |
|
ATP synthase F0 subunit 8 |
| 7656912 |
|
Atp8a2 |
|
604 |
0 |
0 |
0 |
0 |
|
-0.08 |
n.v. |
n.v. |
n.v. |
n.v. |
|
probable phospholipid-transporting ATPase IB |
| 80861460 |
|
Atp8b1 |
|
0 |
0 |
19 |
0 |
0 |
|
n.v. |
n.v. |
0.51 |
n.v. |
n.v. |
|
probable phospholipid-transporting ATPase IC |
| 46358405 |
|
Atp8b3 |
|
0 |
0 |
19 |
0 |
0 |
|
n.v. |
n.v. |
0.51 |
n.v. |
n.v. |
|
probable phospholipid-transporting ATPase IK |
| 157671921 |
|
Atp8b4 |
|
0 |
0 |
19 |
0 |
0 |
|
n.v. |
n.v. |
0.51 |
n.v. |
n.v. |
|
ATPase, class I, type 8B, member 4 |
| 40795674 |
|
Atp9a |
|
0 |
0 |
1112 |
0 |
0 |
|
n.v. |
n.v. |
0 |
n.v. |
n.v. |
|
probable phospholipid-transporting ATPase IIA |
| 320089590 |
|
Atp9b |
|
0 |
0 |
222 |
0 |
0 |
|
n.v. |
n.v. |
0.08 |
n.v. |
n.v. |
|
probable phospholipid-transporting ATPase IIB isoform 1 |
| 40807502 |
|
Atp9b |
|
0 |
0 |
222 |
0 |
0 |
|
n.v. |
n.v. |
0.08 |
n.v. |
n.v. |
|
probable phospholipid-transporting ATPase IIB isoform 2 |
| 344925843 |
|
Atpaf1 |
|
0 |
593 |
0 |
0 |
0 |
|
n.v. |
-0.15 |
n.v. |
n.v. |
n.v. |
|
ATP synthase mitochondrial F1 complex assembly factor 1 |
| 238776839 |
|
Atpaf2 |
|
1153 |
2603 |
0 |
0 |
0 |
|
0.17 |
-0.09 |
n.v. |
n.v. |
n.v. |
|
ATP synthase mitochondrial F1 complex assembly factor 2 |
| 31982864 |
|
Atpif1 |
|
0 |
198 |
66 |
0 |
0 |
|
n.v. |
0.12 |
-0.15 |
n.v. |
n.v. |
|
ATPase inhibitor, mitochondrial precursor |
| 189339266 |
|
Atr |
|
0 |
0 |
1 |
0 |
0 |
|
n.v. |
n.v. |
0.98 |
n.v. |
n.v. |
|
serine/threonine-protein kinase ATR |
| 47087146 |
|
Atraid |
|
0 |
0 |
37 |
0 |
0 |
|
n.v. |
n.v. |
-0.31 |
n.v. |
n.v. |
|
all-trans retinoic acid-induced differentiation factor
isoform 1 precursor |
| 83649709 |
|
Atxn10 |
|
0 |
8939 |
18938 |
58756 |
83780 |
|
n.v. |
0.17 |
0.01 |
0.16 |
0.17 |
|
ataxin-10 |
| 124244104 |
|
Atxn2 |
|
0 |
0 |
272 |
704 |
0 |
|
n.v. |
n.v. |
0.26 |
0.54 |
n.v. |
|
ataxin-2 |
| 33942089 |
|
Atxn2l |
|
0 |
0 |
2594 |
0 |
1028 |
|
n.v. |
n.v. |
0.4 |
n.v. |
1.15 |
|
ataxin-2-like protein |
| 268837077 |
|
Atxn3 |
|
0 |
0 |
0 |
0 |
6618 |
|
n.v. |
n.v. |
n.v. |
n.v. |
0.43 |
|
ataxin-3 isoform 1 |
| 268837154 |
|
Atxn3 |
|
0 |
0 |
0 |
0 |
2817 |
|
n.v. |
n.v. |
n.v. |
n.v. |
0 |
|
ataxin-3 isoform 2 |
| 113930747 |
|
Atxn7l3b |
|
0 |
334 |
666 |
237 |
6490 |
|
n.v. |
0.16 |
0.04 |
0.33 |
0.1 |
|
putative ataxin-7-like protein 3B |
| 85701612 |
|
AU015228 |
|
0 |
127 |
59 |
1703 |
0 |
|
n.v. |
-0.29 |
-0.36 |
0.32 |
n.v. |
|
uncharacterized protein LOC99169 |
| 201025409 |
|
AU019823 |
|
0 |
194 |
18 |
0 |
0 |
|
n.v. |
0.21 |
-0.59 |
n.v. |
n.v. |
|
uncharacterized protein LOC270156 |
| 116268115 |
|
Auh |
|
0 |
1123 |
0 |
0 |
0 |
|
n.v. |
-0.17 |
n.v. |
n.v. |
n.v. |
|
methylglutaconyl-CoA hydratase, mitochondrial precursor |
| 90403601 |
|
Aup1 |
|
1776 |
2181 |
481 |
0 |
0 |
|
0.09 |
0.03 |
-0.09 |
n.v. |
n.v. |
|
ancient ubiquitous protein 1 |
| 46358064 |
|
Aurka |
|
0 |
0 |
0 |
0 |
0 |
|
n.v. |
n.v. |
0.2 |
n.v. |
n.v. |
|
aurora kinase A |
| 260099645 |
|
Aven |
|
0 |
0 |
0 |
737 |
0 |
|
n.v. |
n.v. |
n.v. |
-2.35 |
n.v. |
|
cell death regulator Aven isoform 1 |
| 260099647 |
|
Aven |
|
0 |
0 |
0 |
737 |
0 |
|
n.v. |
n.v. |
n.v. |
-2.35 |
n.v. |
|
cell death regulator Aven isoform 2 |
| 226529032 |
|
Avl9 |
|
0 |
0 |
1945 |
8325 |
332 |
|
n.v. |
n.v. |
0.08 |
0.1 |
0.1 |
|
late secretory pathway protein AVL9 homolog |
| 19526465 |
|
Avpi1 |
|
0 |
0 |
0 |
147 |
0 |
|
n.v. |
n.v. |
n.v. |
0.17 |
n.v. |
|
arginine vasopressin-induced protein 1 |
| 157388985 |
|
AW209491 |
|
494 |
0 |
354 |
0 |
0 |
|
-0.22 |
n.v. |
-0.02 |
n.v. |
n.v. |
|
UPF0415 protein C7orf25 homolog |
| 52630434 |
|
AW549877 |
|
0 |
219 |
0 |
499 |
2024 |
|
n.v. |
0.23 |
n.v. |
0.32 |
-0.04 |
|
UPF0600 protein C5orf51 homolog |
| 30520173 |
|
AW551984 |
|
0 |
311 |
0 |
0 |
0 |
|
n.v. |
0.21 |
n.v. |
n.v. |
n.v. |
|
BCSC-1 |
| 39930561 |
|
AY358078 |
|
0 |
0 |
0 |
0 |
86 |
|
n.v. |
n.v. |
n.v. |
n.v. |
0 |
|
uncharacterized protein LOC278676 |
| 294345409 |
|
Azi1 |
|
0 |
0 |
334 |
0 |
0 |
|
n.v. |
n.v. |
-0.01 |
n.v. |
n.v. |
|
5-azacytidine-induced protein 1 |
| 31981890 |
|
B2m |
|
0 |
0 |
1020 |
0 |
0 |
|
n.v. |
n.v. |
-0.21 |
n.v. |
n.v. |
|
beta-2-microglobulin precursor |
| 17978260 |
|
B3galt6 |
|
0 |
1359 |
0 |
0 |
0 |
|
n.v. |
-0.5 |
n.v. |
n.v. |
n.v. |
|
beta-1,3-galactosyltransferase 6 |
| 13195672 |
|
B3gat3 |
|
0 |
0 |
12 |
0 |
0 |
|
n.v. |
n.v. |
0.29 |
n.v. |
n.v. |
|
galactosylgalactosylxylosylprotein
3-beta-glucuronosyltransferase 3 |
| 170784852 |
|
B3gnt3 |
|
0 |
10 |
0 |
0 |
0 |
|
n.v. |
0.35 |
n.v. |
n.v. |
n.v. |
|
UDP-GlcNAc:betaGal
beta-1,3-N-acetylglucosaminyltransferase 3 precursor |
| 347543755 |
|
B4galnt1 |
|
0 |
5526 |
2233 |
0 |
0 |
|
n.v. |
-0.15 |
-0.23 |
n.v. |
n.v. |
|
beta-1,4 N-acetylgalactosaminyltransferase 1 isoform
2 |
| 347543757 |
|
B4galnt1 |
|
0 |
2209 |
123 |
0 |
0 |
|
n.v. |
-0.11 |
-3.17 |
n.v. |
n.v. |
|
beta-1,4 N-acetylgalactosaminyltransferase 1 isoform
3 |
| 347543759 |
|
B4galnt1 |
|
0 |
2209 |
123 |
0 |
0 |
|
n.v. |
-0.11 |
-3.17 |
n.v. |
n.v. |
|
beta-1,4 N-acetylgalactosaminyltransferase 1 isoform
4 |
| 6679929 |
|
B4galnt1 |
|
0 |
5526 |
2233 |
0 |
0 |
|
n.v. |
-0.15 |
-0.23 |
n.v. |
n.v. |
|
beta-1,4 N-acetylgalactosaminyltransferase 1 isoform
1 |
| 6679931 |
|
B4galnt2 |
|
0 |
0 |
0 |
0 |
5248 |
|
n.v. |
n.v. |
n.v. |
n.v. |
0.06 |
|
beta-1,4 N-acetylgalactosaminyltransferase 2 |
| 11602910 |
|
B4galt1 |
|
0 |
152 |
177 |
0 |
0 |
|
n.v. |
-0.22 |
-0.24 |
n.v. |
n.v. |
|
beta-1,4-galactosyltransferase 1 |
| 188528672 |
|
B4galt4 |
|
0 |
382 |
0 |
0 |
0 |
|
n.v. |
-0.29 |
n.v. |
n.v. |
n.v. |
|
beta-1,4-galactosyltransferase 4 precursor |
| 116089306 |
|
B4galt5 |
|
0 |
152 |
177 |
0 |
0 |
|
n.v. |
-0.22 |
-0.24 |
n.v. |
n.v. |
|
beta-1,4-galactosyltransferase 5 |
| 268838948 |
|
Babam1 |
|
0 |
0 |
60 |
0 |
0 |
|
n.v. |
n.v. |
0.17 |
n.v. |
n.v. |
|
BRISC and BRCA1-A complex member 1 |
| 6671610 |
|
Bad |
|
0 |
0 |
0 |
0 |
332 |
|
n.v. |
n.v. |
n.v. |
n.v. |
1.17 |
|
bcl2 antagonist of cell death |
| 157952206 |
|
Bag1 |
|
0 |
0 |
168 |
352 |
10474 |
|
n.v. |
n.v. |
0.3 |
0.08 |
-0.07 |
|
BAG family molecular chaperone regulator 1 isoform 1L |
| 284507286 |
|
Bag1 |
|
0 |
0 |
168 |
352 |
10474 |
|
n.v. |
n.v. |
0.3 |
0.08 |
-0.07 |
|
BAG family molecular chaperone regulator 1 isoform 1S |
| 21703784 |
|
Bag2 |
|
9666 |
1163 |
3907 |
19105 |
2838 |
|
-0.09 |
-0.1 |
-0.01 |
0.05 |
0.02 |
|
BAG family molecular chaperone regulator 2 |
| 17975504 |
|
Bag4 |
|
0 |
0 |
0 |
0 |
1028 |
|
n.v. |
n.v. |
n.v. |
n.v. |
1.36 |
|
BAG family molecular chaperone regulator 4 |
| 58037205 |
|
Bag5 |
|
0 |
689 |
776 |
966 |
42281 |
|
n.v. |
-0.02 |
-0.09 |
-0.05 |
-0.08 |
|
BAG family molecular chaperone regulator 5 |
| 33147082 |
|
Bag6 |
|
0 |
357 |
2498 |
32644 |
46158 |
|
n.v. |
0.23 |
0.06 |
0.19 |
0.15 |
|
large proline-rich protein BAG6 isoform 1 |
| 357197137 |
|
Bag6 |
|
0 |
357 |
2498 |
32644 |
46158 |
|
n.v. |
0.23 |
0.06 |
0.19 |
0.15 |
|
large proline-rich protein BAG6 isoform 2 |
| 357197139 |
|
Bag6 |
|
0 |
357 |
2498 |
30123 |
52016 |
|
n.v. |
0.23 |
0.06 |
0.18 |
0.13 |
|
large proline-rich protein BAG6 isoform 3 |
| 262231776 |
|
Baiap2 |
|
586 |
5229 |
54318 |
0 |
43 |
|
0.43 |
0.02 |
-0.43 |
n.v. |
-3.07 |
|
brain-specific angiogenesis inhibitor 1-associated
protein 2 isoform a |
| 83642836 |
|
Baiap2 |
|
586 |
5229 |
54318 |
0 |
43 |
|
0.43 |
0.02 |
-0.43 |
n.v. |
-3.07 |
|
brain-specific angiogenesis inhibitor 1-associated
protein 2 isoform b |
| 83649713 |
|
Baiap2 |
|
586 |
5229 |
54318 |
0 |
43 |
|
0.43 |
0.02 |
-0.43 |
n.v. |
-3.07 |
|
brain-specific angiogenesis inhibitor 1-associated
protein 2 isoform c |
| 21313234 |
|
Baiap2l1 |
|
0 |
0 |
8260 |
0 |
0 |
|
n.v. |
n.v. |
-0.11 |
n.v. |
n.v. |
|
brain-specific angiogenesis inhibitor 1-associated
protein 2-like protein 1 |
| 111955302 |
|
Bak1 |
|
1904 |
4565 |
181 |
131 |
0 |
|
0.01 |
-0.23 |
-0.2 |
0.52 |
n.v. |
|
bcl-2 homologous antagonist/killer |
| 6753178;84042521 |
|
Banf1 |
|
0 |
0 |
3963 |
0 |
0 |
|
n.v. |
n.v. |
0.07 |
n.v. |
n.v. |
|
barrier-to-autointegration factor |
| 84042521 |
|
Banf1 |
|
28777 |
0 |
0 |
2087 |
0 |
|
-0.02 |
n.v. |
n.v. |
0.04 |
n.v. |
|
barrier-to-autointegration factor |
| 45598372 |
|
Basp1 |
|
39925 |
7903 |
43102 |
41648 |
3920 |
|
0.2 |
0.25 |
0.03 |
-0.14 |
-0.31 |
|
brain acid soluble protein 1 |
| 6680770 |
|
Bax |
|
659 |
4649 |
5012 |
24401 |
5987 |
|
-0.17 |
0.11 |
0.06 |
0.1 |
0.2 |
|
apoptosis regulator BAX |
| 170295818 |
|
Baz1b |
|
6554 |
0 |
0 |
0 |
0 |
|
0 |
n.v. |
n.v. |
n.v. |
n.v. |
|
tyrosine-protein kinase BAZ1B |
| 294774603 |
|
BB287469 |
|
0 |
253 |
0 |
6090 |
750 |
|
n.v. |
0.35 |
n.v. |
0.02 |
0.08 |
|
eukaryotic translation initiation factor 1A-like 3 |
| 305855096 |
|
Bbip1 |
|
0 |
0 |
0 |
0 |
0 |
|
n.v. |
n.v. |
1.19 |
n.v. |
n.v. |
|
BBSome-interacting protein 1 |
| 84370025 |
|
Bbs1 |
|
0 |
0 |
19 |
475 |
0 |
|
n.v. |
n.v. |
-0.45 |
0.27 |
n.v. |
|
Bardet-Biedl syndrome 1 |
| 116805315 |
|
BC003331 |
|
0 |
192 |
0 |
0 |
0 |
|
n.v. |
-0.06 |
n.v. |
n.v. |
n.v. |
|
protein odr-4 homolog isoform 1 |
| 116805317 |
|
BC003331 |
|
0 |
192 |
0 |
0 |
0 |
|
n.v. |
-0.06 |
n.v. |
n.v. |
n.v. |
|
protein odr-4 homolog isoform 2 |
| 268607692 |
|
BC003965 |
|
110 |
845 |
0 |
0 |
0 |
|
0.05 |
0.07 |
n.v. |
n.v. |
n.v. |
|
protein CCSMST1 precursor |
| 262205179 |
|
BC005561 |
|
165 |
0 |
4 |
0 |
0 |
|
0.29 |
n.v. |
-0.19 |
n.v. |
n.v. |
|
cDNA sequence BC005561 |
| 21450249 |
|
BC005624 |
|
0 |
0 |
0 |
0 |
1242 |
|
n.v. |
n.v. |
n.v. |
n.v. |
0.3 |
|
uncharacterized protein C9orf78 homolog |
| 357527359 |
|
BC017643 |
|
0 |
0 |
192 |
0 |
0 |
|
n.v. |
n.v. |
-2.49 |
n.v. |
n.v. |
|
uncharacterized protein C17orf62 homolog isoform 2 |
| 21450219 |
|
BC017643 |
|
0 |
1131 |
746 |
0 |
0 |
|
n.v. |
-0.19 |
-0.42 |
n.v. |
n.v. |
|
uncharacterized protein C17orf62 homolog isoform 1 |
| 361050365 |
|
BC017643 |
|
0 |
1131 |
746 |
0 |
0 |
|
n.v. |
-0.19 |
-0.42 |
n.v. |
n.v. |
|
uncharacterized protein C17orf62 homolog isoform 3 |
| 21450105 |
|
BC021614 |
|
31541 |
9411 |
17776 |
27397 |
9060 |
|
0.05 |
0.1 |
-0.05 |
0.08 |
-0.1 |
|
glutathione S-transferase P-like |
| 119637821 |
|
BC021891 |
|
0 |
0 |
1351 |
0 |
0 |
|
n.v. |
n.v. |
0.01 |
n.v. |
n.v. |
|
mitogen-activated protein kinase kinase kinase MLK4 |
| 124487245 |
|
BC026590 |
|
0 |
129 |
0 |
98 |
6608 |
|
n.v. |
0.1 |
n.v. |
0.34 |
0 |
|
protein FAM206A |
| 22122411 |
|
BC027231 |
|
0 |
0 |
0 |
377 |
0 |
|
n.v. |
n.v. |
n.v. |
-0.13 |
n.v. |
|
uncharacterized protein LOC212547 |
| 47564127 |
|
BC048507 |
|
14535 |
1912 |
1664 |
1735 |
0 |
|
-0.03 |
0.11 |
0 |
-0.01 |
n.v. |
|
dynein light chain LC8-type 1-like |
| 255522839 |
|
BC051142 |
|
0 |
0 |
0 |
0 |
37890 |
|
n.v. |
n.v. |
n.v. |
n.v. |
0.12 |
|
testis specific basic protein isoform 1 |
| 283046767 |
|
BC068281 |
|
0 |
0 |
0 |
123 |
0 |
|
n.v. |
n.v. |
n.v. |
0.51 |
n.v. |
|
WD repeat-containing protein C2orf44 homolog isoform
1 |
| 283046769 |
|
BC068281 |
|
0 |
0 |
0 |
123 |
0 |
|
n.v. |
n.v. |
n.v. |
0.51 |
n.v. |
|
WD repeat-containing protein C2orf44 homolog isoform
2 |
| 76781476 |
|
BC089491 |
|
0 |
0 |
0 |
1203 |
0 |
|
n.v. |
n.v. |
n.v. |
0 |
n.v. |
|
selenoprotein V |
| 10048460 |
|
Bcam |
|
22498 |
2209 |
9127 |
82 |
27513 |
|
0.1 |
-0.19 |
-0.21 |
0.1 |
-0.09 |
|
basal cell adhesion molecule precursor |
| 6671620 |
|
Bcap29 |
|
0 |
75 |
12 |
0 |
0 |
|
n.v. |
-0.24 |
-0.48 |
n.v. |
n.v. |
|
B-cell receptor-associated protein 29 |
| 31981310 |
|
Bcap31 |
|
11386 |
4119 |
7606 |
1072 |
0 |
|
0.07 |
-0.1 |
-0.25 |
-0.58 |
n.v. |
|
B-cell receptor-associated protein 31 |
| 311771530 |
|
Bcar1 |
|
0 |
0 |
4 |
0 |
11341 |
|
n.v. |
n.v. |
0.22 |
n.v. |
0.32 |
|
breast cancer anti-estrogen resistance protein 1 isoform
A |
| 40254593 |
|
Bcar1 |
|
0 |
0 |
4 |
0 |
11341 |
|
n.v. |
n.v. |
0.22 |
n.v. |
0.32 |
|
breast cancer anti-estrogen resistance protein 1 isoform
B |
| 70906453 |
|
Bcas2 |
|
5437 |
33 |
278 |
393 |
396 |
|
-0.01 |
-0.33 |
0.02 |
-0.17 |
-0.23 |
|
pre-mRNA-splicing factor SPF27 |
| 161016828 |
|
Bcat1 |
|
0 |
0 |
38 |
213 |
10410 |
|
n.v. |
n.v. |
0.26 |
-0.43 |
0.22 |
|
branched-chain-amino-acid aminotransferase, cytosolic
isoform 2 |
| 66792792 |
|
Bcat1 |
|
0 |
0 |
38 |
213 |
3759 |
|
n.v. |
n.v. |
0.26 |
-0.43 |
0.05 |
|
branched-chain-amino-acid aminotransferase, cytosolic
isoform 1 |
| 33859514 |
|
Bcat2 |
|
0 |
822 |
0 |
0 |
0 |
|
n.v. |
-0.61 |
n.v. |
n.v. |
n.v. |
|
branched-chain-amino-acid aminotransferase, mitochondrial
isoform 1 precursor |
| 340007384 |
|
Bcat2 |
|
0 |
822 |
0 |
0 |
0 |
|
n.v. |
-0.61 |
n.v. |
n.v. |
n.v. |
|
branched-chain-amino-acid aminotransferase, mitochondrial
isoform 2 |
| 134031957 |
|
Bccip |
|
0 |
0 |
247 |
0 |
7839 |
|
n.v. |
n.v. |
0.06 |
n.v. |
-0.08 |
|
BRCA2 and CDKN1A-interacting protein |
| 183396774 |
|
Bckdha |
|
0 |
198 |
0 |
0 |
0 |
|
n.v. |
0.24 |
n.v. |
n.v. |
n.v. |
|
2-oxoisovalerate dehydrogenase subunit alpha,
mitochondrial |
| 40353220 |
|
Bckdhb |
|
0 |
2662 |
0 |
0 |
0 |
|
n.v. |
-0.97 |
n.v. |
n.v. |
n.v. |
|
2-oxoisovalerate dehydrogenase subunit beta,
mitochondrial |
| 6753166 |
|
Bcl10 |
|
0 |
0 |
0 |
0 |
1253 |
|
n.v. |
n.v. |
n.v. |
n.v. |
0.51 |
|
B-cell lymphoma/leukemia 10 |
| 58037550 |
|
Bcl2l1 |
|
0 |
0 |
6 |
0 |
0 |
|
n.v. |
n.v. |
0.77 |
n.v. |
n.v. |
|
bcl-2-like protein 1 |
| 46592786 |
|
Bcl2l11 |
|
0 |
257 |
0 |
0 |
0 |
|
n.v. |
0.19 |
n.v. |
n.v. |
n.v. |
|
bcl-2-like protein 11 isoform 1 |
| 23943828 |
|
Bcl2l13 |
|
3478 |
1378 |
896 |
0 |
0 |
|
0.31 |
-0.3 |
-0.26 |
n.v. |
n.v. |
|
bcl-2-like protein 13 |
| 38194232 |
|
Bcl2l14 |
|
0 |
0 |
82 |
688 |
0 |
|
n.v. |
n.v. |
-0.69 |
0.4 |
n.v. |
|
apoptosis facilitator Bcl-2-like protein 14 |
| 22296593 |
|
Bcl7a |
|
0 |
0 |
0 |
352 |
86 |
|
n.v. |
n.v. |
n.v. |
-0.01 |
0.26 |
|
B-cell CLL/lymphoma 7 protein family member A |
| 91206400 |
|
Bcl9l |
|
0 |
0 |
0 |
0 |
161 |
|
n.v. |
n.v. |
n.v. |
n.v. |
0.34 |
|
B-cell CLL/lymphoma 9-like protein |
| 24496776 |
|
Bclaf1 |
|
0 |
2559 |
704 |
3209 |
0 |
|
n.v. |
0.05 |
-0.09 |
-0.15 |
n.v. |
|
bcl-2-associated transcription factor 1 isoform 2 |
| 70906447 |
|
Bclaf1 |
|
0 |
2559 |
704 |
3209 |
0 |
|
n.v. |
0.05 |
-0.09 |
-0.15 |
n.v. |
|
bcl-2-associated transcription factor 1 isoform 1 |
| 70906449 |
|
Bclaf1 |
|
0 |
2559 |
704 |
3209 |
0 |
|
n.v. |
0.05 |
-0.09 |
-0.15 |
n.v. |
|
bcl-2-associated transcription factor 1 isoform 3 |
| 124487229 |
|
Bcr |
|
0 |
0 |
0 |
0 |
867 |
|
n.v. |
n.v. |
n.v. |
n.v. |
0.21 |
|
breakpoint cluster region protein |
| 21313544 |
|
Bcs1l |
|
0 |
459 |
0 |
0 |
0 |
|
n.v. |
0.32 |
n.v. |
n.v. |
n.v. |
|
mitochondrial chaperone BCS1 |
| 170014720 |
|
Bdh1 |
|
1831 |
3722 |
54 |
0 |
0 |
|
0.34 |
-0.2 |
-0.71 |
n.v. |
n.v. |
|
D-beta-hydroxybutyrate dehydrogenase, mitochondrial
precursor |
| 27764875 |
|
Becn1 |
|
0 |
4 |
53 |
0 |
953 |
|
n.v. |
0.04 |
0.19 |
n.v. |
0.28 |
|
beclin-1 |
| 6753182 |
|
Bet1 |
|
0 |
269 |
0 |
196 |
0 |
|
n.v. |
-0.03 |
n.v. |
0.32 |
n.v. |
|
BET1 homolog |
| 170287745 |
|
Bet1l |
|
0 |
633 |
0 |
0 |
0 |
|
n.v. |
-0.2 |
n.v. |
n.v. |
n.v. |
|
BET1-like protein |
| 13994223 |
|
Bicc1 |
|
0 |
0 |
329 |
1097 |
557 |
|
n.v. |
n.v. |
0.36 |
0.29 |
-0.42 |
|
protein bicaudal C homolog 1 |
| 163838764 |
|
Bicd1 |
|
0 |
27 |
120 |
0 |
236 |
|
n.v. |
0.03 |
-0.27 |
n.v. |
-1 |
|
protein bicaudal D homolog 1 isoform 2 |
| 163838766 |
|
Bicd1 |
|
0 |
27 |
120 |
0 |
236 |
|
n.v. |
0.03 |
-0.27 |
n.v. |
-1 |
|
protein bicaudal D homolog 1 isoform 1 |
| 18139547 |
|
Bicd2 |
|
0 |
0 |
89 |
0 |
7722 |
|
n.v. |
n.v. |
0.04 |
n.v. |
0.05 |
|
protein bicaudal D homolog 2 isoform 2 |
| 85702355 |
|
Bicd2 |
|
0 |
0 |
89 |
0 |
7722 |
|
n.v. |
n.v. |
0.04 |
n.v. |
0.05 |
|
protein bicaudal D homolog 2 isoform 1 |
| 85702359 |
|
Bicd2 |
|
0 |
0 |
89 |
0 |
7625 |
|
n.v. |
n.v. |
0.04 |
n.v. |
0.09 |
|
protein bicaudal D homolog 2 isoform 3 |
| 31542228 |
|
Bid |
|
0 |
453 |
0 |
0 |
8054 |
|
n.v. |
0.15 |
n.v. |
n.v. |
0.01 |
|
BH3-interacting domain death agonist |
| 134053947 |
|
Bin1 |
|
0 |
0 |
0 |
4543 |
0 |
|
n.v. |
n.v. |
n.v. |
-3.39 |
n.v. |
|
myc box-dependent-interacting protein 1 isoform 2 |
| 6753050 |
|
Bin1 |
|
0 |
0 |
0 |
4543 |
0 |
|
n.v. |
n.v. |
n.v. |
-3.39 |
n.v. |
|
myc box-dependent-interacting protein 1 isoform 1 |
| 10946638 |
|
Bin3 |
|
0 |
440 |
66 |
638 |
610 |
|
n.v. |
0.4 |
-0.09 |
0.09 |
0.24 |
|
bridging integrator 3 |
| 409971427 |
|
Birc6 |
|
0 |
829 |
1987 |
136445 |
2474 |
|
n.v. |
0.16 |
0.07 |
0.15 |
-0.05 |
|
baculoviral IAP repeat-containing protein 6 |
| 31982490 |
|
Blk |
|
0 |
2261 |
3440 |
4330 |
34420 |
|
n.v. |
0.15 |
-0.03 |
0.42 |
0.29 |
|
tyrosine-protein kinase Blk |
| 30519997 |
|
Blmh |
|
0 |
6093 |
11494 |
133105 |
93805 |
|
n.v. |
-0.11 |
-0.21 |
0.13 |
-0.14 |
|
bleomycin hydrolase |
| 31982209 |
|
Blnk |
|
0 |
0 |
34 |
0 |
0 |
|
n.v. |
n.v. |
0.02 |
n.v. |
n.v. |
|
B-cell linker protein |
| 31980697 |
|
Bloc1s1 |
|
293 |
1351 |
1147 |
5100 |
3277 |
|
0.25 |
0.01 |
0.01 |
-0.06 |
-0.1 |
|
biogenesis of lysosome-related organelles complex 1
subunit 1 |
| 19526908 |
|
Bloc1s4 |
|
0 |
0 |
0 |
57 |
0 |
|
n.v. |
n.v. |
n.v. |
1.56 |
n.v. |
|
protein cappuccino |
| 20532342 |
|
Bloc1s5 |
|
0 |
0 |
72 |
0 |
1981 |
|
n.v. |
n.v. |
0.57 |
n.v. |
0.14 |
|
protein Muted |
| 124487331 |
|
Blvra |
|
476 |
10807 |
4958 |
10617 |
134394 |
|
0.15 |
0.1 |
0.04 |
0.1 |
0 |
|
biliverdin reductase A precursor |
| 21450325 |
|
Blvrb |
|
0 |
2626 |
698 |
663 |
35834 |
|
n.v. |
0.14 |
-0.14 |
0.36 |
-0.03 |
|
flavin reductase (NADPH) |
| 31982487 |
|
Bmp7 |
|
0 |
0 |
1772 |
0 |
0 |
|
n.v. |
n.v. |
-0.05 |
n.v. |
n.v. |
|
bone morphogenetic protein 7 preproprotein |
| 255003752 |
|
Bnip1 |
|
0 |
405 |
290 |
0 |
0 |
|
n.v. |
0.19 |
-0.04 |
n.v. |
n.v. |
|
vesicle transport protein SEC20 |
| 67906187 |
|
Bod1 |
|
0 |
0 |
0 |
0 |
1382 |
|
n.v. |
n.v. |
n.v. |
n.v. |
0.11 |
|
biorientation of chromosomes in cell division protein 1 |
| 124487265 |
|
Bod1l |
|
0 |
0 |
0 |
0 |
3973 |
|
n.v. |
n.v. |
n.v. |
n.v. |
0.02 |
|
biorientation of chromosomes in cell division 1-like |
| 7949082 |
|
Bok |
|
0 |
845 |
135 |
0 |
0 |
|
n.v. |
-0.2 |
-0.07 |
n.v. |
n.v. |
|
bcl-2-related ovarian killer protein |
| 58037151 |
|
Bola1 |
|
0 |
643 |
19 |
156 |
18078 |
|
n.v. |
-0.06 |
-0.13 |
-0.25 |
0.2 |
|
bolA-like protein 1 |
| 29171318 |
|
Bola2 |
|
0 |
27 |
0 |
0 |
2710 |
|
n.v. |
-0.13 |
n.v. |
n.v. |
0.14 |
|
bolA-like protein 2 |
| 7304931 |
|
Bop1 |
|
0 |
0 |
0 |
2767 |
0 |
|
n.v. |
n.v. |
n.v. |
0.3 |
n.v. |
|
ribosome biogenesis protein BOP1 |
| 6680806 |
|
Bpgm |
|
3661 |
0 |
2919 |
5984 |
0 |
|
0.14 |
n.v. |
0.04 |
0 |
n.v. |
|
bisphosphoglycerate mutase |
| 21624609 |
|
Bphl |
|
29198 |
15251 |
0 |
0 |
1092 |
|
-0.02 |
-0.2 |
n.v. |
n.v. |
0.17 |
|
valacyclovir hydrolase precursor |
| 39652626 |
|
Bpnt1 |
|
0 |
142 |
6174 |
1997 |
293033 |
|
n.v. |
0.18 |
0.15 |
0.32 |
0.12 |
|
3'(2'),5'-bisphosphate nucleotidase 1 |
| 153791904 |
|
Braf |
|
0 |
0 |
0 |
2562 |
0 |
|
n.v. |
n.v. |
n.v. |
0.32 |
n.v. |
|
serine/threonine-protein kinase B-raf |
| 70608139 |
|
Brap |
|
0 |
0 |
1386 |
0 |
107 |
|
n.v. |
n.v. |
-0.2 |
n.v. |
1.61 |
|
BRCA1-associated protein |
| 30841004 |
|
Brat1 |
|
0 |
0 |
0 |
589 |
0 |
|
n.v. |
n.v. |
n.v. |
-0.88 |
n.v. |
|
BRCA1-associated ATM activator 1 isoform 2 |
| 443609479 |
|
Brat1 |
|
0 |
0 |
0 |
589 |
0 |
|
n.v. |
n.v. |
n.v. |
-0.88 |
n.v. |
|
BRCA1-associated ATM activator 1 isoform 3 |
| 262050563 |
|
Brcc3 |
|
0 |
449 |
60 |
16821 |
17489 |
|
n.v. |
0.43 |
-0.11 |
0.08 |
-0.09 |
|
lys-63-specific deubiquitinase BRCC36 |
| 71067345 |
|
Brd2 |
|
0 |
148 |
0 |
0 |
0 |
|
n.v. |
0.26 |
n.v. |
n.v. |
n.v. |
|
bromodomain-containing protein 2 |
| 165972331 |
|
Brd3 |
|
0 |
850 |
79 |
0 |
0 |
|
n.v. |
-0.36 |
-0.89 |
n.v. |
n.v. |
|
bromodomain-containing protein 3 isoform 2 |
| 165972335 |
|
Brd3 |
|
0 |
549 |
42 |
0 |
0 |
|
n.v. |
-0.91 |
-1.81 |
n.v. |
n.v. |
|
bromodomain-containing protein 3 isoform 1 |
| 226246640 |
|
Brd4 |
|
0 |
301 |
37 |
0 |
0 |
|
n.v. |
-0.36 |
0.02 |
n.v. |
n.v. |
|
bromodomain-containing protein 4 isoform 2 |
| 226342873 |
|
Brd4 |
|
0 |
301 |
37 |
0 |
0 |
|
n.v. |
-0.36 |
0.02 |
n.v. |
n.v. |
|
bromodomain-containing protein 4 isoform 1 |
| 21617851 |
|
Bre |
|
0 |
484 |
2141 |
4322 |
18303 |
|
n.v. |
0.25 |
0.09 |
0.12 |
0.06 |
|
BRCA1-A complex subunit BRE isoform V |
| 41281924 |
|
Bre |
|
0 |
409 |
648 |
1719 |
5012 |
|
n.v. |
0.26 |
0.13 |
-0.25 |
0.39 |
|
BRCA1-A complex subunit BRE isoform I |
| 41281930 |
|
Bre |
|
0 |
409 |
487 |
1719 |
5012 |
|
n.v. |
0.26 |
0.15 |
-0.25 |
0.39 |
|
BRCA1-A complex subunit BRE isoform III |
| 41281940 |
|
Bre |
|
0 |
409 |
487 |
1719 |
5012 |
|
n.v. |
0.26 |
0.15 |
-0.25 |
0.39 |
|
BRCA1-A complex subunit BRE isoform IV |
| 41281945 |
|
Bre |
|
0 |
342 |
203 |
221 |
2656 |
|
n.v. |
0.23 |
0.1 |
0.19 |
0.51 |
|
BRCA1-A complex subunit BRE isoform II |
| 255683449 |
|
Bri3 |
|
0 |
288 |
0 |
74 |
0 |
|
n.v. |
0.4 |
n.v. |
1.02 |
n.v. |
|
brain protein I3 isoform 1 |
| 255683451 |
|
Bri3 |
|
0 |
288 |
0 |
74 |
0 |
|
n.v. |
0.4 |
n.v. |
1.02 |
n.v. |
|
brain protein I3 isoform 2 |
| 58037467 |
|
Bri3bp |
|
18507 |
2060 |
2657 |
180 |
0 |
|
0.21 |
-0.25 |
-0.34 |
0.33 |
n.v. |
|
BRI3-binding protein precursor |
| 141802630 |
|
Brix1 |
|
0 |
0 |
0 |
6008 |
0 |
|
n.v. |
n.v. |
n.v. |
-0.23 |
n.v. |
|
ribosome biogenesis protein BRX1 homolog |
| 19527154 |
|
Brk1 |
|
73 |
722 |
1241 |
123 |
1478 |
|
0.54 |
-0.03 |
-0.07 |
-0.35 |
-0.21 |
|
protein BRICK1 |
| 58037255 |
|
Brox |
|
0 |
3870 |
4093 |
0 |
3598 |
|
n.v. |
0.14 |
0.04 |
n.v. |
-0.52 |
|
BRO1 domain-containing protein BROX |
| 31542236 |
|
Brs3 |
|
0 |
0 |
0 |
5959 |
0 |
|
n.v. |
n.v. |
n.v. |
0.15 |
n.v. |
|
bombesin receptor subtype-3 |
| 31981603 |
|
Bsdc1 |
|
0 |
0 |
4 |
0 |
0 |
|
n.v. |
n.v. |
-0.29 |
n.v. |
n.v. |
|
BSD domain-containing protein 1 |
| 116014342 |
|
Bsg |
|
32127 |
34640 |
108804 |
9929 |
0 |
|
0.02 |
0.12 |
-0.06 |
-0.08 |
n.v. |
|
basigin isoform 2 precursor |
| 34915988 |
|
Bsg |
|
32127 |
34640 |
108804 |
9929 |
0 |
|
0.02 |
0.12 |
-0.06 |
-0.08 |
n.v. |
|
basigin isoform 1 precursor |
| 91598894 |
|
Bsnd |
|
0 |
0 |
60 |
0 |
0 |
|
n.v. |
n.v. |
0.28 |
n.v. |
n.v. |
|
barttin |
| 20149730 |
|
Bspry |
|
0 |
0 |
3137 |
0 |
0 |
|
n.v. |
n.v. |
0 |
n.v. |
n.v. |
|
B box and SPRY domain-containing protein |
| 134288869 |
|
Bst1 |
|
0 |
0 |
29 |
0 |
0 |
|
n.v. |
n.v. |
-0.35 |
n.v. |
n.v. |
|
ADP-ribosyl cyclase 2 precursor |
| 37674242 |
|
Bst2 |
|
0 |
614 |
0 |
0 |
0 |
|
n.v. |
-0.04 |
n.v. |
n.v. |
n.v. |
|
bone marrow stromal antigen 2 precursor |
| 123858774 |
|
Btaf1 |
|
0 |
0 |
1172 |
819 |
23764 |
|
n.v. |
n.v. |
-0.23 |
0.51 |
0.15 |
|
TATA-binding protein-associated factor 172 |
| 83649719 |
|
Btbd1 |
|
0 |
0 |
60 |
0 |
0 |
|
n.v. |
n.v. |
0.1 |
n.v. |
n.v. |
|
BTB/POZ domain-containing protein 1 |
| 163965446 |
|
Btbd2 |
|
0 |
0 |
60 |
417 |
0 |
|
n.v. |
n.v. |
0.1 |
-0.89 |
n.v. |
|
BTB (POZ) domain containing 2 |
| 13384648 |
|
Btd |
|
0 |
121 |
0 |
0 |
0 |
|
n.v. |
-0.55 |
n.v. |
n.v. |
n.v. |
|
biotinidase precursor |
| 281485611 |
|
Btf3 |
|
0 |
2478 |
20467 |
113575 |
15871 |
|
n.v. |
0.26 |
0.07 |
-0.02 |
0.03 |
|
transcription factor BTF3 isoform 2 |
| 56605979 |
|
Btf3 |
|
0 |
2430 |
17058 |
113403 |
15722 |
|
n.v. |
0.11 |
0.19 |
-0.02 |
0.02 |
|
transcription factor BTF3 isoform 1 |
| 29789195 |
|
Btf3l4 |
|
275 |
169 |
2849 |
16641 |
13612 |
|
-0.9 |
0.31 |
0.09 |
0.09 |
0.11 |
|
transcription factor BTF3 homolog 4 |
| 161086887 |
|
Btrc |
|
0 |
0 |
0 |
229 |
0 |
|
n.v. |
n.v. |
n.v. |
0.08 |
n.v. |
|
F-box/WD repeat-containing protein 1A isoform a |
| 6753210 |
|
Btrc |
|
0 |
0 |
0 |
229 |
0 |
|
n.v. |
n.v. |
n.v. |
0.08 |
n.v. |
|
F-box/WD repeat-containing protein 1A isoform b |
| 163937845 |
|
Bub1 |
|
0 |
0 |
0 |
0 |
0 |
|
n.v. |
n.v. |
0.8 |
n.v. |
n.v. |
|
mitotic checkpoint serine/threonine-protein kinase BUB1
isoform 1 |
| 163937847 |
|
Bub1 |
|
0 |
0 |
0 |
0 |
0 |
|
n.v. |
n.v. |
0.8 |
n.v. |
n.v. |
|
mitotic checkpoint serine/threonine-protein kinase BUB1
isoform 2 |
| 157951692 |
|
Bub1b |
|
3661 |
668 |
5201 |
6917 |
17360 |
|
-0.03 |
0.19 |
-0.04 |
0.08 |
0.1 |
|
mitotic checkpoint serine/threonine-protein kinase BUB1
beta |
| 31560618 |
|
Bub3 |
|
77764 |
349 |
28426 |
38276 |
57756 |
|
-0.02 |
0.11 |
-0.15 |
-0.07 |
-0.05 |
|
mitotic checkpoint protein BUB3 |
| 57222238 |
|
Bud31 |
|
7908 |
616 |
838 |
1678 |
2592 |
|
-0.07 |
0.12 |
0.07 |
0.01 |
0.05 |
|
protein BUD31 homolog |
| 164698440 |
|
Bysl |
|
0 |
0 |
269 |
6933 |
0 |
|
n.v. |
n.v. |
0.11 |
-0.12 |
n.v. |
|
bystin |
| 157909774 |
|
Bzrap1 |
|
0 |
0 |
6 |
0 |
0 |
|
n.v. |
n.v. |
1.74 |
n.v. |
n.v. |
|
peripheral-type benzodiazepine receptor-associated
protein 1 |
| 13385296 |
|
Bzw1 |
|
10617 |
5739 |
75019 |
1130 |
76937 |
|
0.06 |
0.17 |
0.07 |
0.23 |
0.12 |
|
basic leucine zipper and W2 domain-containing protein 1 |
| 31981160 |
|
Bzw2 |
|
13638 |
8058 |
55638 |
1130 |
46404 |
|
0.06 |
0.07 |
0.05 |
0.23 |
0.03 |
|
basic leucine zipper and W2 domain-containing protein 2 |
| 210147428 |
|
C030006K11Rik |
|
513 |
0 |
0 |
0 |
257 |
|
-0.07 |
n.v. |
n.v. |
n.v. |
-0.28 |
|
UPF0598 protein C8orf82 homolog isoform 2 |
| 21735489 |
|
C030006K11Rik |
|
549 |
0 |
0 |
0 |
257 |
|
-0.07 |
n.v. |
n.v. |
n.v. |
-0.28 |
|
UPF0598 protein C8orf82 homolog isoform 1 |
| 112181167 |
|
C1qbp |
|
106742 |
14552 |
0 |
614 |
0 |
|
0.01 |
-0.1 |
n.v. |
-0.59 |
n.v. |
|
complement component 1 Q subcomponent-binding protein,
mitochondrial |
| 157838011 |
|
C2cd5 |
|
0 |
0 |
0 |
82 |
0 |
|
n.v. |
n.v. |
n.v. |
0.47 |
n.v. |
|
uncharacterized protein KIAA0528 isoform 1 |
| 157838013 |
|
C2cd5 |
|
0 |
0 |
0 |
82 |
0 |
|
n.v. |
n.v. |
n.v. |
0.47 |
n.v. |
|
uncharacterized protein KIAA0528 isoform 2 |
| 157838015 |
|
C2cd5 |
|
0 |
0 |
0 |
82 |
0 |
|
n.v. |
n.v. |
n.v. |
0.47 |
n.v. |
|
uncharacterized protein KIAA0528 isoform 3 |
| 166063959 |
|
C330007P06Rik |
|
0 |
1134 |
1340 |
1523 |
54 |
|
n.v. |
0.29 |
0.14 |
0.06 |
1.32 |
|
UPF0428 protein CXorf56 homolog |
| 75677516 |
|
C77080 |
|
0 |
19 |
344 |
0 |
0 |
|
n.v. |
0.13 |
-0.09 |
n.v. |
n.v. |
|
uncharacterized protein KIAA1522 |
| 401871063 |
|
C920025E04Rik |
|
0 |
0 |
234 |
0 |
0 |
|
n.v. |
n.v. |
-0.31 |
n.v. |
n.v. |
|
H-2 class I histocompatibility antigen-like precursor |
| 161086893 |
|
Cab39 |
|
2801 |
5661 |
5372 |
9250 |
9478 |
|
-0.27 |
0.07 |
-0.15 |
0 |
0.14 |
|
calcium-binding protein 39 |
| 31541826 |
|
Cab39l |
|
0 |
4405 |
5795 |
11362 |
16096 |
|
n.v. |
0.32 |
0.05 |
0.21 |
0.28 |
|
calcium-binding protein 39-like |
| 58037485 |
|
Cacfd1 |
|
0 |
0 |
37 |
0 |
0 |
|
n.v. |
n.v. |
0.07 |
n.v. |
n.v. |
|
calcium channel flower homolog isoform 1 |
| 121583673 |
|
Cactin |
|
0 |
196 |
170 |
0 |
0 |
|
n.v. |
0 |
-0.08 |
n.v. |
n.v. |
|
cactin |
| 285402212 |
|
Cacul1 |
|
0 |
0 |
0 |
0 |
3213 |
|
n.v. |
n.v. |
n.v. |
n.v. |
0.29 |
|
CDK2-associated and cullin domain-containing protein 1
isoform 2 |
| 285402250 |
|
Cacul1 |
|
0 |
0 |
0 |
0 |
1114 |
|
n.v. |
n.v. |
n.v. |
n.v. |
0.14 |
|
CDK2-associated and cullin domain-containing protein 1
isoform 3 |
| 58037533 |
|
Cacul1 |
|
0 |
0 |
0 |
0 |
3213 |
|
n.v. |
n.v. |
n.v. |
n.v. |
0.29 |
|
CDK2-associated and cullin domain-containing protein 1
isoform 1 |
| 33468885 |
|
Cacybp |
|
0 |
7626 |
4991 |
34011 |
51395 |
|
n.v. |
0.11 |
0.06 |
0.09 |
-0.03 |
|
calcyclin-binding protein |
| 51093867 |
|
Cad |
|
0 |
1783 |
3247 |
181572 |
26303 |
|
n.v. |
0.3 |
0 |
0.14 |
0.01 |
|
carbamoyl-phosphate synthetase 2, aspartate
transcarbamylase, and dihydroorotase |
| 46575940 |
|
Cadm1 |
|
0 |
1635 |
912 |
0 |
0 |
|
n.v. |
-0.46 |
-0.31 |
n.v. |
n.v. |
|
cell adhesion molecule 1 isoform b precursor |
| 71040102 |
|
Cadm1 |
|
0 |
1635 |
912 |
0 |
0 |
|
n.v. |
-0.46 |
-0.31 |
n.v. |
n.v. |
|
cell adhesion molecule 1 isoform a precursor |
| 71040104 |
|
Cadm1 |
|
0 |
1635 |
912 |
0 |
0 |
|
n.v. |
-0.46 |
-0.31 |
n.v. |
n.v. |
|
cell adhesion molecule 1 isoform c precursor |
| 71040107 |
|
Cadm1 |
|
0 |
1635 |
912 |
0 |
0 |
|
n.v. |
-0.46 |
-0.31 |
n.v. |
n.v. |
|
cell adhesion molecule 1 isoform d precursor |
| 23346547 |
|
Cadm4 |
|
0 |
21 |
0 |
0 |
0 |
|
n.v. |
-0.02 |
n.v. |
n.v. |
n.v. |
|
cell adhesion molecule 4 precursor |
| 21312944 |
|
Calcoco1 |
|
0 |
0 |
309 |
0 |
31154 |
|
n.v. |
n.v. |
-0.6 |
n.v. |
0.21 |
|
calcium-binding and coiled-coil domain-containing protein
1 |
| 21704156 |
|
Cald1 |
|
0 |
2 |
129 |
16 |
7882 |
|
n.v. |
0.79 |
0.14 |
0.16 |
-0.13 |
|
caldesmon 1 |
| 6680832;6680834 |
|
Calm2 |
|
147748 |
0 |
42324 |
0 |
0 |
|
0.16 |
n.v. |
0.05 |
n.v. |
n.v. |
|
calmodulin |
| 6680834 |
|
Calm3 |
|
0 |
35930 |
0 |
82543 |
123170 |
|
n.v. |
0.15 |
n.v. |
0.11 |
0.09 |
|
calmodulin |
| 13386230 |
|
Calml3 |
|
63687 |
2407 |
7646 |
426 |
1831 |
|
0.15 |
0.07 |
0.03 |
0.17 |
0.06 |
|
calmodulin-like protein 3 |
| 6680836 |
|
Calr |
|
414448 |
63728 |
62754 |
0 |
37033 |
|
0.1 |
-0.13 |
-0.16 |
n.v. |
-0.46 |
|
calreticulin precursor |
| 549806750 |
|
Calu |
|
4888 |
0 |
0 |
0 |
0 |
|
0.27 |
n.v. |
n.v. |
n.v. |
n.v. |
|
calumenin isoform 3 |
| 41282022 |
|
Calu |
|
12961 |
5864 |
5900 |
0 |
16343 |
|
0.26 |
-0.17 |
-0.01 |
n.v. |
0.05 |
|
calumenin isoform 2 precursor |
| 6680840 |
|
Calu |
|
13766 |
9747 |
6610 |
0 |
16343 |
|
0.27 |
-0.15 |
-0.01 |
n.v. |
0.05 |
|
calumenin isoform 1 precursor |
| 19527140 |
|
Camk1 |
|
0 |
0 |
18 |
0 |
0 |
|
n.v. |
n.v. |
-0.04 |
n.v. |
n.v. |
|
calcium/calmodulin-dependent protein kinase type 1 |
| 28916677 |
|
Camk2a |
|
4558 |
5455 |
7325 |
50456 |
13880 |
|
-0.24 |
-0.03 |
-0.05 |
0.11 |
-0.01 |
|
calcium/calmodulin-dependent protein kinase type II
subunit alpha isoform 2 |
| 226693349 |
|
Camk2b |
|
4558 |
5592 |
7590 |
50456 |
13880 |
|
-0.24 |
-0.03 |
-0.07 |
0.11 |
-0.01 |
|
calcium/calmodulin-dependent protein kinase type II
subunit beta isoform 2 |
| 291291008 |
|
Camk2b |
|
4558 |
5592 |
7590 |
50456 |
13880 |
|
-0.24 |
-0.03 |
-0.07 |
0.11 |
-0.01 |
|
calcium/calmodulin-dependent protein kinase type II
subunit beta isoform 1 |
| 291291010 |
|
Camk2b |
|
4558 |
5592 |
7590 |
50456 |
13880 |
|
-0.24 |
-0.03 |
-0.07 |
0.11 |
-0.01 |
|
calcium/calmodulin-dependent protein kinase type II
subunit beta isoform 3 |
| 18158420 |
|
Camk2d |
|
11423 |
10041 |
15690 |
86751 |
21419 |
|
0.28 |
0.12 |
-0.06 |
0.13 |
-0.07 |
|
calcium/calmodulin-dependent protein kinase type II
subunit delta isoform 3 |
| 70906477 |
|
Camk2d |
|
11423 |
10385 |
15690 |
89435 |
21419 |
|
0.28 |
0.12 |
-0.06 |
0.11 |
-0.07 |
|
calcium/calmodulin-dependent protein kinase type II
subunit delta isoform 2 |
| 70906479 |
|
Camk2d |
|
11423 |
10041 |
15690 |
92808 |
21419 |
|
0.28 |
0.12 |
-0.06 |
0.13 |
-0.07 |
|
calcium/calmodulin-dependent protein kinase type II
subunit delta isoform 1 |
| 75991700 |
|
Camk2g |
|
4558 |
5592 |
7047 |
52617 |
13880 |
|
-0.24 |
-0.03 |
-0.06 |
0.13 |
-0.01 |
|
calcium/calmodulin-dependent protein kinase type II
subunit gamma isoform 1 |
| 85362729 |
|
Camk2g |
|
4558 |
5592 |
7047 |
52617 |
13880 |
|
-0.24 |
-0.03 |
-0.06 |
0.13 |
-0.01 |
|
calcium/calmodulin-dependent protein kinase type II
subunit gamma isoform 3 |
| 85362742 |
|
Camk2g |
|
4558 |
5592 |
7047 |
52617 |
13880 |
|
-0.24 |
-0.03 |
-0.06 |
0.13 |
-0.01 |
|
calcium/calmodulin-dependent protein kinase type II
subunit gamma isoform 2 |
| 21703722 |
|
Camkk2 |
|
0 |
0 |
0 |
0 |
3074 |
|
n.v. |
n.v. |
n.v. |
n.v. |
0.18 |
|
calcium/calmodulin-dependent protein kinase kinase 2
isoform 2 |
| 314122344 |
|
Camkk2 |
|
0 |
0 |
0 |
0 |
3074 |
|
n.v. |
n.v. |
n.v. |
n.v. |
0.18 |
|
calcium/calmodulin-dependent protein kinase kinase 2
isoform 1 |
| 124249226 |
|
Camkmt |
|
0 |
0 |
0 |
0 |
450 |
|
n.v. |
n.v. |
n.v. |
n.v. |
-0.18 |
|
calmodulin-lysine N-methyltransferase |
| 226423895 |
|
Camp |
|
0 |
165 |
0 |
0 |
0 |
|
n.v. |
-0.03 |
n.v. |
n.v. |
n.v. |
|
cathelin-related antimicrobial peptide precursor |
| 255069774 |
|
Camsap3 |
|
0 |
106 |
142 |
0 |
0 |
|
n.v. |
0.31 |
0.04 |
n.v. |
n.v. |
|
calmodulin-regulated spectrin-associated protein 3
isoform 1 |
| 255069776 |
|
Camsap3 |
|
0 |
106 |
142 |
0 |
0 |
|
n.v. |
0.31 |
0.04 |
n.v. |
n.v. |
|
calmodulin-regulated spectrin-associated protein 3
isoform 2 |
| 189409138 |
|
Cand1 |
|
16402 |
16980 |
52106 |
329518 |
296878 |
|
0.03 |
0.1 |
0.01 |
0.05 |
0.07 |
|
cullin-associated NEDD8-dissociated protein 1 |
| 254692880 |
|
Cand2 |
|
0 |
27 |
195 |
2971 |
857 |
|
n.v. |
-0.57 |
0.6 |
0.1 |
-0.16 |
|
cullin-associated NEDD8-dissociated protein 2 |
| 160333216;6671664 |
|
Canx |
|
483608 |
0 |
0 |
0 |
0 |
|
0.04 |
n.v. |
n.v. |
n.v. |
n.v. |
|
calnexin precursor |
| 6671664 |
|
Canx |
|
0 |
19001 |
40784 |
13768 |
0 |
|
n.v. |
-0.22 |
-0.32 |
-0.25 |
n.v. |
|
calnexin precursor |
| 157951604 |
|
Cap1 |
|
6810 |
17128 |
47518 |
161125 |
113007 |
|
0.57 |
0.21 |
0.07 |
0.11 |
0.01 |
|
adenylyl cyclase-associated protein 1 |
| 110227379 |
|
Capg |
|
86185 |
15556 |
67232 |
41624 |
346195 |
|
0.06 |
0.14 |
-0.03 |
0.12 |
0.08 |
|
macrophage-capping protein |
| 6671668 |
|
Capn1 |
|
9061 |
35841 |
86727 |
197493 |
124155 |
|
0.01 |
0.09 |
-0.05 |
0.05 |
0.06 |
|
calpain-1 catalytic subunit |
| 7657601 |
|
Capn15 |
|
0 |
0 |
0 |
0 |
1124 |
|
n.v. |
n.v. |
n.v. |
n.v. |
0.06 |
|
calpain-15 |
| 157951598 |
|
Capn2 |
|
0 |
9697 |
14938 |
25629 |
66720 |
|
n.v. |
0.24 |
0.05 |
0.26 |
0.12 |
|
calpain-2 catalytic subunit |
| 6680846 |
|
Capn5 |
|
769 |
11671 |
13069 |
786 |
0 |
|
0.12 |
-0.15 |
-0.29 |
-0.61 |
n.v. |
|
calpain-5 |
| 224809586 |
|
Capn8 |
|
0 |
0 |
0 |
0 |
9124 |
|
n.v. |
n.v. |
n.v. |
n.v. |
0.09 |
|
calpain-8 isoform 1 |
| 110227381 |
|
Capns1 |
|
1263 |
8448 |
29888 |
32980 |
113189 |
|
0.08 |
0.11 |
0.03 |
0.12 |
-0.02 |
|
calpain small subunit 1 |
| 254675215 |
|
Capns2 |
|
0 |
1918 |
6087 |
5975 |
51074 |
|
n.v. |
0.01 |
0.01 |
0.18 |
0.13 |
|
calpain small subunit 2 |
| 162329564;42558248 |
|
Caprin1 |
|
64144 |
0 |
236282 |
0 |
0 |
|
-0.1 |
n.v. |
0.15 |
n.v. |
n.v. |
|
caprin-1 isoform a |
| 42558248 |
|
Caprin1 |
|
0 |
4517 |
0 |
86300 |
3031 |
|
n.v. |
0.39 |
n.v. |
-0.06 |
-0.52 |
|
caprin-1 isoform a |
| 162329566 |
|
Caprin1 |
|
64144 |
4517 |
236282 |
86300 |
3031 |
|
-0.1 |
0.39 |
0.15 |
-0.06 |
-0.52 |
|
caprin-1 isoform b |
| 162329568 |
|
Caprin1 |
|
64144 |
4517 |
236282 |
86300 |
3031 |
|
-0.1 |
0.39 |
0.15 |
-0.06 |
-0.52 |
|
caprin-1 isoform c |
| 161086971 |
|
Capza1 |
|
34305 |
18088 |
22472 |
68186 |
42602 |
|
0.09 |
0.13 |
0.03 |
0.08 |
0.12 |
|
F-actin-capping protein subunit alpha-1 |
| 6671672 |
|
Capza2 |
|
30901 |
16949 |
16833 |
49572 |
90667 |
|
0.02 |
0.16 |
0.01 |
0.07 |
0.03 |
|
F-actin-capping protein subunit alpha-2 |
| 157951670 |
|
Capza3 |
|
0 |
0 |
249 |
0 |
0 |
|
n.v. |
n.v. |
-0.48 |
n.v. |
n.v. |
|
F-actin-capping protein subunit alpha-3 |
| 407027854 |
|
Capzb |
|
17647 |
32832 |
26934 |
167444 |
122731 |
|
0.27 |
0.07 |
-0.02 |
0.01 |
-0.01 |
|
F-actin-capping protein subunit beta isoform d |
| 407027856 |
|
Capzb |
|
17647 |
32832 |
26934 |
167444 |
122731 |
|
0.27 |
0.07 |
-0.02 |
0.01 |
-0.01 |
|
F-actin-capping protein subunit beta isoform c |
| 6753262 |
|
Capzb |
|
17647 |
32832 |
26934 |
167444 |
122731 |
|
0.27 |
0.07 |
-0.02 |
0.01 |
-0.01 |
|
F-actin-capping protein subunit beta isoform b |
| 83649737 |
|
Capzb |
|
17647 |
32471 |
26586 |
156885 |
112696 |
|
0.27 |
0.07 |
-0.02 |
0 |
-0.02 |
|
F-actin-capping protein subunit beta isoform a |
| 157951596 |
|
Car2 |
|
1501 |
3069 |
9763 |
8325 |
137349 |
|
0.1 |
0.2 |
0.09 |
0.16 |
0.08 |
|
carbonic anhydrase 2 |
| 211057396 |
|
Car5b |
|
10196 |
524 |
0 |
0 |
0 |
|
0.18 |
0.08 |
n.v. |
n.v. |
n.v. |
|
carbonic anhydrase 5B, mitochondrial precursor |
| 13385290 |
|
Carhsp1 |
|
0 |
27 |
59 |
0 |
6329 |
|
n.v. |
0.41 |
0.28 |
n.v. |
-0.02 |
|
calcium-regulated heat stable protein 1 |
| 298676450 |
|
Carkd |
|
0 |
7795 |
260 |
1563 |
13954 |
|
n.v. |
-0.13 |
-0.05 |
0.54 |
0.1 |
|
ATP-dependent (S)-NAD(P)H-hydrate dehydratase isoform
1 |
| 298676452 |
|
Carkd |
|
0 |
7795 |
260 |
1563 |
13954 |
|
n.v. |
-0.13 |
-0.05 |
0.54 |
0.1 |
|
ATP-dependent (S)-NAD(P)H-hydrate dehydratase isoform
2 |
| 189409145 |
|
Carm1 |
|
0 |
0 |
0 |
2415 |
1403 |
|
n.v. |
n.v. |
n.v. |
0.07 |
0.01 |
|
histone-arginine methyltransferase CARM1 isoform 2 |
| 50511310 |
|
Carm1 |
|
0 |
0 |
0 |
2415 |
1403 |
|
n.v. |
n.v. |
n.v. |
0.07 |
0.01 |
|
histone-arginine methyltransferase CARM1 isoform 1 |
| 148747198 |
|
Cars |
|
0 |
15 |
468 |
20423 |
19845 |
|
n.v. |
-0.2 |
-0.02 |
-0.02 |
-0.04 |
|
cysteine--tRNA ligase, cytoplasmic isoform 1 |
| 357588502 |
|
Cars |
|
0 |
15 |
468 |
20423 |
19845 |
|
n.v. |
-0.2 |
-0.02 |
-0.02 |
-0.04 |
|
cysteine--tRNA ligase, cytoplasmic isoform 2 |
| 282721112 |
|
Casc1 |
|
0 |
0 |
697 |
1555 |
0 |
|
n.v. |
n.v. |
0.07 |
0.32 |
n.v. |
|
cancer susceptibility candidate protein 1 |
| 133504495 |
|
Cask |
|
0 |
848 |
10296 |
0 |
0 |
|
n.v. |
0.1 |
-0.01 |
n.v. |
n.v. |
|
peripheral plasma membrane protein CASK |
| 31981530 |
|
Caskin2 |
|
0 |
0 |
1 |
0 |
0 |
|
n.v. |
n.v. |
1.63 |
n.v. |
n.v. |
|
caskin-2 |
| 6753280 |
|
Casp14 |
|
0 |
35 |
42 |
0 |
5387 |
|
n.v. |
0.31 |
0.35 |
n.v. |
0.24 |
|
caspase-14 |
| 6680848 |
|
Casp2 |
|
0 |
0 |
85 |
0 |
2335 |
|
n.v. |
n.v. |
0.09 |
n.v. |
0.49 |
|
caspase-2 |
| 6753284 |
|
Casp3 |
|
0 |
3933 |
3983 |
7588 |
61344 |
|
n.v. |
0.19 |
0.03 |
0.14 |
0.13 |
|
caspase-3 |
| 157951736 |
|
Casp6 |
|
146 |
2415 |
1436 |
2570 |
17274 |
|
0.32 |
0.26 |
-0.1 |
0.27 |
0.08 |
|
caspase-6 |
| 6680850 |
|
Casp7 |
|
0 |
367 |
366 |
1449 |
6961 |
|
n.v. |
0.11 |
0.13 |
0.13 |
0.03 |
|
caspase-7 precursor |
| 33859520 |
|
Casp8 |
|
0 |
2699 |
6304 |
0 |
73606 |
|
n.v. |
0.24 |
0.61 |
n.v. |
-0.36 |
|
caspase-8 |
| 31560479 |
|
Casp9 |
|
0 |
0 |
0 |
0 |
3984 |
|
n.v. |
n.v. |
n.v. |
n.v. |
0.19 |
|
caspase-9 |
| 33563246 |
|
Cast |
|
0 |
0 |
63 |
2014 |
3930 |
|
n.v. |
n.v. |
0.81 |
0.25 |
0.33 |
|
calpastatin |
| 157951741 |
|
Cat |
|
35990 |
11066 |
44909 |
3675 |
5558 |
|
-0.08 |
-0.11 |
-0.23 |
-0.15 |
-0.13 |
|
catalase |
| 340139110 |
|
Cav1 |
|
0 |
0 |
9 |
0 |
0 |
|
n.v. |
n.v. |
0.21 |
n.v. |
n.v. |
|
caveolin-1 isoform 2 |
| 6680854 |
|
Cav1 |
|
0 |
42 |
9 |
0 |
0 |
|
n.v. |
-0.81 |
0.21 |
n.v. |
n.v. |
|
caveolin-1 isoform 1 |
| 18702317 |
|
Cav2 |
|
0 |
48 |
0 |
0 |
0 |
|
n.v. |
-0.36 |
n.v. |
n.v. |
n.v. |
|
caveolin-2 |
| 238814335 |
|
Cbfb |
|
0 |
0 |
0 |
0 |
10581 |
|
n.v. |
n.v. |
n.v. |
n.v. |
0.19 |
|
core-binding factor subunit beta isoform 3 |
| 238814331 |
|
Cbfb |
|
0 |
585 |
361 |
0 |
20798 |
|
n.v. |
0.17 |
0.19 |
n.v. |
0.09 |
|
core-binding factor subunit beta isoform 1 |
| 238814333 |
|
Cbfb |
|
0 |
585 |
361 |
0 |
20798 |
|
n.v. |
0.17 |
0.19 |
n.v. |
0.09 |
|
core-binding factor subunit beta isoform 2 |
| 238814337 |
|
Cbfb |
|
0 |
585 |
435 |
0 |
11877 |
|
n.v. |
0.17 |
0.12 |
n.v. |
0.04 |
|
core-binding factor subunit beta isoform 4 |
| 80978932 |
|
Cbl |
|
0 |
0 |
0 |
0 |
3813 |
|
n.v. |
n.v. |
n.v. |
n.v. |
0.15 |
|
E3 ubiquitin-protein ligase CBL |
| 113680352 |
|
Cbr1 |
|
0 |
5087 |
3129 |
9905 |
111904 |
|
n.v. |
-0.01 |
0.09 |
0.14 |
0.05 |
|
carbonyl reductase [NADPH] 1 |
| 6671688 |
|
Cbr2 |
|
43147 |
21301 |
1013 |
0 |
4841 |
|
0.12 |
0.13 |
-0.55 |
n.v. |
-0.35 |
|
carbonyl reductase [NADPH] 2 |
| 27413160 |
|
Cbr3 |
|
0 |
797 |
1409 |
0 |
37312 |
|
n.v. |
0.08 |
0.17 |
n.v. |
0.03 |
|
carbonyl reductase [NADPH] 3 |
| 269784762 |
|
Cbr4 |
|
3094 |
11095 |
0 |
0 |
0 |
|
-0.16 |
-0.06 |
n.v. |
n.v. |
n.v. |
|
carbonyl reductase family member 4 |
| 22122605 |
|
Cbwd1 |
|
0 |
553 |
413 |
0 |
32739 |
|
n.v. |
0.14 |
-0.04 |
n.v. |
0.13 |
|
COBW domain-containing protein 1 |
| 6671696 |
|
Cbx1 |
|
13675 |
562 |
798 |
1310 |
14576 |
|
0.03 |
-0.05 |
-0.14 |
-0.2 |
-0.08 |
|
chromobox protein homolog 1 |
| 108860695 |
|
Cbx3 |
|
149908 |
5235 |
2038 |
6769 |
36209 |
|
0.02 |
-0.1 |
-0.02 |
-0.4 |
-0.05 |
|
chromobox protein homolog 3 |
| 116008461 |
|
Cbx5 |
|
50177 |
0 |
22 |
0 |
3577 |
|
-0.09 |
n.v. |
0.01 |
n.v. |
0.19 |
|
chromobox protein homolog 5 |
| 61657984 |
|
Cbx6 |
|
0 |
0 |
0 |
671 |
11 |
|
n.v. |
n.v. |
n.v. |
-0.18 |
-0.97 |
|
chromobox protein homolog 6 |
| 110835702 |
|
Cc2d1a |
|
0 |
0 |
37 |
0 |
0 |
|
n.v. |
n.v. |
-0.06 |
n.v. |
n.v. |
|
coiled-coil and C2 domain-containing protein 1A |
| 28892935 |
|
Cc2d1b |
|
0 |
0 |
778 |
0 |
12166 |
|
n.v. |
n.v. |
0.03 |
n.v. |
0.13 |
|
coiled-coil and C2 domain-containing protein 1B |
| 407262408 |
|
Cc2d2b |
|
0 |
0 |
326 |
0 |
0 |
|
n.v. |
n.v. |
-0.01 |
n.v. |
n.v. |
|
PREDICTED: coiled-coil and C2 domain-containing protein
2A |
| 407264268 |
|
Cc2d2b |
|
0 |
0 |
326 |
0 |
0 |
|
n.v. |
n.v. |
-0.01 |
n.v. |
n.v. |
|
PREDICTED: coiled-coil and C2 domain-containing protein
2A |
| 33563288 |
|
Ccar1 |
|
9757 |
0 |
16 |
2398 |
0 |
|
0.26 |
n.v. |
0.26 |
0.36 |
n.v. |
|
cell division cycle and apoptosis regulator protein 1 |
| 226958577 |
|
Ccar2 |
|
12265 |
1799 |
13686 |
67932 |
22908 |
|
-0.1 |
0.28 |
-0.07 |
0 |
-0.13 |
|
DBIRD complex subunit KIAA1967 homolog |
| 31982063 |
|
Ccbl1 |
|
0 |
0 |
174 |
0 |
11020 |
|
n.v. |
n.v. |
0.11 |
n.v. |
0.16 |
|
kynurenine--oxoglutarate transaminase 1 |
| 30352008 |
|
Ccdc104 |
|
0 |
0 |
0 |
0 |
1028 |
|
n.v. |
n.v. |
n.v. |
n.v. |
0.3 |
|
coiled-coil domain-containing protein 104 |
| 58037169 |
|
Ccdc115 |
|
0 |
831 |
67 |
0 |
5612 |
|
n.v. |
-0.33 |
-0.44 |
n.v. |
-0.05 |
|
coiled-coil domain-containing protein 115 |
| 164698436 |
|
Ccdc117 |
|
0 |
0 |
0 |
0 |
1756 |
|
n.v. |
n.v. |
n.v. |
n.v. |
0 |
|
coiled-coil domain-containing protein 117 |
| 227496903 |
|
Ccdc12 |
|
0 |
0 |
0 |
0 |
3705 |
|
n.v. |
n.v. |
n.v. |
n.v. |
0.01 |
|
coiled-coil domain-containing protein 12 |
| 47059143 |
|
Ccdc124 |
|
0 |
0 |
42 |
2652 |
0 |
|
n.v. |
n.v. |
-0.16 |
0.14 |
n.v. |
|
coiled-coil domain-containing protein 124 |
| 13195630 |
|
Ccdc127 |
|
0 |
395 |
0 |
0 |
0 |
|
n.v. |
-0.3 |
n.v. |
n.v. |
n.v. |
|
coiled-coil domain-containing protein 127 isoform 1 |
| 281183266 |
|
Ccdc127 |
|
0 |
395 |
0 |
0 |
0 |
|
n.v. |
-0.3 |
n.v. |
n.v. |
n.v. |
|
coiled-coil domain-containing protein 127 isoform 2 |
| 268370057 |
|
Ccdc132 |
|
0 |
0 |
878 |
40559 |
8182 |
|
n.v. |
n.v. |
0.04 |
0.09 |
0.29 |
|
coiled-coil domain-containing protein 132 isoform 1 |
| 268370059 |
|
Ccdc132 |
|
0 |
0 |
878 |
40559 |
8182 |
|
n.v. |
n.v. |
0.04 |
0.09 |
0.29 |
|
coiled-coil domain-containing protein 132 isoform 2 |
| 268370061 |
|
Ccdc132 |
|
0 |
0 |
878 |
40559 |
8182 |
|
n.v. |
n.v. |
0.04 |
0.09 |
0.29 |
|
coiled-coil domain-containing protein 132 isoform 3 |
| 116268089 |
|
Ccdc134 |
|
0 |
372 |
0 |
0 |
0 |
|
n.v. |
0.07 |
n.v. |
n.v. |
n.v. |
|
coiled-coil domain-containing protein 134 precursor |
| 319655563 |
|
Ccdc136 |
|
0 |
0 |
16 |
0 |
0 |
|
n.v. |
n.v. |
-0.25 |
n.v. |
n.v. |
|
coiled-coil domain-containing protein 136 isoform 2 |
| 319655703 |
|
Ccdc136 |
|
0 |
0 |
16 |
0 |
0 |
|
n.v. |
n.v. |
-0.25 |
n.v. |
n.v. |
|
coiled-coil domain-containing protein 136 isoform 1 |
| 22779893 |
|
Ccdc137 |
|
0 |
0 |
0 |
65 |
0 |
|
n.v. |
n.v. |
n.v. |
-0.57 |
n.v. |
|
coiled-coil domain-containing protein 137 |
| 169646270 |
|
Ccdc14 |
|
0 |
0 |
6 |
0 |
0 |
|
n.v. |
n.v. |
0.45 |
n.v. |
n.v. |
|
coiled-coil domain-containing protein 14 |
| 299829227 |
|
Ccdc141 |
|
0 |
0 |
1 |
0 |
0 |
|
n.v. |
n.v. |
5.01 |
n.v. |
n.v. |
|
coiled-coil domain containing 141 |
| 254939555 |
|
Ccdc167 |
|
256 |
735 |
61 |
0 |
0 |
|
0.49 |
-0.08 |
-0.18 |
n.v. |
n.v. |
|
coiled-coil domain-containing protein 167 isoform 1 |
| 254939557 |
|
Ccdc167 |
|
256 |
735 |
61 |
0 |
0 |
|
0.49 |
-0.08 |
-0.18 |
n.v. |
n.v. |
|
coiled-coil domain-containing protein 167 isoform 2 |
| 133922578 |
|
Ccdc22 |
|
0 |
125 |
3821 |
22011 |
4284 |
|
n.v. |
-0.38 |
-0.26 |
0.19 |
0.09 |
|
coiled-coil domain-containing protein 22 |
| 22164768 |
|
Ccdc25 |
|
0 |
69 |
487 |
3078 |
9424 |
|
n.v. |
0.69 |
0.05 |
-0.24 |
0.17 |
|
coiled-coil domain-containing protein 25 |
| 13385406 |
|
Ccdc43 |
|
0 |
27 |
0 |
8 |
4509 |
|
n.v. |
0.39 |
n.v. |
-0.42 |
-0.09 |
|
coiled-coil domain-containing protein 43 |
| 125628650 |
|
Ccdc47 |
|
10270 |
6496 |
7917 |
0 |
0 |
|
0.02 |
-0.28 |
-0.23 |
n.v. |
n.v. |
|
coiled-coil domain-containing protein 47 precursor |
| 258679490 |
|
Ccdc51 |
|
0 |
8 |
0 |
0 |
0 |
|
n.v. |
-0.75 |
n.v. |
n.v. |
n.v. |
|
coiled-coil domain-containing protein 51 |
| 171906601 |
|
Ccdc53 |
|
0 |
0 |
59 |
164 |
0 |
|
n.v. |
n.v. |
-0.59 |
0.38 |
n.v. |
|
WASH complex subunit CCDC53 isoform 3 |
| 171906604 |
|
Ccdc53 |
|
0 |
0 |
231 |
1097 |
0 |
|
n.v. |
n.v. |
0.12 |
0.15 |
n.v. |
|
WASH complex subunit CCDC53 isoform 2 |
| 21313034 |
|
Ccdc53 |
|
0 |
0 |
231 |
1097 |
0 |
|
n.v. |
n.v. |
0.12 |
0.15 |
n.v. |
|
WASH complex subunit CCDC53 isoform 1 |
| 21312272 |
|
Ccdc54 |
|
73 |
0 |
0 |
0 |
0 |
|
-0.15 |
n.v. |
n.v. |
n.v. |
n.v. |
|
coiled-coil domain-containing protein 54 |
| 59858549 |
|
Ccdc55 |
|
0 |
88 |
0 |
0 |
0 |
|
n.v. |
0.11 |
n.v. |
n.v. |
n.v. |
|
nuclear speckle splicing regulatory protein 1 |
| 226874938 |
|
Ccdc58 |
|
10544 |
852 |
426 |
0 |
1842 |
|
-0.03 |
-0.23 |
-0.45 |
n.v. |
-0.26 |
|
coiled-coil domain-containing protein 58 isoform 2 |
| 226874940 |
|
Ccdc58 |
|
10544 |
2021 |
426 |
0 |
2142 |
|
-0.03 |
-0.28 |
-0.45 |
n.v. |
-0.26 |
|
coiled-coil domain-containing protein 58 isoform 3 |
| 38348528 |
|
Ccdc58 |
|
10544 |
2021 |
426 |
0 |
2142 |
|
-0.03 |
-0.28 |
-0.45 |
n.v. |
-0.26 |
|
coiled-coil domain-containing protein 58 isoform 1 |
| 13385058 |
|
Ccdc59 |
|
0 |
0 |
0 |
933 |
0 |
|
n.v. |
n.v. |
n.v. |
0.59 |
n.v. |
|
thyroid transcription factor 1-associated protein 26 |
| 162135971 |
|
Ccdc6 |
|
0 |
79 |
161 |
0 |
9360 |
|
n.v. |
0.63 |
0.07 |
n.v. |
0.16 |
|
coiled-coil domain-containing protein 6 |
| 115270981 |
|
Ccdc69 |
|
0 |
0 |
41 |
0 |
0 |
|
n.v. |
n.v. |
-0.06 |
n.v. |
n.v. |
|
coiled-coil domain-containing protein 69 |
| 47059089 |
|
Ccdc88c |
|
0 |
0 |
80 |
0 |
1874 |
|
n.v. |
n.v. |
0.21 |
n.v. |
0.07 |
|
protein Daple |
| 160333440 |
|
Ccdc93 |
|
0 |
296 |
4129 |
33430 |
1339 |
|
n.v. |
-0.03 |
-0.32 |
0.2 |
-0.08 |
|
coiled-coil domain-containing protein 93 isoform c |
| 68448542 |
|
Ccdc93 |
|
0 |
296 |
4129 |
33430 |
1339 |
|
n.v. |
-0.03 |
-0.32 |
0.2 |
-0.08 |
|
coiled-coil domain-containing protein 93 isoform a |
| 157738617 |
|
Cchcr1 |
|
0 |
0 |
1258 |
0 |
0 |
|
n.v. |
n.v. |
0.11 |
n.v. |
n.v. |
|
coiled-coil alpha-helical rod protein 1 |
| 12963599 |
|
Ccnh |
|
0 |
119 |
0 |
0 |
0 |
|
n.v. |
0.32 |
n.v. |
n.v. |
n.v. |
|
cyclin-H |
| 157841168 |
|
Ccnk |
|
714 |
0 |
6 |
0 |
0 |
|
-1.84 |
n.v. |
-0.09 |
n.v. |
n.v. |
|
cyclin-K |
| 70906460 |
|
Ccnl1 |
|
0 |
205 |
1 |
0 |
0 |
|
n.v. |
0.03 |
-0.32 |
n.v. |
n.v. |
|
cyclin-L1 |
| 6753316 |
|
Ccnt1 |
|
0 |
0 |
301 |
0 |
0 |
|
n.v. |
n.v. |
-0.15 |
n.v. |
n.v. |
|
cyclin-T1 |
| 31542003 |
|
Ccny |
|
0 |
0 |
154 |
0 |
0 |
|
n.v. |
n.v. |
-0.16 |
n.v. |
n.v. |
|
cyclin-Y |
| 148237243 |
|
Ccnyl1 |
|
0 |
0 |
28 |
0 |
0 |
|
n.v. |
n.v. |
-0.12 |
n.v. |
n.v. |
|
cyclin Y-like 1 |
| 8393066 |
|
Ccs |
|
0 |
56 |
208 |
0 |
26292 |
|
n.v. |
0.59 |
0.02 |
n.v. |
0.15 |
|
copper chaperone for superoxide dismutase |
| 126521835 |
|
Cct2 |
|
79411 |
56526 |
64761 |
426435 |
61580 |
|
0.01 |
0.11 |
0.01 |
0 |
0.02 |
|
T-complex protein 1 subunit beta |
| 6753320 |
|
Cct3 |
|
119831 |
32766 |
88516 |
1352582 |
63454 |
|
0.1 |
0.14 |
0.01 |
0 |
-0.02 |
|
T-complex protein 1 subunit gamma |
| 6753322 |
|
Cct4 |
|
69490 |
5960 |
95505 |
722294 |
70833 |
|
-0.1 |
0.21 |
-0.03 |
-0.01 |
-0.12 |
|
T-complex protein 1 subunit delta |
| 6671702 |
|
Cct5 |
|
60575 |
12227 |
61846 |
982562 |
8461 |
|
0.07 |
0.15 |
0.02 |
0.04 |
0 |
|
T-complex protein 1 subunit epsilon |
| 6753324 |
|
Cct6a |
|
17830 |
15387 |
54299 |
885326 |
37451 |
|
0.04 |
0.07 |
-0.01 |
0 |
0.07 |
|
T-complex protein 1 subunit zeta |
| 226693361 |
|
Cct6b |
|
0 |
4346 |
15423 |
85826 |
14501 |
|
n.v. |
-0.17 |
-0.02 |
0.06 |
-0.14 |
|
T-complex protein 1 subunit zeta-2 |
| 238814391 |
|
Cct7 |
|
51769 |
3553 |
45167 |
811533 |
41071 |
|
0.03 |
0.29 |
-0.02 |
0.03 |
-0.12 |
|
T-complex protein 1 subunit eta |
| 126723461 |
|
Cct8 |
|
35825 |
22194 |
115150 |
2092394 |
66817 |
|
0.1 |
0.11 |
-0.01 |
0 |
-0.11 |
|
T-complex protein 1 subunit theta |
| 29244114 |
|
Ccz1 |
|
0 |
770 |
246 |
0 |
0 |
|
n.v. |
-1.25 |
0.15 |
n.v. |
n.v. |
|
vacuolar fusion protein CCZ1 homolog |
| 6753332 |
|
Cd14 |
|
0 |
0 |
16 |
0 |
0 |
|
n.v. |
n.v. |
-0.01 |
n.v. |
n.v. |
|
monocyte differentiation antigen CD14 precursor |
| 161353452 |
|
Cd151 |
|
1428 |
56 |
1178 |
172 |
0 |
|
-0.38 |
0.01 |
-0.07 |
-0.34 |
n.v. |
|
CD151 antigen |
| 125987599 |
|
Cd2ap |
|
0 |
3647 |
7375 |
35804 |
57253 |
|
n.v. |
0.15 |
0.14 |
0.24 |
-0.1 |
|
CD2-associated protein |
| 17505208 |
|
Cd2bp2 |
|
0 |
0 |
539 |
663 |
0 |
|
n.v. |
n.v. |
-0.32 |
0.08 |
n.v. |
|
CD2 antigen cytoplasmic tail-binding protein 2 |
| 295293144 |
|
Cd44 |
|
0 |
228 |
72 |
0 |
0 |
|
n.v. |
-0.42 |
-0.1 |
n.v. |
n.v. |
|
CD44 antigen isoform d precursor |
| 295293146 |
|
Cd44 |
|
0 |
228 |
72 |
0 |
0 |
|
n.v. |
-0.42 |
-0.1 |
n.v. |
n.v. |
|
CD44 antigen isoform e precursor |
| 295293148 |
|
Cd44 |
|
0 |
228 |
72 |
0 |
0 |
|
n.v. |
-0.42 |
-0.1 |
n.v. |
n.v. |
|
CD44 antigen isoform f precursor |
| 85540466 |
|
Cd44 |
|
0 |
228 |
72 |
0 |
0 |
|
n.v. |
-0.42 |
-0.1 |
n.v. |
n.v. |
|
CD44 antigen isoform b precursor |
| 85540468 |
|
Cd44 |
|
0 |
228 |
72 |
0 |
0 |
|
n.v. |
-0.42 |
-0.1 |
n.v. |
n.v. |
|
CD44 antigen isoform c precursor |
| 85540471 |
|
Cd44 |
|
0 |
228 |
72 |
0 |
0 |
|
n.v. |
-0.42 |
-0.1 |
n.v. |
n.v. |
|
CD44 antigen isoform a precursor |
| 6754382 |
|
Cd47 |
|
0 |
5300 |
11276 |
417 |
0 |
|
n.v. |
-0.16 |
-0.09 |
-0.27 |
n.v. |
|
leukocyte surface antigen CD47 precursor |
| 6671714 |
|
Cd59a |
|
0 |
84 |
0 |
0 |
0 |
|
n.v. |
-0.36 |
n.v. |
n.v. |
n.v. |
|
CD59A glycoprotein precursor |
| 6680888 |
|
Cd63 |
|
25409 |
35498 |
56674 |
45635 |
0 |
|
-0.08 |
-0.18 |
-0.24 |
-0.36 |
n.v. |
|
CD63 antigen |
| 19526794 |
|
Cd81 |
|
0 |
38 |
75 |
688 |
0 |
|
n.v. |
0.35 |
-0.12 |
-0.06 |
n.v. |
|
CD81 antigen |
| 6671718 |
|
Cd82 |
|
16494 |
21677 |
48490 |
5345 |
0 |
|
-0.22 |
-0.19 |
-0.1 |
-0.36 |
n.v. |
|
CD82 antigen |
| 6680894 |
|
Cd9 |
|
0 |
0 |
4220 |
368 |
0 |
|
n.v. |
n.v. |
0.04 |
0.16 |
n.v. |
|
CD9 antigen |
| 58037289 |
|
Cda |
|
0 |
33 |
0 |
115 |
2924 |
|
n.v. |
2.02 |
n.v. |
0.22 |
-0.08 |
|
cytidine deaminase |
| 19527052 |
|
Cdc123 |
|
0 |
0 |
0 |
0 |
8032 |
|
n.v. |
n.v. |
n.v. |
n.v. |
0.31 |
|
cell division cycle protein 123 homolog |
| 68448515 |
|
Cdc16 |
|
0 |
0 |
0 |
4273 |
2249 |
|
n.v. |
n.v. |
n.v. |
-0.03 |
-0.17 |
|
cell division cycle protein 16 homolog |
| 30387632 |
|
Cdc23 |
|
0 |
0 |
67 |
15430 |
0 |
|
n.v. |
n.v. |
0.28 |
-0.01 |
n.v. |
|
cell division cycle protein 23 homolog |
| 12963487 |
|
Cdc25b |
|
0 |
2 |
0 |
0 |
493 |
|
n.v. |
-0.36 |
n.v. |
n.v. |
0.06 |
|
M-phase inducer phosphatase 2 isoform a |
| 161621261 |
|
Cdc25b |
|
0 |
2 |
0 |
0 |
493 |
|
n.v. |
-0.36 |
n.v. |
n.v. |
0.06 |
|
M-phase inducer phosphatase 2 isoform b |
| 21314828 |
|
Cdc26 |
|
0 |
0 |
0 |
49 |
1317 |
|
n.v. |
n.v. |
n.v. |
-0.57 |
-0.26 |
|
anaphase-promoting complex subunit CDC26 |
| 29243988 |
|
Cdc34 |
|
0 |
0 |
0 |
0 |
5387 |
|
n.v. |
n.v. |
n.v. |
n.v. |
0.07 |
|
ubiquitin-conjugating enzyme E2 R1 |
| 7949018 |
|
Cdc37 |
|
3991 |
6590 |
12687 |
112142 |
92295 |
|
-0.16 |
0.15 |
-0.03 |
0.1 |
0.06 |
|
hsp90 co-chaperone Cdc37 |
| 198278501 |
|
Cdc40 |
|
0 |
0 |
47 |
0 |
0 |
|
n.v. |
n.v. |
1.04 |
n.v. |
n.v. |
|
pre-mRNA-processing factor 17 |
| 344313177 |
|
Cdc42 |
|
1300 |
13103 |
31356 |
31523 |
12273 |
|
0.21 |
0.09 |
-0.08 |
-0.03 |
-0.11 |
|
cell division control protein 42 homolog isoform 2 |
| 6753364 |
|
Cdc42 |
|
55083 |
13237 |
69307 |
45798 |
32600 |
|
0.15 |
0.14 |
-0.04 |
0.02 |
0.02 |
|
cell division control protein 42 homolog isoform 1
precursor |
| 254692972 |
|
Cdc42bpa |
|
0 |
816 |
3569 |
0 |
3481 |
|
n.v. |
0.03 |
0.06 |
n.v. |
-0.68 |
|
serine/threonine-protein kinase MRCK alpha |
| 283135190 |
|
Cdc42bpb |
|
3405 |
19034 |
36489 |
44300 |
49885 |
|
0.44 |
0.17 |
0.08 |
0.09 |
-0.15 |
|
serine/threonine-protein kinase MRCK beta |
| 254675191 |
|
Cdc42bpg |
|
0 |
0 |
130 |
1302 |
8750 |
|
n.v. |
n.v. |
0.16 |
-0.05 |
-0.47 |
|
serine/threonine-protein kinase MRCK gamma |
| 9910142 |
|
Cdc42ep4 |
|
0 |
52 |
98 |
417 |
0 |
|
n.v. |
0.42 |
0.24 |
-0.03 |
n.v. |
|
cdc42 effector protein 4 |
| 10946838 |
|
Cdc42ep5 |
|
0 |
0 |
0 |
0 |
161 |
|
n.v. |
n.v. |
n.v. |
n.v. |
0.04 |
|
cdc42 effector protein 5 |
| 84781706 |
|
Cdc42se1 |
|
0 |
38 |
45 |
0 |
0 |
|
n.v. |
0.01 |
0.1 |
n.v. |
n.v. |
|
CDC42 small effector protein 1 isoform 2 |
| 22779899 |
|
Cdc5l |
|
25464 |
0 |
1402 |
761 |
0 |
|
-0.05 |
n.v. |
0.12 |
0.32 |
n.v. |
|
cell division cycle 5-like protein |
| 22122445 |
|
Cdc73 |
|
1190 |
146 |
32 |
82 |
0 |
|
-0.23 |
0.06 |
0.26 |
-0.32 |
n.v. |
|
parafibromin |
| 61098143 |
|
Cdcp1 |
|
0 |
10 |
190 |
0 |
0 |
|
n.v. |
0.12 |
-0.15 |
n.v. |
n.v. |
|
CUB domain-containing protein 1 precursor |
| 6753374 |
|
Cdh1 |
|
39614 |
7131 |
15624 |
2235 |
5569 |
|
0.39 |
0.05 |
-0.03 |
-0.08 |
-0.96 |
|
cadherin-1 precursor |
| 357933652 |
|
Cdh16 |
|
126769 |
15834 |
55894 |
2186 |
0 |
|
0.1 |
-0.01 |
-0.04 |
-0.29 |
n.v. |
|
cadherin-16 isoform 2 precursor |
| 357933654 |
|
Cdh16 |
|
116829 |
10218 |
31268 |
1727 |
0 |
|
0.09 |
0.05 |
-0.04 |
0.36 |
n.v. |
|
cadherin-16 isoform 3 precursor |
| 6680900 |
|
Cdh16 |
|
126769 |
15834 |
58214 |
2186 |
0 |
|
0.1 |
-0.01 |
-0.03 |
-0.29 |
n.v. |
|
cadherin-16 isoform 1 precursor |
| 124517680 |
|
Cdh23 |
|
0 |
0 |
1125 |
0 |
0 |
|
n.v. |
n.v. |
-0.06 |
n.v. |
n.v. |
|
cadherin-23 isoform 1 precursor |
| 358001060 |
|
Cdh23 |
|
0 |
0 |
1125 |
0 |
0 |
|
n.v. |
n.v. |
-0.06 |
n.v. |
n.v. |
|
cadherin-23 isoform 2 precursor |
| 45496816 |
|
Cdh3 |
|
0 |
123 |
1803 |
0 |
0 |
|
n.v. |
-0.66 |
-0.12 |
n.v. |
n.v. |
|
cadherin-3 isoform b precursor |
| 83715978 |
|
Cdh3 |
|
0 |
123 |
1803 |
0 |
0 |
|
n.v. |
-0.66 |
-0.12 |
n.v. |
n.v. |
|
cadherin-3 isoform a precursor |
| 28076897 |
|
Cdipt |
|
27313 |
3064 |
5167 |
1269 |
0 |
|
0.02 |
-0.27 |
-0.34 |
-0.59 |
n.v. |
|
CDP-diacylglycerol--inositol 3-phosphatidyltransferase |
| 31542366 |
|
Cdk1 |
|
2215 |
13928 |
12497 |
43555 |
130238 |
|
-0.94 |
0.21 |
-0.05 |
0.03 |
0.08 |
|
cyclin-dependent kinase 1 |
| 33695123 |
|
Cdk11b |
|
0 |
2269 |
585 |
0 |
1960 |
|
n.v. |
-0.03 |
-0.2 |
n.v. |
-0.55 |
|
cyclin-dependent kinase 11B |
| 157816935 |
|
Cdk12 |
|
0 |
2261 |
3440 |
4330 |
34420 |
|
n.v. |
0.15 |
-0.03 |
0.42 |
0.29 |
|
cyclin-dependent kinase 12 isoform 1 |
| 157816961 |
|
Cdk12 |
|
0 |
2261 |
3440 |
4330 |
34420 |
|
n.v. |
0.15 |
-0.03 |
0.42 |
0.29 |
|
cyclin-dependent kinase 12 isoform 2 |
| 157824204 |
|
Cdk12 |
|
0 |
2261 |
3440 |
4330 |
34420 |
|
n.v. |
0.15 |
-0.03 |
0.42 |
0.29 |
|
cyclin-dependent kinase 12 isoform 3 |
| 124486698 |
|
Cdk13 |
|
0 |
2261 |
3440 |
4330 |
34827 |
|
n.v. |
0.15 |
-0.03 |
0.42 |
0.17 |
|
cyclin-dependent kinase 13 isoform 1 |
| 189409171 |
|
Cdk13 |
|
0 |
2261 |
3440 |
4330 |
34827 |
|
n.v. |
0.15 |
-0.03 |
0.42 |
0.17 |
|
cyclin-dependent kinase 13 isoform 2 |
| 161086911 |
|
Cdk14 |
|
0 |
2261 |
3440 |
4330 |
34420 |
|
n.v. |
0.15 |
-0.03 |
0.42 |
0.29 |
|
cyclin-dependent kinase 14 |
| 241666398 |
|
Cdk15 |
|
0 |
2261 |
3452 |
6303 |
34420 |
|
n.v. |
0.15 |
-0.04 |
0.47 |
0.29 |
|
cyclin-dependent kinase 15 |
| 7242173 |
|
Cdk16 |
|
0 |
2524 |
3590 |
4617 |
34763 |
|
n.v. |
0.14 |
0.07 |
0.26 |
0.41 |
|
cyclin-dependent kinase 16 |
| 160333476 |
|
Cdk17 |
|
0 |
2655 |
4134 |
8300 |
34763 |
|
n.v. |
0.13 |
-0.01 |
0.42 |
0.41 |
|
cyclin-dependent kinase 17 |
| 6679233 |
|
Cdk18 |
|
0 |
3048 |
4598 |
13752 |
34763 |
|
n.v. |
0.06 |
-0.04 |
0.39 |
0.41 |
|
cyclin-dependent kinase 18 |
| 34556205 |
|
Cdk2 |
|
1757 |
4636 |
7194 |
14030 |
77794 |
|
0.31 |
0.12 |
-0.17 |
0 |
0.01 |
|
cyclin-dependent kinase 2 isoform 1 |
| 7949020 |
|
Cdk2 |
|
1757 |
4636 |
7194 |
14030 |
77794 |
|
0.31 |
0.12 |
-0.17 |
0 |
0.01 |
|
cyclin-dependent kinase 2 isoform 2 |
| 16716469 |
|
Cdk20 |
|
0 |
2261 |
3440 |
4330 |
34420 |
|
n.v. |
0.15 |
-0.03 |
0.42 |
0.29 |
|
cyclin-dependent kinase 20 |
| 6753380 |
|
Cdk4 |
|
0 |
4092 |
4425 |
21700 |
47829 |
|
n.v. |
0.18 |
0.08 |
0.04 |
0.14 |
|
cyclin-dependent kinase 4 |
| 6680908 |
|
Cdk5 |
|
0 |
4025 |
4542 |
6106 |
44187 |
|
n.v. |
0.04 |
0.07 |
0.23 |
0.09 |
|
cyclin-dependent kinase 5 |
| 50657347 |
|
Cdk5rap2 |
|
0 |
0 |
41 |
0 |
0 |
|
n.v. |
n.v. |
-0.62 |
n.v. |
n.v. |
|
CDK5 regulatory subunit-associated protein 2 |
| 13384788 |
|
Cdk5rap3 |
|
165 |
438 |
67 |
0 |
0 |
|
-0.31 |
0.29 |
-0.01 |
n.v. |
n.v. |
|
CDK5 regulatory subunit-associated protein 3 |
| 14149637 |
|
Cdk6 |
|
0 |
2261 |
3508 |
4330 |
46179 |
|
n.v. |
0.15 |
-0.02 |
0.42 |
0.26 |
|
cyclin-dependent kinase 6 |
| 160333726 |
|
Cdk7 |
|
0 |
0 |
165 |
2660 |
2378 |
|
n.v. |
n.v. |
0.22 |
0.1 |
-0.01 |
|
cyclin-dependent kinase 7 |
| 18699998 |
|
Cdk9 |
|
0 |
2261 |
4301 |
36426 |
40953 |
|
n.v. |
0.15 |
-0.08 |
0.03 |
0.11 |
|
cyclin-dependent kinase 9 |
| 21617853 |
|
Cdkal1 |
|
0 |
833 |
85 |
0 |
0 |
|
n.v. |
-1.09 |
-0.52 |
n.v. |
n.v. |
|
threonylcarbamoyladenosine tRNA
methylthiotransferase |
| 34304105 |
|
Cdkl1 |
|
0 |
0 |
138 |
3798 |
0 |
|
n.v. |
n.v. |
0.15 |
0.02 |
n.v. |
|
cyclin-dependent kinase-like 1 |
| 31542372 |
|
Cdkn1b |
|
0 |
129 |
351 |
237 |
13847 |
|
n.v. |
0.18 |
-0.04 |
0.22 |
-0.27 |
|
cyclin-dependent kinase inhibitor 1B |
| 6753390 |
|
Cdkn2a |
|
1080 |
132 |
73 |
57 |
0 |
|
0.27 |
0 |
-0.17 |
-0.36 |
n.v. |
|
cyclin-dependent kinase inhibitor 2A, isoform 3 isoform 1 |
| 27369527 |
|
Cdkn2aip |
|
0 |
19 |
120 |
319 |
246 |
|
n.v. |
0.71 |
0.23 |
1.07 |
0.38 |
|
CDKN2A-interacting protein |
| 21313402 |
|
Cdkn2aipnl |
|
73 |
0 |
35 |
16 |
182 |
|
-0.01 |
n.v. |
0.19 |
0.1 |
0.01 |
|
CDKN2AIP N-terminal-like protein |
| 6671728 |
|
Cdkn2b |
|
0 |
0 |
0 |
41 |
4884 |
|
n.v. |
n.v. |
n.v. |
0.21 |
0.38 |
|
cyclin-dependent kinase 4 inhibitor B |
| 6680910 |
|
Cdkn2c |
|
0 |
0 |
0 |
0 |
15829 |
|
n.v. |
n.v. |
n.v. |
n.v. |
0.07 |
|
cyclin-dependent kinase 4 inhibitor C |
| 14719434 |
|
Cdo1 |
|
0 |
0 |
0 |
84352 |
0 |
|
n.v. |
n.v. |
n.v. |
0.07 |
n.v. |
|
cysteine dioxygenase type 1 |
| 257467494 |
|
Cdpf1 |
|
0 |
0 |
0 |
0 |
150 |
|
n.v. |
n.v. |
n.v. |
n.v. |
0.71 |
|
cysteine-rich DPF motif domain-containing protein 1 |
| 20149726 |
|
Cds2 |
|
1043 |
0 |
199 |
0 |
0 |
|
0.21 |
n.v. |
-0.67 |
n.v. |
n.v. |
|
phosphatidate cytidylyltransferase 2 |
| 31982546 |
|
Cdt1 |
|
0 |
0 |
0 |
0 |
268 |
|
n.v. |
n.v. |
n.v. |
n.v. |
-0.15 |
|
DNA replication factor Cdt1 |
| 197313683 |
|
Cdv3 |
|
0 |
61 |
1332 |
19383 |
2977 |
|
n.v. |
-0.15 |
0.24 |
0.16 |
0.1 |
|
protein CDV3 isoform c |
| 197313685 |
|
Cdv3 |
|
0 |
61 |
214 |
7318 |
1906 |
|
n.v. |
-0.15 |
0.37 |
0.07 |
0.08 |
|
protein CDV3 isoform d |
| 28202071 |
|
Cdv3 |
|
0 |
61 |
1332 |
19383 |
2977 |
|
n.v. |
-0.15 |
0.24 |
0.16 |
0.1 |
|
protein CDV3 isoform a |
| 28461294 |
|
Cdv3 |
|
0 |
61 |
1376 |
19383 |
2977 |
|
n.v. |
-0.15 |
0.25 |
0.16 |
0.1 |
|
protein CDV3 isoform b |
| 21450187 |
|
Cecr5 |
|
0 |
791 |
0 |
0 |
0 |
|
n.v. |
-0.12 |
n.v. |
n.v. |
n.v. |
|
cat eye syndrome critical region protein 5 homolog
precursor |
| 349585220 |
|
Celf1 |
|
0 |
0 |
13951 |
3372 |
0 |
|
n.v. |
n.v. |
0.25 |
-0.13 |
n.v. |
|
CUGBP Elav-like family member 1 isoform 2 |
| 38570086 |
|
Celf1 |
|
0 |
0 |
13951 |
3372 |
0 |
|
n.v. |
n.v. |
0.25 |
-0.13 |
n.v. |
|
CUGBP Elav-like family member 1 isoform 1 |
| 124286791 |
|
Celf2 |
|
0 |
0 |
5376 |
0 |
0 |
|
n.v. |
n.v. |
0.2 |
n.v. |
n.v. |
|
CUGBP Elav-like family member 2 isoform 6 |
| 159032033 |
|
Celf2 |
|
0 |
0 |
5376 |
0 |
0 |
|
n.v. |
n.v. |
0.2 |
n.v. |
n.v. |
|
CUGBP Elav-like family member 2 isoform 2 |
| 159032035 |
|
Celf2 |
|
0 |
0 |
5376 |
0 |
0 |
|
n.v. |
n.v. |
0.2 |
n.v. |
n.v. |
|
CUGBP Elav-like family member 2 isoform 3 |
| 159032037 |
|
Celf2 |
|
0 |
0 |
5376 |
0 |
0 |
|
n.v. |
n.v. |
0.2 |
n.v. |
n.v. |
|
CUGBP Elav-like family member 2 isoform 4 |
| 159032039 |
|
Celf2 |
|
0 |
0 |
5376 |
0 |
0 |
|
n.v. |
n.v. |
0.2 |
n.v. |
n.v. |
|
CUGBP Elav-like family member 2 isoform 5 |
| 237757269 |
|
Celf2 |
|
0 |
0 |
5376 |
0 |
0 |
|
n.v. |
n.v. |
0.2 |
n.v. |
n.v. |
|
CUGBP Elav-like family member 2 isoform 7 |
| 237757271;159032031 |
|
Celf2 |
|
0 |
0 |
5376 |
0 |
0 |
|
n.v. |
n.v. |
0.2 |
n.v. |
n.v. |
|
CUGBP Elav-like family member 2 isoform 1 |
| 114050895 |
|
Celsr2 |
|
0 |
0 |
487 |
0 |
0 |
|
n.v. |
n.v. |
-0.07 |
n.v. |
n.v. |
|
cadherin EGF LAG seven-pass G-type receptor 2 isoform 1
precursor |
| 114050897 |
|
Celsr2 |
|
0 |
0 |
487 |
0 |
0 |
|
n.v. |
n.v. |
-0.07 |
n.v. |
n.v. |
|
cadherin EGF LAG seven-pass G-type receptor 2 isoform 2
precursor |
| 115648101 |
|
Cenpe |
|
0 |
0 |
454 |
0 |
161 |
|
n.v. |
n.v. |
0.2 |
n.v. |
0.1 |
|
centromere-associated protein E |
| 11230784 |
|
Cenph |
|
11661 |
3355 |
5171 |
2881 |
0 |
|
0.01 |
-0.01 |
0.15 |
0.11 |
n.v. |
|
centromere protein H |
| 122939139 |
|
Cenpm |
|
0 |
0 |
0 |
106 |
0 |
|
n.v. |
n.v. |
n.v. |
0.02 |
n.v. |
|
centromere protein M isoform 3 |
| 13385104 |
|
Cenpm |
|
0 |
0 |
0 |
106 |
0 |
|
n.v. |
n.v. |
n.v. |
0.02 |
n.v. |
|
centromere protein M isoform 1 |
| 189458800 |
|
Cep250 |
|
0 |
6 |
0 |
0 |
0 |
|
n.v. |
-0.82 |
n.v. |
n.v. |
n.v. |
|
centrosome-associated protein CEP250 isoform 1 |
| 194018503 |
|
Cep250 |
|
0 |
6 |
0 |
0 |
0 |
|
n.v. |
-0.82 |
n.v. |
n.v. |
n.v. |
|
centrosome-associated protein CEP250 isoform 3 |
| 194097345 |
|
Cep250 |
|
0 |
6 |
0 |
0 |
0 |
|
n.v. |
-0.82 |
n.v. |
n.v. |
n.v. |
|
centrosome-associated protein CEP250 isoform 2 |
| 163965444 |
|
Cep290 |
|
0 |
0 |
6 |
0 |
0 |
|
n.v. |
n.v. |
0.4 |
n.v. |
n.v. |
|
centrosomal protein of 290 kDa |
| 255982600 |
|
Cep350 |
|
0 |
0 |
0 |
974 |
0 |
|
n.v. |
n.v. |
n.v. |
-0.34 |
n.v. |
|
centrosome-associated protein 350 |
| 14030773 |
|
Cep41 |
|
0 |
0 |
132 |
0 |
0 |
|
n.v. |
n.v. |
0.17 |
n.v. |
n.v. |
|
centrosomal protein of 41 kDa |
| 256355030 |
|
Cep55 |
|
0 |
106 |
0 |
98 |
0 |
|
n.v. |
2.15 |
n.v. |
0.34 |
n.v. |
|
centrosomal protein of 55 kDa isoform 2 |
| 256355032 |
|
Cep55 |
|
0 |
106 |
0 |
98 |
0 |
|
n.v. |
2.15 |
n.v. |
0.34 |
n.v. |
|
centrosomal protein of 55 kDa isoform 1 |
| 262331530 |
|
Cep95 |
|
0 |
0 |
6 |
0 |
0 |
|
n.v. |
n.v. |
0.32 |
n.v. |
n.v. |
|
centrosomal protein of 95 kDa isoform 1 |
| 262331533 |
|
Cep95 |
|
0 |
0 |
6 |
0 |
0 |
|
n.v. |
n.v. |
0.32 |
n.v. |
n.v. |
|
centrosomal protein of 95 kDa isoform 2 |
| 21312662 |
|
Cep97 |
|
0 |
0 |
0 |
0 |
96 |
|
n.v. |
n.v. |
n.v. |
n.v. |
0.44 |
|
centrosomal protein of 97 kDa isoform 1 |
| 31559983 |
|
Cept1 |
|
0 |
668 |
179 |
0 |
0 |
|
n.v. |
-0.32 |
-0.39 |
n.v. |
n.v. |
|
choline/ethanolaminephosphotransferase 1 |
| 22095015 |
|
Cers2 |
|
201 |
1956 |
222 |
0 |
0 |
|
0.14 |
-0.2 |
-0.35 |
n.v. |
n.v. |
|
ceramide synthase 2 |
| 117553604 |
|
Ces1d |
|
0 |
31 |
0 |
0 |
0 |
|
n.v. |
-1.02 |
n.v. |
n.v. |
n.v. |
|
carboxylesterase 1D precursor |
| 76253942 |
|
Cetn1 |
|
0 |
0 |
102 |
0 |
396 |
|
n.v. |
n.v. |
-0.05 |
n.v. |
-0.55 |
|
centrin-1 |
| 10257421 |
|
Cetn2 |
|
0 |
0 |
203 |
0 |
1435 |
|
n.v. |
n.v. |
-0.06 |
n.v. |
-0.19 |
|
centrin-2 |
| 6680922 |
|
Cetn3 |
|
0 |
0 |
318 |
16 |
857 |
|
n.v. |
n.v. |
-0.09 |
-0.9 |
0.18 |
|
centrin-3 |
| 6753412 |
|
Cfdp1 |
|
0 |
0 |
126 |
74 |
28862 |
|
n.v. |
n.v. |
0.17 |
-0.01 |
0.19 |
|
craniofacial development protein 1 |
| 6680924 |
|
Cfl1 |
|
272412 |
49599 |
93970 |
127449 |
269805 |
|
0.17 |
0.25 |
0.08 |
0.32 |
0.09 |
|
cofilin-1 |
| 6671746 |
|
Cfl2 |
|
122449 |
29595 |
33235 |
33454 |
99063 |
|
0.07 |
0.11 |
0.04 |
0.27 |
0.02 |
|
cofilin-2 |
| 46559393 |
|
Cflar |
|
0 |
0 |
0 |
0 |
2228 |
|
n.v. |
n.v. |
n.v. |
n.v. |
-0.14 |
|
CASP8 and FADD-like apoptosis regulator isoform 1 |
| 86198303 |
|
Cflar |
|
0 |
0 |
0 |
0 |
2228 |
|
n.v. |
n.v. |
n.v. |
n.v. |
-0.14 |
|
CASP8 and FADD-like apoptosis regulator isoform 2 |
| 14141185 |
|
Cftr |
|
0 |
0 |
0 |
0 |
10249 |
|
n.v. |
n.v. |
n.v. |
n.v. |
0.02 |
|
cystic fibrosis transmembrane conductance regulator |
| 30520001 |
|
Cggbp1 |
|
220 |
117 |
956 |
2235 |
0 |
|
0.32 |
0.48 |
-0.05 |
-0.16 |
n.v. |
|
CGG triplet repeat-binding protein 1 |
| 189458807 |
|
Cgn |
|
16494 |
1397 |
2851 |
3724 |
107770 |
|
-0.09 |
0.19 |
0.1 |
0.32 |
0.12 |
|
cingulin |
| 13386024 |
|
Chac2 |
|
0 |
0 |
0 |
0 |
932 |
|
n.v. |
n.v. |
n.v. |
n.v. |
0.04 |
|
cation transport regulator-like protein 2 |
| 7304957 |
|
Chaf1a |
|
0 |
0 |
31 |
0 |
1232 |
|
n.v. |
n.v. |
0.05 |
n.v. |
0.15 |
|
chromatin assembly factor 1 subunit A |
| 21312470 |
|
Chaf1b |
|
0 |
461 |
299 |
6450 |
3288 |
|
n.v. |
0.06 |
-0.17 |
0.25 |
0.08 |
|
chromatin assembly factor 1 subunit B |
| 32469497 |
|
Champ1 |
|
2087 |
0 |
0 |
0 |
0 |
|
0.03 |
n.v. |
n.v. |
n.v. |
n.v. |
|
chromosome alignment-maintaining phosphoprotein 1 |
| 13384734 |
|
Chchd1 |
|
165 |
1468 |
0 |
0 |
0 |
|
-0.36 |
-0.15 |
n.v. |
n.v. |
n.v. |
|
coiled-coil-helix-coiled-coil-helix domain-containing
protein 1 |
| 18079334 |
|
Chchd2 |
|
256 |
3092 |
0 |
0 |
2752 |
|
0.28 |
0.13 |
n.v. |
n.v. |
-0.61 |
|
coiled-coil-helix-coiled-coil-helix domain-containing
protein 2, mitochondrial precursor |
| 21313618 |
|
Chchd3 |
|
72858 |
21215 |
48 |
0 |
0 |
|
-0.09 |
-0.11 |
-0.28 |
n.v. |
n.v. |
|
coiled-coil-helix-coiled-coil-helix domain-containing
protein 3, mitochondrial precursor |
| 19527144 |
|
Chchd4 |
|
494 |
854 |
78 |
0 |
0 |
|
-0.11 |
0.07 |
-0.27 |
n.v. |
n.v. |
|
mitochondrial intermembrane space import and assembly
protein 40 |
| 28076873 |
|
Chchd5 |
|
0 |
303 |
0 |
0 |
0 |
|
n.v. |
-0.38 |
n.v. |
n.v. |
n.v. |
|
coiled-coil-helix-coiled-coil-helix domain-containing
protein 5 |
| 267844804 |
|
Chchd6 |
|
12302 |
5595 |
37 |
0 |
0 |
|
-0.09 |
-0.25 |
-0.63 |
n.v. |
n.v. |
|
coiled-coil-helix-coiled-coil-helix domain-containing
protein 6, mitochondrial isoform 1 |
| 267844806 |
|
Chchd6 |
|
12302 |
5595 |
37 |
0 |
0 |
|
-0.09 |
-0.25 |
-0.63 |
n.v. |
n.v. |
|
coiled-coil-helix-coiled-coil-helix domain-containing
protein 6, mitochondrial isoform 2 |
| 298358505;298358513 |
|
Chchd7 |
|
0 |
305 |
0 |
0 |
0 |
|
n.v. |
0.23 |
n.v. |
n.v. |
n.v. |
|
coiled-coil-helix-coiled-coil-helix domain-containing
protein 7 |
| 357527416 |
|
Chd3 |
|
32347 |
0 |
73 |
5255 |
0 |
|
0.04 |
n.v. |
-0.41 |
-0.34 |
n.v. |
|
chromodomain helicase DNA binding protein 3 |
| 39204553 |
|
Chd4 |
|
57792 |
497 |
566 |
15176 |
5312 |
|
0.04 |
0.18 |
-0.53 |
-0.29 |
-0.14 |
|
chromodomain-helicase-DNA-binding protein 4 |
| 124487025 |
|
Chd5 |
|
27935 |
284 |
490 |
4281 |
3802 |
|
0.01 |
0.7 |
-1.14 |
-0.4 |
-0.09 |
|
chromodomain helicase DNA binding protein 5 isoform 1 |
| 189458814 |
|
Chd5 |
|
27935 |
284 |
490 |
4281 |
3802 |
|
0.01 |
0.7 |
-1.14 |
-0.4 |
-0.09 |
|
chromodomain helicase DNA binding protein 5 isoform 2 |
| 30425036 |
|
Chdh |
|
84574 |
11245 |
6545 |
0 |
0 |
|
0.09 |
-0.2 |
-0.39 |
n.v. |
n.v. |
|
choline dehydrogenase, mitochondrial |
| 31542385 |
|
Chek1 |
|
0 |
157 |
301 |
0 |
225 |
|
n.v. |
0.29 |
0.09 |
n.v. |
0.35 |
|
serine/threonine-protein kinase Chk1 |
| 119672912 |
|
Cherp |
|
0 |
1182 |
190 |
0 |
0 |
|
n.v. |
-0.13 |
0 |
n.v. |
n.v. |
|
calcium homeostasis endoplasmic reticulum protein |
| 218083710 |
|
Chid1 |
|
0 |
0 |
61 |
0 |
0 |
|
n.v. |
n.v. |
-0.13 |
n.v. |
n.v. |
|
chitinase domain-containing protein 1 isoform 1
precursor |
| 31541939 |
|
Chid1 |
|
0 |
0 |
61 |
0 |
0 |
|
n.v. |
n.v. |
-0.13 |
n.v. |
n.v. |
|
chitinase domain-containing protein 1 isoform 2
precursor |
| 407970974 |
|
Chka |
|
0 |
0 |
124 |
0 |
1414 |
|
n.v. |
n.v. |
-0.03 |
n.v. |
0.2 |
|
choline kinase alpha isoform 3 |
| 70908364 |
|
Chka |
|
0 |
0 |
124 |
0 |
1414 |
|
n.v. |
n.v. |
-0.03 |
n.v. |
0.2 |
|
choline kinase alpha isoform 1 |
| 6671748 |
|
Chkb |
|
0 |
541 |
148 |
0 |
2495 |
|
n.v. |
0.44 |
0.36 |
n.v. |
-0.16 |
|
choline/ethanolamine kinase |
| 110681714 |
|
Chm |
|
0 |
0 |
0 |
0 |
2013 |
|
n.v. |
n.v. |
n.v. |
n.v. |
-0.01 |
|
rab proteins geranylgeranyltransferase component A 1 |
| 377834613 |
|
Chm |
|
0 |
0 |
0 |
0 |
2013 |
|
n.v. |
n.v. |
n.v. |
n.v. |
-0.01 |
|
PREDICTED: rab proteins geranylgeranyltransferase
component A 1 |
| 21704220 |
|
Chmp1a |
|
0 |
0 |
0 |
0 |
1553 |
|
n.v. |
n.v. |
n.v. |
n.v. |
0.04 |
|
charged multivesicular body protein 1a |
| 21312151 |
|
Chmp2a |
|
0 |
547 |
1093 |
7105 |
5954 |
|
n.v. |
-0.01 |
0.22 |
-0.21 |
-0.01 |
|
charged multivesicular body protein 2a |
| 30794432 |
|
Chmp2b |
|
0 |
269 |
399 |
557 |
11191 |
|
n.v. |
0.14 |
0.11 |
0.3 |
0.24 |
|
charged multivesicular body protein 2b |
| 31541959 |
|
Chmp3 |
|
0 |
0 |
931 |
1768 |
8814 |
|
n.v. |
n.v. |
0.13 |
0.15 |
-0.02 |
|
charged multivesicular body protein 3 |
| 28077049 |
|
Chmp4b |
|
3496 |
2079 |
10145 |
7023 |
27288 |
|
0.35 |
0.3 |
0.19 |
0.13 |
0.12 |
|
charged multivesicular body protein 4b |
| 13386442 |
|
Chmp5 |
|
0 |
1710 |
79 |
5206 |
19705 |
|
n.v. |
0.3 |
0.02 |
0.07 |
0.13 |
|
charged multivesicular body protein 5 |
| 147904547 |
|
Chmp6 |
|
1519 |
5048 |
3503 |
5083 |
0 |
|
0.39 |
-0.14 |
0 |
-0.44 |
n.v. |
|
charged multivesicular body protein 6 |
| 13385324 |
|
Chordc1 |
|
0 |
119 |
98 |
876 |
6404 |
|
n.v. |
0.63 |
0.31 |
0.49 |
0.02 |
|
cysteine and histidine-rich domain-containing protein 1 |
| 9790225 |
|
Chp1 |
|
14645 |
2357 |
6920 |
237 |
0 |
|
-0.07 |
0.06 |
-0.07 |
-0.82 |
n.v. |
|
calcineurin B homologous protein 1 |
| 226442811 |
|
Chpt1 |
|
0 |
0 |
225 |
0 |
0 |
|
n.v. |
n.v. |
-0.29 |
n.v. |
n.v. |
|
cholinephosphotransferase 1 isoform 2 |
| 226442815 |
|
Chpt1 |
|
0 |
0 |
155 |
0 |
0 |
|
n.v. |
n.v. |
-0.02 |
n.v. |
n.v. |
|
cholinephosphotransferase 1 isoform 1 |
| 6752950 |
|
Chrne |
|
0 |
0 |
0 |
0 |
4755 |
|
n.v. |
n.v. |
n.v. |
n.v. |
0.09 |
|
acetylcholine receptor subunit epsilon precursor |
| 157951666 |
|
Chtf18 |
|
0 |
0 |
53 |
5509 |
2710 |
|
n.v. |
n.v. |
-0.6 |
-0.05 |
0.78 |
|
chromosome transmission fidelity protein 18 homolog |
| 84000434 |
|
Chtf8 |
|
0 |
94 |
31 |
589 |
171 |
|
n.v. |
0.63 |
0.22 |
0.32 |
0.03 |
|
chromosome transmission fidelity protein 8 homolog |
| 31981251 |
|
Chtop |
|
12558 |
184 |
1308 |
2726 |
0 |
|
-0.31 |
-0.02 |
0.05 |
-0.2 |
n.v. |
|
chromatin target of PRMT1 protein |
| 124249115 |
|
Churc1 |
|
0 |
0 |
0 |
0 |
600 |
|
n.v. |
n.v. |
n.v. |
n.v. |
0.59 |
|
protein Churchill |
| 31542399 |
|
Ciao1 |
|
0 |
0 |
811 |
3250 |
23165 |
|
n.v. |
n.v. |
-0.04 |
0.45 |
-0.06 |
|
probable cytosolic iron-sulfur protein assembly protein
CIAO1 |
| 19527376 |
|
Ciapin1 |
|
0 |
4 |
179 |
0 |
24578 |
|
n.v. |
0.03 |
-0.07 |
n.v. |
0.24 |
|
anamorsin |
| 6680946 |
|
Cirbp |
|
7945 |
925 |
2650 |
9847 |
0 |
|
0.19 |
0.07 |
-0.16 |
-0.2 |
n.v. |
|
cold-inducible RNA-binding protein |
| 19527228 |
|
Cisd1 |
|
115438 |
38262 |
7186 |
7662 |
0 |
|
-0.06 |
-0.12 |
-0.31 |
-0.23 |
n.v. |
|
CDGSH iron-sulfur domain-containing protein 1 |
| 21728370 |
|
Cisd2 |
|
34727 |
5519 |
2376 |
2644 |
0 |
|
0.06 |
-0.23 |
-0.35 |
-0.36 |
n.v. |
|
CDGSH iron-sulfur domain-containing protein 2 |
| 168229148 |
|
Cisd3 |
|
146 |
432 |
0 |
0 |
0 |
|
0.38 |
-0.1 |
n.v. |
n.v. |
n.v. |
|
CDGSH iron-sulfur domain-containing protein 3,
mitochondrial precursor |
| 62526118 |
|
Ckap4 |
|
641 |
1966 |
1455 |
0 |
0 |
|
-0.22 |
-0.3 |
-0.5 |
n.v. |
n.v. |
|
cytoskeleton-associated protein 4 |
| 260166719 |
|
Ckap5 |
|
0 |
219 |
4734 |
0 |
268 |
|
n.v. |
0.36 |
0.19 |
n.v. |
-0.25 |
|
cytoskeleton-associated protein 5 isoform 2 |
| 260166721 |
|
Ckap5 |
|
0 |
219 |
4734 |
0 |
268 |
|
n.v. |
0.36 |
0.19 |
n.v. |
-0.25 |
|
cytoskeleton-associated protein 5 isoform 1 |
| 6753428 |
|
Ckmt1 |
|
349883 |
6937 |
1987 |
336 |
0 |
|
0.29 |
0.06 |
-0.01 |
-0.29 |
n.v. |
|
creatine kinase U-type, mitochondrial precursor |
| 38259206 |
|
Ckmt2 |
|
347906 |
4041 |
1455 |
336 |
0 |
|
0.28 |
-0.12 |
-0.01 |
-0.29 |
n.v. |
|
creatine kinase S-type, mitochondrial precursor |
| 8393135 |
|
Cks1b |
|
0 |
0 |
0 |
0 |
525 |
|
n.v. |
n.v. |
n.v. |
n.v. |
-0.1 |
|
cyclin-dependent kinases regulatory subunit 1 |
| 13384804 |
|
Cks2 |
|
0 |
0 |
0 |
0 |
193 |
|
n.v. |
n.v. |
n.v. |
n.v. |
0.26 |
|
cyclin-dependent kinases regulatory subunit 2 |
| 124486879 |
|
Clasp1 |
|
0 |
0 |
269 |
0 |
0 |
|
n.v. |
n.v. |
0.15 |
n.v. |
n.v. |
|
CLIP-associating protein 1 isoform 1 |
| 163644247 |
|
Clasp1 |
|
0 |
0 |
269 |
0 |
0 |
|
n.v. |
n.v. |
0.15 |
n.v. |
n.v. |
|
CLIP-associating protein 1 isoform 3 |
| 163644249 |
|
Clasp1 |
|
0 |
0 |
269 |
0 |
0 |
|
n.v. |
n.v. |
0.15 |
n.v. |
n.v. |
|
CLIP-associating protein 1 isoform 2 |
| 295293088 |
|
Clcc1 |
|
0 |
0 |
116 |
0 |
0 |
|
n.v. |
n.v. |
-0.41 |
n.v. |
n.v. |
|
chloride channel CLIC-like protein 1 isoform 1 precursor |
| 295293090;21704070 |
|
Clcc1 |
|
0 |
0 |
116 |
0 |
0 |
|
n.v. |
n.v. |
-0.41 |
n.v. |
n.v. |
|
chloride channel CLIC-like protein 1 isoform 2 precursor |
| 189458826 |
|
Clcn3 |
|
0 |
0 |
193 |
0 |
0 |
|
n.v. |
n.v. |
0.07 |
n.v. |
n.v. |
|
H(+)/Cl(-) exchange transporter 3 isoform e |
| 189458829 |
|
Clcn3 |
|
0 |
0 |
193 |
0 |
0 |
|
n.v. |
n.v. |
0.07 |
n.v. |
n.v. |
|
H(+)/Cl(-) exchange transporter 3 isoform b |
| 41281837 |
|
Clcn3 |
|
0 |
0 |
193 |
0 |
0 |
|
n.v. |
n.v. |
0.07 |
n.v. |
n.v. |
|
H(+)/Cl(-) exchange transporter 3 isoform c |
| 6680948 |
|
Clcn3 |
|
0 |
0 |
193 |
0 |
0 |
|
n.v. |
n.v. |
0.07 |
n.v. |
n.v. |
|
H(+)/Cl(-) exchange transporter 3 isoform a |
| 110625940 |
|
Clcn4-2 |
|
0 |
0 |
193 |
0 |
0 |
|
n.v. |
n.v. |
0.07 |
n.v. |
n.v. |
|
H(+)/Cl(-) exchange transporter 4 |
| 261823931 |
|
Clcn5 |
|
0 |
0 |
92 |
0 |
0 |
|
n.v. |
n.v. |
0.07 |
n.v. |
n.v. |
|
H(+)/Cl(-) exchange transporter 5 isoform 1 |
| 344313157 |
|
Clcn5 |
|
0 |
0 |
92 |
0 |
0 |
|
n.v. |
n.v. |
0.07 |
n.v. |
n.v. |
|
H(+)/Cl(-) exchange transporter 5 isoform 2 |
| 6753436 |
|
Clcn7 |
|
0 |
0 |
445 |
0 |
0 |
|
n.v. |
n.v. |
-0.2 |
n.v. |
n.v. |
|
H(+)/Cl(-) exchange transporter 7 |
| 7710002 |
|
Cldn1 |
|
0 |
40 |
165 |
0 |
0 |
|
n.v. |
0.48 |
0.26 |
n.v. |
n.v. |
|
claudin-1 |
| 25188197 |
|
Cldn25 |
|
0 |
159 |
95 |
0 |
0 |
|
n.v. |
-0.06 |
-0.19 |
n.v. |
n.v. |
|
claudin domain-containing protein 1 isoform 1 |
| 356991139 |
|
Cldn25 |
|
0 |
159 |
95 |
0 |
0 |
|
n.v. |
-0.06 |
-0.19 |
n.v. |
n.v. |
|
claudin domain-containing protein 1 isoform 3 |
| 356995848 |
|
Cldn25 |
|
0 |
159 |
95 |
0 |
0 |
|
n.v. |
-0.06 |
-0.19 |
n.v. |
n.v. |
|
claudin domain-containing protein 1 isoform 2 |
| 6753438 |
|
Cldn3 |
|
28319 |
12571 |
6977 |
7932 |
0 |
|
0 |
-0.02 |
-0.08 |
-0.21 |
n.v. |
|
claudin-3 |
| 6753440 |
|
Cldn4 |
|
146 |
5114 |
18177 |
6229 |
0 |
|
0.31 |
0.18 |
0.02 |
0 |
n.v. |
|
claudin-4 |
| 9055190 |
|
Cldn6 |
|
7066 |
219 |
2034 |
1793 |
0 |
|
0.05 |
-0.04 |
-0.08 |
-0.87 |
n.v. |
|
claudin-6 precursor |
| 302318906;8393144 |
|
Cldn7 |
|
0 |
0 |
3578 |
0 |
0 |
|
n.v. |
n.v. |
0 |
n.v. |
n.v. |
|
claudin-7 |
| 8393144 |
|
Cldn7 |
|
7780 |
893 |
0 |
2357 |
0 |
|
-0.4 |
0.16 |
n.v. |
-0.13 |
n.v. |
|
claudin-7 precursor |
| 9055192 |
|
Cldn8 |
|
7048 |
380 |
1428 |
769 |
0 |
|
0.23 |
-0.08 |
0.05 |
-0.13 |
n.v. |
|
claudin-8 |
| 61098102 |
|
Cldn9 |
|
7066 |
6 |
480 |
1277 |
0 |
|
0.05 |
-0.19 |
-0.09 |
-0.71 |
n.v. |
|
claudin-9 |
| 323668269 |
|
Clec16a |
|
0 |
0 |
18 |
401 |
0 |
|
n.v. |
n.v. |
0.08 |
0 |
n.v. |
|
protein CLEC16A isoform 2 |
| 61656175 |
|
Clec16a |
|
0 |
0 |
18 |
401 |
0 |
|
n.v. |
n.v. |
0.08 |
0 |
n.v. |
|
protein CLEC16A isoform 1 |
| 15617203 |
|
Clic1 |
|
53234 |
22543 |
77897 |
27839 |
194720 |
|
0.07 |
0.11 |
-0.25 |
-0.06 |
0.08 |
|
chloride intracellular channel protein 1 |
| 27229085 |
|
Clic3 |
|
0 |
0 |
133 |
0 |
0 |
|
n.v. |
n.v. |
-0.66 |
n.v. |
n.v. |
|
chloride intracellular channel protein 3 |
| 7304963 |
|
Clic4 |
|
0 |
5828 |
25011 |
5018 |
42881 |
|
n.v. |
0.04 |
-0.41 |
-0.26 |
0.12 |
|
chloride intracellular channel protein 4 |
| 27369886 |
|
Clic5 |
|
0 |
0 |
31 |
0 |
0 |
|
n.v. |
n.v. |
-0.36 |
n.v. |
n.v. |
|
chloride intracellular channel protein 5 |
| 154240730 |
|
Clint1 |
|
21217 |
6486 |
45342 |
12761 |
14608 |
|
0.08 |
0.17 |
0.18 |
0.1 |
0.05 |
|
clathrin interactor 1 |
| 23821025 |
|
Clip1 |
|
0 |
0 |
132 |
0 |
49521 |
|
n.v. |
n.v. |
-0.51 |
n.v. |
0.03 |
|
CAP-Gly domain-containing linker protein 1 |
| 85662406 |
|
Clip2 |
|
10398 |
13 |
0 |
0 |
5398 |
|
-0.07 |
0.1 |
n.v. |
n.v. |
0.05 |
|
CAP-Gly domain-containing linker protein 2 isoform b |
| 85662410 |
|
Clip2 |
|
10398 |
13 |
0 |
0 |
5398 |
|
-0.07 |
0.1 |
n.v. |
n.v. |
0.05 |
|
CAP-Gly domain-containing linker protein 2 isoform a |
| 100816764 |
|
Clmn |
|
3039 |
0 |
0 |
0 |
0 |
|
0.51 |
n.v. |
n.v. |
n.v. |
n.v. |
|
calmin isoform a |
| 100816903 |
|
Clmn |
|
3039 |
0 |
0 |
0 |
0 |
|
0.51 |
n.v. |
n.v. |
n.v. |
n.v. |
|
calmin isoform b |
| 226423881 |
|
Cln3 |
|
0 |
13 |
45 |
0 |
0 |
|
n.v. |
-0.83 |
-0.4 |
n.v. |
n.v. |
|
battenin |
| 112734833 |
|
Cln5 |
|
0 |
2572 |
534 |
0 |
0 |
|
n.v. |
-0.01 |
-0.19 |
n.v. |
n.v. |
|
ceroid-lipofuscinosis neuronal protein 5 homolog
precursor |
| 75677520 |
|
Cln6 |
|
4741 |
0 |
471 |
0 |
0 |
|
-0.58 |
n.v. |
-0.46 |
n.v. |
n.v. |
|
ceroid-lipofuscinosis, neuronal 6 |
| 19263324 |
|
Clns1a |
|
0 |
0 |
836 |
0 |
24964 |
|
n.v. |
n.v. |
0.2 |
n.v. |
-0.19 |
|
methylosome subunit pICln |
| 19527056 |
|
Clp1 |
|
0 |
0 |
225 |
0 |
0 |
|
n.v. |
n.v. |
-0.09 |
n.v. |
n.v. |
|
polyribonucleotide 5'-hydroxyl-kinase Clp1 |
| 6677983 |
|
Clpb |
|
0 |
4 |
0 |
0 |
0 |
|
n.v. |
-0.24 |
n.v. |
n.v. |
n.v. |
|
caseinolytic peptidase B protein homolog |
| 8393156 |
|
Clpp |
|
14901 |
15253 |
0 |
0 |
942 |
|
-0.09 |
-0.05 |
n.v. |
n.v. |
0.3 |
|
putative ATP-dependent Clp protease proteolytic subunit,
mitochondrial precursor |
| 103472025 |
|
Clptm1 |
|
4979 |
2108 |
1095 |
0 |
0 |
|
0.22 |
-0.31 |
-0.23 |
n.v. |
n.v. |
|
cleft lip and palate transmembrane protein 1 homolog |
| 326937503 |
|
Clptm1l |
|
0 |
71 |
0 |
0 |
0 |
|
n.v. |
-0.37 |
n.v. |
n.v. |
n.v. |
|
cleft lip and palate transmembrane protein 1-like protein |
| 113205069 |
|
Clpx |
|
0 |
4008 |
0 |
0 |
0 |
|
n.v. |
-0.12 |
n.v. |
n.v. |
n.v. |
|
ATP-dependent Clp protease ATP-binding subunit clpX-like,
mitochondrial isoform 2 |
| 113205071 |
|
Clpx |
|
0 |
4008 |
0 |
0 |
0 |
|
n.v. |
-0.12 |
n.v. |
n.v. |
n.v. |
|
ATP-dependent Clp protease ATP-binding subunit clpX-like,
mitochondrial isoform 1 |
| 122939192 |
|
Clta |
|
0 |
0 |
5906 |
1056 |
793 |
|
n.v. |
n.v. |
0.29 |
0.01 |
-0.04 |
|
clathrin light chain A isoform a |
| 122939194 |
|
Clta |
|
0 |
0 |
5906 |
1056 |
793 |
|
n.v. |
n.v. |
0.29 |
0.01 |
-0.04 |
|
clathrin light chain A isoform b |
| 122939196 |
|
Clta |
|
0 |
0 |
5906 |
1056 |
793 |
|
n.v. |
n.v. |
0.29 |
0.01 |
-0.04 |
|
clathrin light chain A isoform d |
| 122939198 |
|
Clta |
|
0 |
0 |
5906 |
1056 |
793 |
|
n.v. |
n.v. |
0.29 |
0.01 |
-0.04 |
|
clathrin light chain A isoform c |
| 30794164 |
|
Cltb |
|
0 |
0 |
2410 |
0 |
9703 |
|
n.v. |
n.v. |
0.46 |
n.v. |
0.17 |
|
clathrin light chain B |
| 51491845 |
|
Cltc |
|
916564 |
24962 |
442694 |
826537 |
634485 |
|
0.1 |
0.14 |
0.33 |
-0.02 |
-0.17 |
|
clathrin heavy chain 1 |
| 214010170 |
|
Clu |
|
0 |
468 |
1422 |
0 |
0 |
|
n.v. |
-0.13 |
-0.55 |
n.v. |
n.v. |
|
clusterin precursor |
| 39930457 |
|
Cluap1 |
|
0 |
0 |
0 |
958 |
0 |
|
n.v. |
n.v. |
n.v. |
0.63 |
n.v. |
|
clusterin-associated protein 1 |
| 124487201 |
|
Cluh |
|
0 |
0 |
3572 |
0 |
29365 |
|
n.v. |
n.v. |
0.05 |
n.v. |
-0.13 |
|
clustered mitochondria protein homolog |
| 256220113 |
|
Clybl |
|
384 |
6565 |
0 |
0 |
0 |
|
-0.09 |
-0.22 |
n.v. |
n.v. |
n.v. |
|
citrate lyase subunit beta-like protein, mitochondrial
precursor |
| 247269309 |
|
Cmas |
|
2233 |
0 |
0 |
0 |
0 |
|
-0.04 |
n.v. |
n.v. |
n.v. |
n.v. |
|
N-acylneuraminate cytidylyltransferase |
| 21735441 |
|
Cmc1 |
|
531 |
125 |
0 |
0 |
0 |
|
0.13 |
-0.69 |
n.v. |
n.v. |
n.v. |
|
COX assembly mitochondrial protein homolog |
| 33457314 |
|
Cmc2 |
|
0 |
8 |
0 |
0 |
0 |
|
n.v. |
-0.12 |
n.v. |
n.v. |
n.v. |
|
COX assembly mitochondrial protein 2 homolog |
| 165377065 |
|
Cmpk1 |
|
0 |
5369 |
6629 |
3020 |
88257 |
|
n.v. |
0.29 |
0.09 |
0.49 |
0.15 |
|
UMP-CMP kinase |
| 165932364 |
|
Cmss1 |
|
0 |
580 |
1277 |
5165 |
0 |
|
n.v. |
-0.11 |
0.1 |
-0.16 |
n.v. |
|
protein CMSS1 |
| 27312023 |
|
Cmtm4 |
|
0 |
0 |
269 |
0 |
0 |
|
n.v. |
n.v. |
0.1 |
n.v. |
n.v. |
|
CKLF-like MARVEL transmembrane domain-containing protein
4 |
| 19527198 |
|
Cmtm7 |
|
0 |
0 |
100 |
0 |
0 |
|
n.v. |
n.v. |
-0.03 |
n.v. |
n.v. |
|
CKLF-like MARVEL transmembrane domain-containing protein
7 isoform 1 |
| 357197168 |
|
Cmtm7 |
|
0 |
0 |
100 |
0 |
0 |
|
n.v. |
n.v. |
-0.03 |
n.v. |
n.v. |
|
CKLF-like MARVEL transmembrane domain-containing protein
7 isoform 2 |
| 21311939 |
|
Cmtr1 |
|
0 |
92 |
312 |
1408 |
6169 |
|
n.v. |
-2 |
0.28 |
0.42 |
-0.2 |
|
cap-specific mRNA (nucleoside-2'-O-)-methyltransferase 1 |
| 157909782 |
|
Cnbp |
|
48987 |
607 |
10827 |
24565 |
21987 |
|
0.03 |
0.18 |
0.03 |
0.03 |
0.07 |
|
cellular nucleic acid-binding protein isoform 2 |
| 157909784 |
|
Cnbp |
|
63705 |
1774 |
16565 |
36745 |
33606 |
|
0.09 |
0.15 |
0.03 |
0.03 |
0.01 |
|
cellular nucleic acid-binding protein isoform 3 |
| 7304969 |
|
Cnbp |
|
48987 |
607 |
10827 |
25506 |
21987 |
|
0.03 |
0.18 |
0.03 |
0.03 |
0.07 |
|
cellular nucleic acid-binding protein isoform 1 |
| 31981273 |
|
Cndp2 |
|
14956 |
27685 |
37452 |
62349 |
907106 |
|
0.06 |
0.09 |
-0.04 |
0.15 |
0.03 |
|
cytosolic non-specific dipeptidase |
| 68131553 |
|
Cnih4 |
|
0 |
0 |
26 |
1293 |
0 |
|
n.v. |
n.v. |
-0.29 |
-0.26 |
n.v. |
|
protein cornichon homolog 4 |
| 27369772 |
|
Cnksr3 |
|
0 |
29 |
721 |
0 |
0 |
|
n.v. |
0.55 |
-0.1 |
n.v. |
n.v. |
|
connector enhancer of kinase suppressor of ras 3 |
| 6680952 |
|
Cnn2 |
|
0 |
2806 |
6668 |
909 |
40289 |
|
n.v. |
0.31 |
0.19 |
0.1 |
0.29 |
|
calponin-2 |
| 21312564 |
|
Cnn3 |
|
0 |
3298 |
19906 |
24074 |
148477 |
|
n.v. |
0.1 |
0.08 |
0.14 |
0.06 |
|
calponin-3 |
| 156447046 |
|
Cnnm2 |
|
0 |
0 |
9 |
0 |
0 |
|
n.v. |
n.v. |
0.15 |
n.v. |
n.v. |
|
metal transporter CNNM2 isoform a |
| 156447048 |
|
Cnnm2 |
|
0 |
0 |
9 |
0 |
0 |
|
n.v. |
n.v. |
0.15 |
n.v. |
n.v. |
|
metal transporter CNNM2 isoform b |
| 88196782 |
|
Cnnm3 |
|
0 |
0 |
15 |
0 |
0 |
|
n.v. |
n.v. |
0.49 |
n.v. |
n.v. |
|
metal transporter CNNM3 isoform 1 precursor |
| 88196784 |
|
Cnnm3 |
|
0 |
0 |
15 |
0 |
0 |
|
n.v. |
n.v. |
0.49 |
n.v. |
n.v. |
|
metal transporter CNNM3 isoform 2 precursor |
| 189458844 |
|
Cnot1 |
|
2801 |
6688 |
61976 |
7261 |
1039 |
|
-0.08 |
0.2 |
0.15 |
0.17 |
0.37 |
|
CCR4-NOT transcription complex subunit 1 isoform 2 |
| 327315389 |
|
Cnot1 |
|
2801 |
6688 |
61976 |
7261 |
1039 |
|
-0.08 |
0.2 |
0.15 |
0.17 |
0.37 |
|
CCR4-NOT transcription complex subunit 1 isoform 1 |
| 327315392 |
|
Cnot1 |
|
2801 |
6688 |
61976 |
7261 |
1039 |
|
-0.08 |
0.2 |
0.15 |
0.17 |
0.37 |
|
CCR4-NOT transcription complex subunit 1 isoform 3 |
| 31324571 |
|
Cnot10 |
|
0 |
491 |
13679 |
4518 |
0 |
|
n.v. |
-0.03 |
0.17 |
0.05 |
n.v. |
|
CCR4-NOT transcription complex subunit 10 |
| 26553441 |
|
Cnot11 |
|
0 |
96 |
1121 |
638 |
0 |
|
n.v. |
0.05 |
0.14 |
-0.14 |
n.v. |
|
CCR4-NOT transcription complex subunit 11 |
| 210147539 |
|
Cnot2 |
|
0 |
0 |
3904 |
557 |
0 |
|
n.v. |
n.v. |
0.28 |
0.67 |
n.v. |
|
CCR4-NOT transcription complex subunit 2 isoform d |
| 210147541 |
|
Cnot2 |
|
0 |
0 |
3904 |
557 |
0 |
|
n.v. |
n.v. |
0.28 |
0.67 |
n.v. |
|
CCR4-NOT transcription complex subunit 2 isoform b |
| 211065515 |
|
Cnot2 |
|
0 |
0 |
3904 |
557 |
0 |
|
n.v. |
n.v. |
0.28 |
0.67 |
n.v. |
|
CCR4-NOT transcription complex subunit 2 isoform a |
| 22122717 |
|
Cnot3 |
|
0 |
0 |
508 |
0 |
0 |
|
n.v. |
n.v. |
0.29 |
n.v. |
n.v. |
|
CCR4-NOT transcription complex subunit 3 |
| 47059015 |
|
Cnot6 |
|
0 |
0 |
1225 |
0 |
0 |
|
n.v. |
n.v. |
0.26 |
n.v. |
n.v. |
|
CCR4-NOT transcription complex subunit 6 |
| 121674807 |
|
Cnot6l |
|
0 |
0 |
954 |
0 |
0 |
|
n.v. |
n.v. |
0.33 |
n.v. |
n.v. |
|
CCR4-NOT transcription complex subunit 6-like isoform
2 |
| 21450299 |
|
Cnot6l |
|
0 |
0 |
954 |
0 |
0 |
|
n.v. |
n.v. |
0.33 |
n.v. |
n.v. |
|
CCR4-NOT transcription complex subunit 6-like isoform
1 |
| 408968125 |
|
Cnot7 |
|
366 |
797 |
2575 |
6311 |
0 |
|
0.16 |
0.12 |
0.23 |
0.02 |
n.v. |
|
CCR4-NOT transcription complex subunit 7 isoform 2 |
| 6755126 |
|
Cnot7 |
|
366 |
879 |
2789 |
8448 |
0 |
|
0.16 |
0.08 |
0.25 |
-0.04 |
n.v. |
|
CCR4-NOT transcription complex subunit 7 isoform 1 |
| 13386186 |
|
Cnot8 |
|
0 |
0 |
606 |
499 |
0 |
|
n.v. |
n.v. |
0.01 |
0.52 |
n.v. |
|
CCR4-NOT transcription complex subunit 8 |
| 226423907 |
|
Cnp |
|
0 |
4897 |
8244 |
0 |
0 |
|
n.v. |
-0.14 |
-0.07 |
n.v. |
n.v. |
|
2',3'-cyclic-nucleotide 3'-phosphodiesterase isoform 2 |
| 226423909 |
|
Cnp |
|
0 |
4897 |
8244 |
0 |
0 |
|
n.v. |
-0.14 |
-0.07 |
n.v. |
n.v. |
|
2',3'-cyclic-nucleotide 3'-phosphodiesterase isoform 1 |
| 9903607 |
|
Cnpy2 |
|
48310 |
5342 |
6279 |
0 |
14404 |
|
0.03 |
-0.18 |
-0.23 |
n.v. |
-0.38 |
|
protein canopy homolog 2 precursor |
| 21312510 |
|
Cnpy3 |
|
531 |
357 |
0 |
0 |
0 |
|
0.06 |
-0.29 |
n.v. |
n.v. |
n.v. |
|
protein canopy homolog 3 precursor |
| 30519939 |
|
Cnpy4 |
|
1629 |
737 |
180 |
0 |
1349 |
|
0.27 |
-0.43 |
-0.49 |
n.v. |
-0.52 |
|
protein canopy homolog 4 precursor |
| 21311867 |
|
Coa3 |
|
3606 |
3845 |
51 |
0 |
0 |
|
0.11 |
-0.2 |
-0.62 |
n.v. |
n.v. |
|
cytochrome C oxidase assembly factor 3 homolog,
mitochondrial |
| 30424683 |
|
Coa6 |
|
476 |
718 |
0 |
0 |
171 |
|
-0.47 |
-0.12 |
n.v. |
n.v. |
-0.19 |
|
cytochrome c oxidase assembly factor 6 homolog |
| 27229125 |
|
Coasy |
|
0 |
825 |
348 |
4690 |
9135 |
|
n.v. |
-0.04 |
0.15 |
0.25 |
0.37 |
|
bifunctional coenzyme A synthase precursor |
| 162135966 |
|
Cobl |
|
0 |
0 |
7077 |
0 |
0 |
|
n.v. |
n.v. |
-0.35 |
n.v. |
n.v. |
|
protein cordon-bleu |
| 189458847 |
|
Cobll1 |
|
0 |
2 |
8613 |
28633 |
9071 |
|
n.v. |
1.97 |
0.36 |
0.03 |
-1.08 |
|
cordon-bleu protein-like 1 isoform 2 |
| 32441279 |
|
Cobll1 |
|
0 |
2 |
8613 |
28633 |
9071 |
|
n.v. |
1.97 |
0.36 |
0.03 |
-1.08 |
|
cordon-bleu protein-like 1 isoform 1 |
| 159110754 |
|
Cog1 |
|
0 |
111 |
416 |
1383 |
0 |
|
n.v. |
0.1 |
-0.14 |
0.19 |
n.v. |
|
conserved oligomeric Golgi complex subunit 1 |
| 256985208 |
|
Cog2 |
|
0 |
633 |
271 |
13310 |
1810 |
|
n.v. |
-0.05 |
-0.24 |
0.15 |
-0.02 |
|
conserved oligomeric Golgi complex subunit 2 |
| 119392070 |
|
Cog3 |
|
0 |
633 |
0 |
15937 |
867 |
|
n.v. |
-0.09 |
n.v. |
-0.01 |
0.82 |
|
conserved oligomeric Golgi complex subunit 3 |
| 19527194 |
|
Cog4 |
|
0 |
15 |
1333 |
17902 |
589 |
|
n.v. |
0.24 |
0.21 |
0.13 |
0.47 |
|
conserved oligomeric Golgi complex subunit 4 |
| 253314464 |
|
Cog5 |
|
3661 |
163 |
3287 |
25793 |
4916 |
|
0.14 |
-0.02 |
-0.07 |
-0.15 |
0.13 |
|
conserved oligomeric Golgi complex subunit 5 |
| 160333744 |
|
Cog6 |
|
0 |
1163 |
179 |
19105 |
857 |
|
n.v. |
-0.84 |
-0.08 |
-0.06 |
-0.05 |
|
conserved oligomeric Golgi complex subunit 6 |
| 110625631 |
|
Cog7 |
|
0 |
633 |
1760 |
17730 |
5301 |
|
n.v. |
-0.08 |
-0.12 |
0.13 |
-1.26 |
|
conserved oligomeric Golgi complex subunit 7 |
| 66392581 |
|
Cog8 |
|
0 |
0 |
0 |
3684 |
0 |
|
n.v. |
n.v. |
n.v. |
0.01 |
n.v. |
|
conserved oligomeric Golgi complex subunit 8 |
| 134053929 |
|
Coil |
|
0 |
0 |
12 |
0 |
0 |
|
n.v. |
n.v. |
0.05 |
n.v. |
n.v. |
|
coilin |
| 158508560 |
|
Col18a1 |
|
0 |
1219 |
1918 |
0 |
0 |
|
n.v. |
0 |
-0.33 |
n.v. |
n.v. |
|
collagen alpha-1(XVIII) chain isoform 1 precursor |
| 40789282 |
|
Col18a1 |
|
0 |
1219 |
1918 |
0 |
0 |
|
n.v. |
0 |
-0.33 |
n.v. |
n.v. |
|
collagen alpha-1(XVIII) chain isoform 2 precursor |
| 12963671 |
|
Col4a3bp |
|
0 |
0 |
0 |
0 |
4112 |
|
n.v. |
n.v. |
n.v. |
n.v. |
0 |
|
collagen type IV alpha-3-binding protein isoform 1 |
| 255982524 |
|
Col4a3bp |
|
0 |
0 |
0 |
0 |
4112 |
|
n.v. |
n.v. |
n.v. |
n.v. |
0 |
|
collagen type IV alpha-3-binding protein isoform 2 |
| 84452161 |
|
Commd1 |
|
0 |
518 |
1261 |
5100 |
4359 |
|
n.v. |
0.08 |
-0.04 |
0.29 |
0.15 |
|
COMM domain-containing protein 1 |
| 30410016 |
|
Commd10 |
|
0 |
470 |
717 |
3397 |
2945 |
|
n.v. |
-0.09 |
-0.28 |
0.2 |
0.1 |
|
COMM domain-containing protein 10 |
| 110626003 |
|
Commd2 |
|
0 |
1380 |
1608 |
10297 |
7936 |
|
n.v. |
-0.11 |
-0.19 |
0.09 |
-0.09 |
|
COMM domain-containing protein 2 |
| 22296603 |
|
Commd3 |
|
732 |
1257 |
2196 |
6205 |
7786 |
|
-0.35 |
-0.08 |
-0.16 |
-0.01 |
0.1 |
|
COMM domain-containing protein 3 |
| 13384806 |
|
Commd4 |
|
0 |
875 |
293 |
598 |
1788 |
|
n.v. |
0 |
-0.22 |
0.12 |
-0.06 |
|
COMM domain-containing protein 4 |
| 21313478 |
|
Commd5 |
|
0 |
1424 |
278 |
7948 |
1660 |
|
n.v. |
-0.53 |
-0.59 |
0.17 |
-0.31 |
|
COMM domain-containing protein 5 |
| 274319665 |
|
Commd6 |
|
0 |
65 |
445 |
74 |
396 |
|
n.v. |
-0.37 |
-0.03 |
0.23 |
0.16 |
|
COMM domain-containing protein 6 isoform 2 |
| 84370278 |
|
Commd6 |
|
0 |
65 |
473 |
74 |
471 |
|
n.v. |
-0.37 |
-0.06 |
0.23 |
0.46 |
|
COMM domain-containing protein 6 isoform 1 |
| 306035198 |
|
Commd7 |
|
0 |
1232 |
979 |
10297 |
2592 |
|
n.v. |
0 |
-0.31 |
-0.08 |
0.22 |
|
COMM domain-containing protein 7 isoform 1 |
| 306035200 |
|
Commd7 |
|
0 |
1232 |
979 |
7711 |
2592 |
|
n.v. |
0 |
-0.31 |
0.03 |
0.22 |
|
COMM domain-containing protein 7 isoform 2 |
| 21313224 |
|
Commd9 |
|
0 |
61 |
793 |
941 |
2517 |
|
n.v. |
-0.11 |
0 |
0.3 |
0.09 |
|
COMM domain-containing protein 9 |
| 161484634 |
|
Comt |
|
8256 |
7156 |
6847 |
1744 |
41639 |
|
-0.04 |
-0.2 |
-0.16 |
-0.28 |
0.16 |
|
catechol O-methyltransferase |
| 33468999 |
|
Comtd1 |
|
4851 |
2252 |
306 |
0 |
0 |
|
-0.01 |
-0.46 |
-0.47 |
n.v. |
n.v. |
|
catechol O-methyltransferase domain-containing protein
1 |
| 226823359 |
|
Copa |
|
32823 |
2355 |
28694 |
345562 |
44048 |
|
0.02 |
-0.1 |
-0.07 |
-0.01 |
-0.04 |
|
coatomer subunit alpha |
| 15426055 |
|
Copb1 |
|
63888 |
11172 |
18826 |
189807 |
10378 |
|
0.06 |
0.1 |
-0.05 |
0.05 |
-0.12 |
|
coatomer subunit beta |
| 29789080 |
|
Copb2 |
|
13766 |
15792 |
35174 |
181654 |
18602 |
|
0.31 |
0.12 |
-0.06 |
0 |
-0.25 |
|
coatomer subunit beta' |
| 10946972 |
|
Cope |
|
11679 |
13356 |
2302 |
64363 |
9821 |
|
0.02 |
0.06 |
-0.01 |
0.11 |
-0.18 |
|
coatomer subunit epsilon |
| 47059163 |
|
Copg1 |
|
0 |
520 |
1193 |
16502 |
7529 |
|
n.v. |
0.25 |
-0.09 |
0.11 |
-0.14 |
|
coatomer subunit gamma-1 isoform 2 |
| 8567338 |
|
Copg1 |
|
21601 |
5075 |
8057 |
128112 |
11438 |
|
-0.08 |
0.05 |
-0.05 |
-0.03 |
-0.12 |
|
coatomer subunit gamma-1 isoform 1 |
| 8567340 |
|
Copg2 |
|
17995 |
4651 |
8748 |
60434 |
4841 |
|
0.09 |
0.06 |
-0.07 |
0.09 |
-0.01 |
|
coatomer subunit gamma-2 |
| 70909327 |
|
Cops2 |
|
0 |
1756 |
253 |
99103 |
19716 |
|
n.v. |
0.2 |
0 |
0.02 |
-0.07 |
|
COP9 signalosome complex subunit 2 |
| 6753488 |
|
Cops3 |
|
0 |
789 |
2726 |
67326 |
22533 |
|
n.v. |
0.15 |
-0.04 |
0.14 |
-0.19 |
|
COP9 signalosome complex subunit 3 |
| 6753490 |
|
Cops4 |
|
0 |
5958 |
5688 |
132917 |
90913 |
|
n.v. |
0.02 |
-0.05 |
0.08 |
-0.22 |
|
COP9 signalosome complex subunit 4 |
| 459447369 |
|
Cops5 |
|
0 |
2545 |
594 |
0 |
0 |
|
n.v. |
0.17 |
0.16 |
n.v. |
n.v. |
|
COP9 signalosome complex subunit 5 isoform 2 |
| 7304971 |
|
Cops5 |
|
0 |
3580 |
3126 |
69184 |
16161 |
|
n.v. |
0.17 |
0.05 |
0.06 |
-0.07 |
|
COP9 signalosome complex subunit 5 isoform 1 |
| 33563284 |
|
Cops6 |
|
0 |
3639 |
2365 |
43072 |
30019 |
|
n.v. |
0.2 |
0.01 |
0.14 |
-0.01 |
|
COP9 signalosome complex subunit 6 |
| 255760052 |
|
Cops7a |
|
0 |
2100 |
2066 |
25809 |
17328 |
|
n.v. |
0.18 |
0.02 |
0.03 |
-0.1 |
|
COP9 signalosome complex subunit 7a isoform 2 |
| 7242142 |
|
Cops7a |
|
0 |
2100 |
2066 |
33896 |
17328 |
|
n.v. |
0.18 |
0.02 |
0.03 |
-0.1 |
|
COP9 signalosome complex subunit 7a isoform 1 |
| 27764886 |
|
Cops7b |
|
0 |
102 |
0 |
6360 |
2367 |
|
n.v. |
-0.18 |
n.v. |
0.09 |
-0.32 |
|
COP9 signalosome complex subunit 7b |
| 114158691 |
|
Cops8 |
|
1410 |
2367 |
1253 |
18057 |
10795 |
|
-0.87 |
-0.08 |
-0.06 |
0.05 |
-0.14 |
|
COP9 signalosome complex subunit 8 |
| 9789913 |
|
Copz1 |
|
11295 |
4221 |
2325 |
19072 |
25242 |
|
-0.04 |
0.04 |
-0.09 |
0.24 |
-0.08 |
|
coatomer subunit zeta-1 |
| 9845242 |
|
Copz2 |
|
0 |
0 |
54 |
90 |
1349 |
|
n.v. |
n.v. |
0.17 |
0.01 |
-0.09 |
|
coatomer subunit zeta-2 |
| 27369992 |
|
Coq3 |
|
0 |
1025 |
0 |
0 |
0 |
|
n.v. |
-0.12 |
n.v. |
n.v. |
n.v. |
|
hexaprenyldihydroxybenzoate methyltransferase,
mitochondrial |
| 30520093 |
|
Coq4 |
|
0 |
236 |
0 |
0 |
0 |
|
n.v. |
-0.09 |
n.v. |
n.v. |
n.v. |
|
ubiquinone biosynthesis protein COQ4 homolog,
mitochondrial precursor |
| 13385992 |
|
Coq5 |
|
0 |
213 |
0 |
0 |
0 |
|
n.v. |
-0.42 |
n.v. |
n.v. |
n.v. |
|
2-methoxy-6-polyprenyl-1,4-benzoquinol methylase,
mitochondrial precursor |
| 283135186 |
|
Coq6 |
|
0 |
0 |
18 |
0 |
0 |
|
n.v. |
n.v. |
-0.36 |
n.v. |
n.v. |
|
ubiquinone biosynthesis monooxygenase COQ6 precursor |
| 20587962 |
|
Coq7 |
|
0 |
117 |
0 |
0 |
0 |
|
n.v. |
-0.26 |
n.v. |
n.v. |
n.v. |
|
ubiquinone biosynthesis protein COQ7 homolog |
| 33859690 |
|
Coq9 |
|
6133 |
739 |
0 |
0 |
311 |
|
-2.47 |
0.07 |
n.v. |
n.v. |
-1.04 |
|
ubiquinone biosynthesis protein COQ9, mitochondrial
precursor |
| 6753494 |
|
Coro1b |
|
25702 |
5380 |
21353 |
82862 |
127497 |
|
0.15 |
0.06 |
-0.02 |
0.11 |
-0.07 |
|
coronin-1B |
| 31542413 |
|
Coro1c |
|
3368 |
2207 |
2691 |
4617 |
5044 |
|
-0.1 |
0.17 |
0.09 |
-0.19 |
-0.14 |
|
coronin-1C |
| 258645152 |
|
Coro2a |
|
0 |
265 |
1335 |
6819 |
0 |
|
n.v. |
0.49 |
-0.21 |
0.08 |
n.v. |
|
coronin-2A isoform 2 |
| 404501474 |
|
Coro2a |
|
0 |
265 |
1335 |
6819 |
0 |
|
n.v. |
0.49 |
-0.21 |
0.08 |
n.v. |
|
coronin-2A isoform 1 |
| 148747331 |
|
Coro7 |
|
0 |
194 |
1485 |
5525 |
33596 |
|
n.v. |
0.5 |
0.09 |
0.17 |
0.18 |
|
coronin-7 |
| 19482160 |
|
Cotl1 |
|
0 |
582 |
2571 |
753 |
39261 |
|
n.v. |
0.27 |
0.02 |
0.28 |
0.11 |
|
coactosin-like protein |
| 167716839 |
|
COX1 |
|
3680 |
1008 |
0 |
0 |
0 |
|
-0.02 |
-0.02 |
n.v. |
n.v. |
n.v. |
|
cytochrome c oxidase subunit Imusculus |
| 34538600 |
|
COX1 |
|
3680 |
1008 |
0 |
0 |
0 |
|
-0.02 |
-0.02 |
n.v. |
n.v. |
n.v. |
|
cytochrome c oxidase subunit I |
| 39841021 |
|
Cox11 |
|
0 |
104 |
0 |
0 |
0 |
|
n.v. |
0.39 |
n.v. |
n.v. |
n.v. |
|
cytochrome c oxidase assembly protein COX11,
mitochondrial |
| 31541932 |
|
Cox15 |
|
0 |
1386 |
0 |
0 |
0 |
|
n.v. |
0.14 |
n.v. |
n.v. |
n.v. |
|
cytochrome c oxidase assembly protein COX15 homolog |
| 13384872 |
|
Cox16 |
|
238 |
0 |
0 |
0 |
0 |
|
0.04 |
n.v. |
n.v. |
n.v. |
n.v. |
|
cytochrome c oxidase assembly protein COX16 homolog,
mitochondrial |
| 62945234 |
|
Cox17 |
|
384 |
65 |
1 |
0 |
11 |
|
0.12 |
0.17 |
0.21 |
n.v. |
0.58 |
|
cytochrome c oxidase copper chaperone |
| 167716840 |
|
COX2 |
|
248779 |
115627 |
5707 |
1048 |
0 |
|
0.02 |
-0.13 |
-0.32 |
-0.19 |
n.v. |
|
cytochrome c oxidase subunit IImusculus |
| 34538601 |
|
COX2 |
|
249767 |
115627 |
5707 |
1048 |
0 |
|
0.02 |
-0.13 |
-0.32 |
-0.19 |
n.v. |
|
cytochrome c oxidase subunit II |
| 21313516 |
|
Cox20 |
|
1556 |
288 |
18 |
0 |
0 |
|
-0.17 |
-0.25 |
-0.69 |
n.v. |
n.v. |
|
cytochrome c oxidase protein 20 homolog |
| 226453481 |
|
COX3 |
|
3954 |
92 |
10 |
0 |
0 |
|
0 |
-0.09 |
-0.55 |
n.v. |
n.v. |
|
cytochrome c oxidase subunit IIImusculus castaneus] |
| 34538604 |
|
COX3 |
|
3954 |
92 |
10 |
0 |
0 |
|
0 |
-0.09 |
-0.55 |
n.v. |
n.v. |
|
cytochrome c oxidase subunit III |
| 6753498 |
|
Cox4i1 |
|
118989 |
37569 |
14569 |
2210 |
0 |
|
0.01 |
-0.05 |
-0.32 |
-0.25 |
n.v. |
|
cytochrome c oxidase subunit 4 isoform 1, mitochondrial
precursor |
| 112181182 |
|
Cox5a |
|
46351 |
4298 |
5461 |
0 |
0 |
|
0.02 |
-0.13 |
-0.28 |
n.v. |
n.v. |
|
cytochrome c oxidase subunit 5A, mitochondrial
precursor |
| 13385090 |
|
Cox6b1 |
|
30809 |
10289 |
2391 |
0 |
0 |
|
0 |
-0.06 |
-0.33 |
n.v. |
n.v. |
|
cytochrome c oxidase subunit 6B1 |
| 16716343 |
|
Cox6c |
|
108848 |
20439 |
6509 |
0 |
0 |
|
-0.02 |
-0.02 |
-0.33 |
n.v. |
n.v. |
|
cytochrome c oxidase subunit 6C |
| 31981830 |
|
Cox7a2 |
|
38003 |
13995 |
4991 |
0 |
0 |
|
-0.1 |
-0.11 |
-0.47 |
n.v. |
n.v. |
|
cytochrome c oxidase subunit 7A2, mitochondrial
precursor |
| 226958512 |
|
Cox7a2l |
|
256 |
332 |
135 |
0 |
0 |
|
0.12 |
0.03 |
-0.29 |
n.v. |
n.v. |
|
cytochrome c oxidase subunit 7A-related protein,
mitochondrial isoform 1 |
| 6677977 |
|
Cox7a2l |
|
256 |
332 |
135 |
0 |
0 |
|
0.12 |
0.03 |
-0.29 |
n.v. |
n.v. |
|
cytochrome c oxidase subunit 7A-related protein,
mitochondrial isoform 2 |
| 13384754 |
|
Cox7b |
|
0 |
0 |
12 |
0 |
0 |
|
n.v. |
n.v. |
-0.19 |
n.v. |
n.v. |
|
cytochrome c oxidase subunit 7B, mitochondrial
precursor |
| 150378501 |
|
Cpd |
|
0 |
10465 |
16243 |
778 |
0 |
|
n.v. |
-0.18 |
-0.03 |
-0.14 |
n.v. |
|
carboxypeptidase D precursor |
| 22203763 |
|
Cpe |
|
0 |
0 |
399 |
0 |
0 |
|
n.v. |
n.v. |
-1.16 |
n.v. |
n.v. |
|
carboxypeptidase E precursor |
| 293651586 |
|
Cpeb2 |
|
0 |
0 |
32 |
0 |
0 |
|
n.v. |
n.v. |
0.76 |
n.v. |
n.v. |
|
cytoplasmic polyadenylation element-binding protein 2
isoform 1 |
| 293651589 |
|
Cpeb2 |
|
0 |
0 |
32 |
0 |
0 |
|
n.v. |
n.v. |
0.76 |
n.v. |
n.v. |
|
cytoplasmic polyadenylation element-binding protein 2
isoform 2 |
| 84370380 |
|
Cpeb3 |
|
0 |
0 |
32 |
0 |
0 |
|
n.v. |
n.v. |
0.76 |
n.v. |
n.v. |
|
cytoplasmic polyadenylation element-binding protein
3 |
| 52138749 |
|
Cpeb4 |
|
0 |
0 |
32 |
0 |
0 |
|
n.v. |
n.v. |
0.76 |
n.v. |
n.v. |
|
cytoplasmic polyadenylation element-binding protein
4 |
| 189458849 |
|
Cpm |
|
0 |
378 |
1266 |
0 |
0 |
|
n.v. |
-0.84 |
-0.62 |
n.v. |
n.v. |
|
carboxypeptidase M precursor |
| 25141330 |
|
Cpne1 |
|
769 |
2875 |
8903 |
794 |
21880 |
|
0.08 |
-0.04 |
-0.11 |
0.11 |
-0.07 |
|
copine-1 |
| 23943807 |
|
Cpne2 |
|
1666 |
5778 |
13085 |
3487 |
1692 |
|
0.09 |
0.2 |
-0.04 |
0.07 |
-0.02 |
|
copine-2 |
| 25141335 |
|
Cpne3 |
|
1666 |
4793 |
16323 |
4183 |
28851 |
|
0.09 |
0.01 |
-0.05 |
0.06 |
-0.01 |
|
copine-3 |
| 58037333 |
|
Cpne4 |
|
1666 |
3666 |
3243 |
1907 |
1692 |
|
0.09 |
0 |
-0.06 |
0.22 |
-0.02 |
|
copine-4 |
| 23346611 |
|
Cpne5 |
|
1666 |
3666 |
4904 |
1907 |
1692 |
|
0.09 |
0 |
-0.06 |
0.22 |
-0.02 |
|
copine-5 |
| 226052679 |
|
Cpne6 |
|
1666 |
3666 |
3243 |
1907 |
1692 |
|
0.09 |
0 |
-0.06 |
0.22 |
-0.02 |
|
copine-6 isoform b |
| 6753510 |
|
Cpne6 |
|
1666 |
3666 |
3243 |
1907 |
1692 |
|
0.09 |
0 |
-0.06 |
0.22 |
-0.02 |
|
copine-6 isoform a |
| 25470894 |
|
Cpne7 |
|
1666 |
3666 |
3243 |
1907 |
1692 |
|
0.09 |
0 |
-0.06 |
0.22 |
-0.02 |
|
copine-7 |
| 76563928 |
|
Cpne8 |
|
0 |
802 |
59 |
0 |
0 |
|
n.v. |
-0.27 |
-0.14 |
n.v. |
n.v. |
|
copine-8 isoform 2 |
| 21630253 |
|
Cpne8 |
|
1666 |
7653 |
7939 |
2104 |
1692 |
|
0.09 |
-0.08 |
-0.21 |
-0.07 |
-0.02 |
|
copine-8 isoform 1 |
| 28416905 |
|
Cpne9 |
|
1666 |
3666 |
4904 |
1907 |
1692 |
|
0.09 |
0 |
-0.06 |
0.22 |
-0.02 |
|
copine-9 |
| 161484660 |
|
Cpox |
|
18471 |
4192 |
246 |
0 |
2677 |
|
0.12 |
-0.13 |
-0.17 |
n.v. |
-0.21 |
|
coproporphyrinogen-III oxidase, mitochondrial precursor |
| 31981882 |
|
Cpped1 |
|
0 |
0 |
0 |
0 |
24450 |
|
n.v. |
n.v. |
n.v. |
n.v. |
-0.05 |
|
calcineurin-like phosphoesterase domain-containing
protein 1 |
| 124248512 |
|
Cps1 |
|
0 |
0 |
0 |
0 |
1253 |
|
n.v. |
n.v. |
n.v. |
n.v. |
-0.03 |
|
carbamoyl-phosphate synthase [ammonia], mitochondrial
precursor |
| 16751835 |
|
Cpsf1 |
|
3020 |
0 |
50 |
0 |
0 |
|
0 |
n.v. |
0.1 |
n.v. |
n.v. |
|
cleavage and polyadenylation specificity factor subunit 1
isoform 2 |
| 255918233 |
|
Cpsf1 |
|
1831 |
0 |
50 |
0 |
0 |
|
0.14 |
n.v. |
0.1 |
n.v. |
n.v. |
|
cleavage and polyadenylation specificity factor subunit 1
isoform 1 |
| 8393762 |
|
Cpsf2 |
|
1263 |
0 |
18 |
303 |
8461 |
|
-0.15 |
n.v. |
-0.57 |
1.43 |
-0.12 |
|
cleavage and polyadenylation specificity factor subunit
2 |
| 31980904 |
|
Cpsf3 |
|
0 |
0 |
378 |
3520 |
4723 |
|
n.v. |
-0.1 |
0.11 |
0.11 |
0.03 |
|
cleavage and polyadenylation specificity factor subunit
3 |
| 21312614 |
|
Cpsf3l |
|
0 |
0 |
0 |
2759 |
0 |
|
n.v. |
n.v. |
n.v. |
0.03 |
n.v. |
|
integrator complex subunit 11 |
| 62909983 |
|
Cpsf6 |
|
4577 |
1971 |
4896 |
5059 |
2056 |
|
0.13 |
0.02 |
-0.11 |
-0.14 |
-0.3 |
|
cleavage and polyadenylation specificity factor subunit
6 |
| 256665243 |
|
Cpsf7 |
|
8402 |
0 |
2188 |
5157 |
0 |
|
0.25 |
n.v. |
-0.06 |
0.13 |
n.v. |
|
cleavage and polyadenylation specificity factor subunit 7
isoform 1 |
| 256665245 |
|
Cpsf7 |
|
8402 |
0 |
2188 |
5157 |
0 |
|
0.25 |
n.v. |
-0.06 |
0.13 |
n.v. |
|
cleavage and polyadenylation specificity factor subunit 7
isoform 2 |
| 162287142 |
|
Cpt1a |
|
85745 |
41001 |
13329 |
638 |
0 |
|
-0.14 |
-0.18 |
-0.32 |
-0.75 |
n.v. |
|
carnitine O-palmitoyltransferase 1, liver isoform |
| 162287165 |
|
Cpt1b |
|
0 |
1230 |
3710 |
638 |
0 |
|
n.v. |
-0.27 |
-0.36 |
-0.75 |
n.v. |
|
carnitine O-palmitoyltransferase 1, muscle isoform |
| 162138915 |
|
Cpt2 |
|
4155 |
6557 |
0 |
0 |
0 |
|
-0.72 |
-0.21 |
n.v. |
n.v. |
n.v. |
|
carnitine O-palmitoyltransferase 2, mitochondrial
precursor |
| 52426750 |
|
Cr1l |
|
0 |
29 |
3794 |
0 |
0 |
|
n.v. |
0.61 |
-0.23 |
n.v. |
n.v. |
|
complement component receptor 1-like protein |
| 7304975 |
|
Crabp1 |
|
0 |
0 |
0 |
0 |
41371 |
|
n.v. |
n.v. |
n.v. |
n.v. |
-0.05 |
|
cellular retinoic acid-binding protein 1 |
| 33469075 |
|
Crabp2 |
|
0 |
8751 |
15960 |
13482 |
121810 |
|
n.v. |
0.18 |
0.05 |
0.12 |
0.09 |
|
cellular retinoic acid-binding protein 2 |
| 85662408 |
|
Crat |
|
0 |
969 |
0 |
0 |
0 |
|
n.v. |
-0.5 |
n.v. |
n.v. |
n.v. |
|
carnitine O-acetyltransferase |
| 29244038 |
|
Crb3 |
|
0 |
42 |
202 |
0 |
0 |
|
n.v. |
0.21 |
0.03 |
n.v. |
n.v. |
|
crumbs protein homolog 3 precursor |
| 28202023 |
|
Crbn |
|
3661 |
668 |
5201 |
6917 |
17360 |
|
-0.03 |
0.19 |
-0.04 |
0.08 |
0.1 |
|
protein cereblon isoform 2 |
| 90403612 |
|
Crbn |
|
3661 |
668 |
5201 |
6917 |
17360 |
|
-0.03 |
0.19 |
-0.04 |
0.08 |
0.1 |
|
protein cereblon isoform 1 |
| 70995311 |
|
Crebbp |
|
0 |
4 |
69 |
606 |
1510 |
|
n.v. |
-0.46 |
-0.08 |
-0.1 |
-0.05 |
|
CREB-binding protein |
| 19527148 |
|
Creld1 |
|
0 |
0 |
212 |
0 |
0 |
|
n.v. |
n.v. |
-0.4 |
n.v. |
n.v. |
|
cysteine-rich with EGF-like domain protein 1
precursor |
| 21313278 |
|
Creld2 |
|
1483 |
2889 |
38 |
0 |
3577 |
|
-1.68 |
-0.19 |
-0.53 |
n.v. |
-0.43 |
|
cysteine-rich with EGF-like domain protein 2
precursor |
| 6681015 |
|
Crip1 |
|
0 |
0 |
240 |
0 |
8021 |
|
n.v. |
n.v. |
0.17 |
n.v. |
0.17 |
|
cysteine-rich protein 1 |
| 13195646 |
|
Crip2 |
|
0 |
591 |
2393 |
0 |
86801 |
|
n.v. |
-0.19 |
-0.42 |
n.v. |
0.08 |
|
cysteine-rich protein 2 |
| 31559995 |
|
Crk |
|
0 |
0 |
211 |
0 |
19738 |
|
n.v. |
n.v. |
-0.19 |
n.v. |
0.16 |
|
adapter molecule crk |
| 31542421 |
|
Crkl |
|
0 |
0 |
230 |
0 |
39133 |
|
n.v. |
n.v. |
-0.02 |
n.v. |
0.13 |
|
crk-like protein isoform 1 |
| 9055200 |
|
Crlf3 |
|
0 |
0 |
0 |
0 |
12391 |
|
n.v. |
n.v. |
n.v. |
n.v. |
0.12 |
|
cytokine receptor-like factor 3 |
| 66932980 |
|
Crls1 |
|
0 |
100 |
0 |
0 |
0 |
|
n.v. |
-0.27 |
n.v. |
n.v. |
n.v. |
|
cardiolipin synthase isoform 1 |
| 209862923 |
|
Crmp1 |
|
0 |
1238 |
8736 |
32390 |
9574 |
|
n.v. |
0.41 |
0.03 |
0.32 |
0.25 |
|
dihydropyrimidinase-related protein 1 isoform 1 |
| 40068507 |
|
Crmp1 |
|
0 |
1238 |
8736 |
32390 |
9574 |
|
n.v. |
0.41 |
0.03 |
0.32 |
0.25 |
|
dihydropyrimidinase-related protein 1 isoform 2 |
| 13385288 |
|
Crnkl1 |
|
9391 |
17 |
758 |
6262 |
643 |
|
-0.34 |
1.13 |
0.08 |
0.11 |
-0.08 |
|
crooked neck-like protein 1 |
| 225543191 |
|
Crocc |
|
78514 |
4684 |
58553 |
30671 |
18795 |
|
0.04 |
-0.07 |
-0.39 |
-0.07 |
0 |
|
rootletin isoform 1 |
| 225543193 |
|
Crocc |
|
78514 |
4684 |
58553 |
30671 |
18795 |
|
0.04 |
-0.07 |
-0.39 |
-0.07 |
0 |
|
rootletin isoform 2 |
| 17157983 |
|
Crot |
|
15524 |
4478 |
6566 |
647 |
5408 |
|
0.05 |
-0.05 |
-0.14 |
0.34 |
0.16 |
|
peroxisomal carnitine O-octanoyltransferase |
| 225543173 |
|
Crtap |
|
0 |
395 |
0 |
0 |
0 |
|
n.v. |
-2.52 |
n.v. |
n.v. |
n.v. |
|
cartilage-associated protein precursor |
| 6681031 |
|
Cry1 |
|
3039 |
0 |
546 |
0 |
0 |
|
-0.08 |
n.v. |
-0.21 |
n.v. |
n.v. |
|
cryptochrome-1 |
| 27312016 |
|
Cry2 |
|
0 |
0 |
0 |
467 |
278 |
|
n.v. |
n.v. |
n.v. |
0.05 |
-0.16 |
|
cryptochrome-2 |
| 6753530 |
|
Cryab |
|
0 |
424 |
972 |
28240 |
3566 |
|
n.v. |
0.01 |
0.49 |
0.54 |
0.27 |
|
alpha-crystallin B chain |
| 19525729 |
|
Cryl1 |
|
0 |
466 |
395 |
0 |
16289 |
|
n.v. |
0.31 |
-0.01 |
n.v. |
0.09 |
|
lambda-crystallin homolog |
| 33859530 |
|
Cryz |
|
0 |
9373 |
3906 |
13547 |
145157 |
|
n.v. |
0.13 |
0.1 |
0.06 |
0.05 |
|
quinone oxidoreductase |
| 21617847 |
|
Cryzl1 |
|
0 |
0 |
277 |
3127 |
8696 |
|
n.v. |
n.v. |
-0.19 |
-0.01 |
-0.1 |
|
quinone oxidoreductase-like protein 1 isoform 1 |
| 323462200 |
|
Cryzl1 |
|
0 |
0 |
277 |
3127 |
8696 |
|
n.v. |
n.v. |
-0.19 |
-0.01 |
-0.1 |
|
quinone oxidoreductase-like protein 1 isoform 2 |
| 13385942 |
|
Cs |
|
414210 |
70362 |
9485 |
6769 |
9446 |
|
-0.04 |
-0.13 |
-0.32 |
-0.55 |
-0.33 |
|
citrate synthase, mitochondrial precursor |
| 21450351 |
|
Csad |
|
0 |
0 |
0 |
0 |
8664 |
|
n.v. |
n.v. |
n.v. |
n.v. |
0.24 |
|
cysteine sulfinic acid decarboxylase |
| 21450287 |
|
Csde1 |
|
0 |
2390 |
48973 |
57610 |
6169 |
|
n.v. |
0.39 |
0.11 |
0.06 |
0.14 |
|
cold shock domain-containing protein E1 isoform 1 |
| 240255574 |
|
Csde1 |
|
0 |
2390 |
45083 |
52044 |
6169 |
|
n.v. |
0.39 |
0.11 |
0.07 |
0.14 |
|
cold shock domain-containing protein E1 isoform 2 |
| 12963737 |
|
Cse1l |
|
995280 |
15683 |
39198 |
532749 |
112760 |
|
0.08 |
0.03 |
-0.04 |
0 |
-0.02 |
|
exportin-2 |
| 6753536 |
|
Csf3 |
|
1501 |
0 |
0 |
0 |
0 |
|
0.01 |
n.v. |
n.v. |
n.v. |
n.v. |
|
granulocyte colony-stimulating factor precursor |
| 31560712 |
|
Csk |
|
0 |
1998 |
260 |
0 |
19191 |
|
n.v. |
0.49 |
0 |
n.v. |
0.02 |
|
tyrosine-protein kinase CSK |
| 269973935 |
|
Csl |
|
147858 |
31837 |
2319 |
4928 |
4798 |
|
-0.02 |
-0.14 |
-0.3 |
-0.64 |
-0.19 |
|
citrate synthase-like protein |
| 75677412 |
|
Csn3 |
|
3661 |
0 |
2919 |
5984 |
0 |
|
0.14 |
n.v. |
0.04 |
0 |
n.v. |
|
kappa-casein precursor |
| 22165382 |
|
Csnk1a1 |
|
0 |
3789 |
1329 |
22093 |
568 |
|
n.v. |
0.2 |
0.03 |
0.02 |
-0.32 |
|
casein kinase I isoform alpha |
| 20544147 |
|
Csnk1d |
|
0 |
2127 |
3398 |
1023 |
0 |
|
n.v. |
0.12 |
0.08 |
0.7 |
n.v. |
|
casein kinase I isoform delta isoform 2 |
| 20544149 |
|
Csnk1d |
|
0 |
2127 |
3398 |
1023 |
0 |
|
n.v. |
0.12 |
0.08 |
0.7 |
n.v. |
|
casein kinase I isoform delta isoform 1 |
| 31542425 |
|
Csnk1e |
|
0 |
645 |
2624 |
1023 |
0 |
|
n.v. |
0.99 |
0.09 |
0.7 |
n.v. |
|
casein kinase I isoform epsilon |
| 31542427 |
|
Csnk2a1 |
|
332895 |
3545 |
5485 |
94224 |
32782 |
|
0.17 |
0.16 |
-0.03 |
0.08 |
-0.12 |
|
casein kinase II subunit alpha |
| 6753540 |
|
Csnk2a2 |
|
328996 |
146 |
2840 |
41051 |
10892 |
|
0.1 |
0.63 |
0.02 |
0.11 |
0.15 |
|
casein kinase II subunit alpha' |
| 7106277 |
|
Csnk2b |
|
3899 |
3152 |
7388 |
25613 |
23893 |
|
0.09 |
0.17 |
0.03 |
0 |
0.15 |
|
casein kinase II subunit beta |
| 6681069 |
|
Csrp1 |
|
1336 |
5198 |
5250 |
638 |
136643 |
|
0.34 |
0.49 |
0.19 |
-0.31 |
0.19 |
|
cysteine and glycine-rich protein 1 |
| 160707987 |
|
Csrp2 |
|
0 |
0 |
4 |
131 |
4477 |
|
n.v. |
n.v. |
0.38 |
-0.1 |
0.11 |
|
cysteine and glycine-rich protein 2 |
| 31981822 |
|
Cst3 |
|
0 |
1115 |
402 |
0 |
0 |
|
n.v. |
-0.22 |
-0.3 |
n.v. |
n.v. |
|
cystatin-C precursor |
| 33469017 |
|
Cstad |
|
0 |
0 |
0 |
16011 |
324166 |
|
n.v. |
n.v. |
n.v. |
0.09 |
0.01 |
|
CSA-conditional, T cell activation-dependent protein |
| 6681071 |
|
Cstb |
|
3149 |
4868 |
1547 |
3536 |
15700 |
|
0.21 |
0.12 |
0.01 |
-0.11 |
0.01 |
|
cystatin-B |
| 13195628 |
|
Cstf1 |
|
0 |
0 |
0 |
278 |
568 |
|
n.v. |
n.v. |
n.v. |
0.62 |
-0.51 |
|
cleavage stimulation factor subunit 1 |
| 18875338 |
|
Cstf2 |
|
2050 |
0 |
98 |
0 |
0 |
|
0.06 |
n.v. |
0.32 |
n.v. |
n.v. |
|
cleavage stimulation factor subunit 2 |
| 21704042 |
|
Cstf3 |
|
10068 |
190 |
0 |
2898 |
0 |
|
-0.08 |
0.08 |
n.v. |
0.28 |
n.v. |
|
cleavage stimulation factor subunit 3 isoform 1 |
| 259155334 |
|
Ctage5 |
|
0 |
159 |
41 |
0 |
0 |
|
n.v. |
-0.01 |
-0.15 |
n.v. |
n.v. |
|
cutaneous T-cell lymphoma-associated antigen 5 homolog
isoform 1 |
| 259155336 |
|
Ctage5 |
|
0 |
159 |
41 |
0 |
0 |
|
n.v. |
-0.01 |
-0.15 |
n.v. |
n.v. |
|
cutaneous T-cell lymphoma-associated antigen 5 homolog
isoform 2 |
| 259155338 |
|
Ctage5 |
|
0 |
159 |
41 |
0 |
0 |
|
n.v. |
-0.01 |
-0.15 |
n.v. |
n.v. |
|
cutaneous T-cell lymphoma-associated antigen 5 homolog
isoform 3 |
| 311893324 |
|
Ctbp1 |
|
4082 |
1595 |
1026 |
0 |
30865 |
|
-0.14 |
0.02 |
0.16 |
n.v. |
0.03 |
|
C-terminal-binding protein 1 isoform 1 |
| 311893326 |
|
Ctbp1 |
|
4082 |
1595 |
1026 |
0 |
30865 |
|
-0.14 |
0.02 |
0.16 |
n.v. |
0.03 |
|
C-terminal-binding protein 1 isoform 2 |
| 311893328 |
|
Ctbp1 |
|
4082 |
1595 |
1026 |
0 |
30865 |
|
-0.14 |
0.02 |
0.16 |
n.v. |
0.03 |
|
C-terminal-binding protein 1 isoform 4 |
| 7304989 |
|
Ctbp1 |
|
4082 |
1595 |
1026 |
0 |
30865 |
|
-0.14 |
0.02 |
0.16 |
n.v. |
0.03 |
|
C-terminal-binding protein 1 isoform 3 |
| 282721029 |
|
Ctbp2 |
|
4082 |
1313 |
493 |
0 |
55529 |
|
-0.14 |
0.14 |
0.13 |
n.v. |
-0.15 |
|
C-terminal-binding protein 2 isoform 1 |
| 6753548 |
|
Ctbp2 |
|
4082 |
1313 |
493 |
0 |
55529 |
|
-0.14 |
0.14 |
0.13 |
n.v. |
-0.15 |
|
C-terminal-binding protein 2 isoform 2 |
| 27229204 |
|
Ctbs |
|
0 |
180 |
0 |
0 |
0 |
|
n.v. |
-0.37 |
n.v. |
n.v. |
n.v. |
|
di-N-acetylchitobiase precursor |
| 219689064 |
|
Ctc1 |
|
0 |
165 |
200 |
1490 |
7143 |
|
n.v. |
0.25 |
-0.99 |
0.01 |
0.03 |
|
CST complex subunit CTC1 isoform a |
| 219689066 |
|
Ctc1 |
|
0 |
165 |
200 |
1490 |
7143 |
|
n.v. |
0.25 |
-0.99 |
0.01 |
0.03 |
|
CST complex subunit CTC1 isoform c |
| 31044459 |
|
Ctcf |
|
1446 |
0 |
0 |
0 |
0 |
|
-0.11 |
n.v. |
n.v. |
n.v. |
n.v. |
|
transcriptional repressor CTCF |
| 34328280 |
|
Ctdp1 |
|
0 |
0 |
0 |
246 |
3748 |
|
n.v. |
n.v. |
n.v. |
0.19 |
0.4 |
|
RNA polymerase II subunit A C-terminal domain phosphatase |
| 23346509 |
|
Ctdsp1 |
|
0 |
0 |
322 |
0 |
0 |
|
n.v. |
n.v. |
-0.15 |
n.v. |
n.v. |
|
carboxy-terminal domain RNA polymerase II polypeptide A
small phosphatase 1 |
| 164698411 |
|
Ctdsp2 |
|
0 |
0 |
29 |
0 |
0 |
|
n.v. |
n.v. |
0.09 |
n.v. |
n.v. |
|
carboxy-terminal domain RNA polymerase II polypeptide A
small phosphatase 2 isoform a |
| 22122479 |
|
Ctdsp2 |
|
0 |
0 |
29 |
0 |
0 |
|
n.v. |
n.v. |
0.09 |
n.v. |
n.v. |
|
carboxy-terminal domain RNA polymerase II polypeptide A
small phosphatase 2 isoform b |
| 171460950 |
|
Ctdspl |
|
0 |
75 |
187 |
0 |
0 |
|
n.v. |
0.03 |
-0.02 |
n.v. |
n.v. |
|
CTD small phosphatase-like protein |
| 6681075 |
|
Ctf1 |
|
0 |
125 |
0 |
147 |
0 |
|
n.v. |
-0.51 |
n.v. |
0.38 |
n.v. |
|
cardiotrophin-1 |
| 38524598 |
|
Ctf2 |
|
0 |
0 |
0 |
974 |
0 |
|
n.v. |
n.v. |
n.v. |
-0.34 |
n.v. |
|
cardiotrophin-2 precursor |
| 22122387 |
|
Cth |
|
0 |
996 |
925 |
7523 |
34442 |
|
n.v. |
0.31 |
0.08 |
-0.17 |
0.04 |
|
cystathionine gamma-lyase |
| 6753294 |
|
Ctnna1 |
|
402092 |
77384 |
297606 |
46183 |
37301 |
|
-0.01 |
-0.05 |
-0.08 |
-0.13 |
-0.2 |
|
catenin alpha-1 |
| 157951725 |
|
Ctnna2 |
|
118623 |
16452 |
55422 |
4780 |
6179 |
|
-0.06 |
-0.17 |
-0.1 |
-0.22 |
-0.09 |
|
catenin alpha-2 isoform 2 |
| 157951727 |
|
Ctnna2 |
|
118623 |
16452 |
55422 |
4780 |
6179 |
|
-0.06 |
-0.17 |
-0.1 |
-0.22 |
-0.09 |
|
catenin alpha-2 isoform 1 |
| 256985121 |
|
Ctnna3 |
|
18141 |
0 |
0 |
0 |
0 |
|
0.04 |
n.v. |
n.v. |
n.v. |
n.v. |
|
catenin alpha-3 isoform 1 |
| 256985121;256985119 |
|
Ctnna3 |
|
0 |
0 |
20690 |
0 |
0 |
|
n.v. |
n.v. |
-0.08 |
n.v. |
n.v. |
|
catenin alpha-3 isoform 1 |
| 256985119;256985121 |
|
Ctnna3 |
|
0 |
7805 |
0 |
3634 |
1050 |
|
n.v. |
0.01 |
n.v. |
-0.56 |
-0.17 |
|
catenin alpha-3 isoform 1 |
| 256985152 |
|
Ctnna3 |
|
18141 |
7805 |
20690 |
3634 |
1050 |
|
0.04 |
0.01 |
-0.08 |
-0.56 |
-0.17 |
|
catenin alpha-3 isoform 2 |
| 227330565 |
|
Ctnnal1 |
|
0 |
0 |
5429 |
0 |
0 |
|
n.v. |
n.v. |
0.02 |
n.v. |
n.v. |
|
alpha-catulin |
| 260166642 |
|
Ctnnb1 |
|
216853 |
54058 |
144952 |
9127 |
6212 |
|
0.04 |
0 |
-0.06 |
-0.12 |
-0.67 |
|
catenin beta-1 |
| 254540032 |
|
Ctnnbl1 |
|
6151 |
854 |
1368 |
4699 |
4402 |
|
0.06 |
0.07 |
-0.12 |
0.13 |
0.04 |
|
beta-catenin-like protein 1 |
| 146219835 |
|
Ctnnd1 |
|
163454 |
44182 |
107735 |
0 |
0 |
|
0.06 |
0.03 |
-0.05 |
n.v. |
n.v. |
|
catenin delta-1 isoform 2 |
| 146219849 |
|
Ctnnd1 |
|
167024 |
45005 |
111509 |
0 |
0 |
|
0.07 |
0.04 |
-0.04 |
n.v. |
n.v. |
|
catenin delta-1 isoform 3 |
| 146231979 |
|
Ctnnd1 |
|
163454 |
44182 |
107735 |
0 |
0 |
|
0.06 |
0.03 |
-0.05 |
n.v. |
n.v. |
|
catenin delta-1 isoform 4 |
| 83745122 |
|
Ctnnd1 |
|
167024 |
45833 |
114146 |
0 |
0 |
|
0.07 |
0.04 |
-0.04 |
n.v. |
n.v. |
|
catenin delta-1 isoform 1 |
| 172072613 |
|
Ctps |
|
0 |
2008 |
9756 |
29501 |
17949 |
|
n.v. |
0.06 |
0.01 |
0.13 |
0.12 |
|
CTP synthase 1 |
| 270483773;270483771 |
|
Ctps2 |
|
0 |
1768 |
1596 |
12606 |
1274 |
|
n.v. |
-0.05 |
-0.1 |
-0.03 |
-0.09 |
|
CTP synthase 2 isoform a |
| 270483776 |
|
Ctps2 |
|
0 |
1768 |
1596 |
12606 |
1274 |
|
n.v. |
-0.05 |
-0.1 |
-0.03 |
-0.09 |
|
CTP synthase 2 isoform b |
| 84042523 |
|
Ctsa |
|
31102 |
21205 |
8468 |
15929 |
17831 |
|
0.04 |
-0.19 |
-0.31 |
-0.22 |
-0.28 |
|
lysosomal protective protein isoform b preproprotein |
| 84042525 |
|
Ctsa |
|
31102 |
21205 |
8468 |
15929 |
17831 |
|
0.04 |
-0.19 |
-0.31 |
-0.22 |
-0.28 |
|
lysosomal protective protein isoform a preproprotein |
| 6681079 |
|
Ctsb |
|
111575 |
18998 |
10564 |
270 |
27202 |
|
0.15 |
-0.14 |
-0.29 |
-0.44 |
-0.15 |
|
cathepsin B preproprotein |
| 160707990 |
|
Ctsc |
|
14041 |
2474 |
2463 |
3053 |
17328 |
|
0.01 |
0.03 |
-0.32 |
-0.09 |
-0.23 |
|
dipeptidyl peptidase 1 preproprotein |
| 6753556 |
|
Ctsd |
|
139345 |
102249 |
16980 |
8832 |
147427 |
|
0.11 |
0 |
-0.24 |
-0.29 |
-0.1 |
|
cathepsin D precursor |
| 166235890 |
|
Ctsh |
|
14919 |
6329 |
2284 |
0 |
40289 |
|
-0.2 |
0.02 |
-0.32 |
n.v. |
-0.18 |
|
pro-cathepsin H preproprotein |
| 6753558 |
|
Ctsl |
|
0 |
35 |
0 |
0 |
578 |
|
n.v. |
0.18 |
n.v. |
n.v. |
-0.77 |
|
cathepsin L1 preproprotein |
| 11968166 |
|
Ctsz |
|
0 |
3096 |
1258 |
131 |
34431 |
|
n.v. |
-0.14 |
-0.42 |
-0.09 |
-0.11 |
|
cathepsin Z preproprotein |
| 357588432 |
|
Cttn |
|
12119 |
5757 |
8568 |
1776 |
35802 |
|
0.02 |
0.19 |
0.04 |
0.14 |
-0.13 |
|
src substrate cortactin isoform 2 |
| 75677414 |
|
Cttn |
|
12119 |
5757 |
9315 |
1776 |
44659 |
|
0.02 |
0.19 |
0.04 |
0.14 |
-0.13 |
|
src substrate cortactin isoform 1 |
| 254039644 |
|
Cttnbp2nl |
|
0 |
0 |
372 |
4068 |
2378 |
|
n.v. |
n.v. |
-0.11 |
-0.05 |
-0.42 |
|
CTTNBP2 N-terminal-like protein |
| 21704170 |
|
Ctu1 |
|
0 |
0 |
0 |
0 |
5537 |
|
n.v. |
n.v. |
n.v. |
n.v. |
0.01 |
|
cytoplasmic tRNA 2-thiolation protein 1 |
| 225735586 |
|
Ctu2 |
|
0 |
0 |
61 |
1261 |
2452 |
|
n.v. |
n.v. |
0.33 |
0.46 |
0.38 |
|
cytoplasmic tRNA 2-thiolation protein 2 |
| 124487348 |
|
Cubn |
|
3661 |
0 |
2919 |
5984 |
0 |
|
0.14 |
n.v. |
0.04 |
0 |
n.v. |
|
cubilin precursor |
| 256773254 |
|
Cuedc2 |
|
0 |
0 |
342 |
0 |
996 |
|
n.v. |
n.v. |
-0.2 |
n.v. |
0.37 |
|
CUE domain-containing protein 2 isoform a |
| 256773258 |
|
Cuedc2 |
|
0 |
0 |
342 |
0 |
996 |
|
n.v. |
n.v. |
-0.2 |
n.v. |
0.37 |
|
CUE domain-containing protein 2 isoform b |
| 256773262 |
|
Cuedc2 |
|
0 |
0 |
342 |
0 |
996 |
|
n.v. |
n.v. |
-0.2 |
n.v. |
0.37 |
|
CUE domain-containing protein 2 isoform c |
| 7549752 |
|
Cul1 |
|
0 |
2085 |
7795 |
68415 |
1189 |
|
n.v. |
0.2 |
0.03 |
0.06 |
-0.13 |
|
cullin-1 |
| 170014698 |
|
Cul2 |
|
0 |
25 |
1930 |
24639 |
1703 |
|
n.v. |
1.26 |
0.05 |
0.05 |
0.31 |
|
cullin-2 |
| 7710014 |
|
Cul3 |
|
0 |
470 |
4661 |
35362 |
8643 |
|
n.v. |
0.35 |
-0.05 |
0.08 |
0.1 |
|
cullin-3 |
| 167466258 |
|
Cul4a |
|
0 |
0 |
427 |
23820 |
3459 |
|
n.v. |
n.v. |
0.01 |
0.2 |
0.06 |
|
cullin-4A |
| 158711665 |
|
Cul4b |
|
0 |
0 |
155 |
29550 |
4894 |
|
n.v. |
n.v. |
-0.15 |
0.13 |
0.12 |
|
cullin-4B |
| 239051067 |
|
Cul5 |
|
0 |
152 |
541 |
15422 |
9906 |
|
n.v. |
-0.5 |
0.23 |
0.05 |
0.04 |
|
cullin-5 isoform 1 |
| 239051082 |
|
Cul5 |
|
0 |
152 |
541 |
15422 |
9906 |
|
n.v. |
-0.5 |
0.23 |
0.05 |
0.04 |
|
cullin-5 isoform 2 |
| 57013279 |
|
Cul7 |
|
0 |
0 |
0 |
0 |
0 |
|
n.v. |
n.v. |
n.v. |
-0.1 |
n.v. |
|
cullin-7 |
| 62198210 |
|
Cuta |
|
641 |
46 |
88 |
1277 |
1253 |
|
-0.31 |
-0.13 |
-0.01 |
-0.14 |
-0.07 |
|
protein CutA isoform 1 precursor |
| 62198239 |
|
Cuta |
|
641 |
46 |
88 |
1277 |
1253 |
|
-0.31 |
-0.13 |
-0.01 |
-0.14 |
-0.07 |
|
protein CutA isoform 2 |
| 165932339 |
|
Cutc |
|
0 |
0 |
0 |
57 |
0 |
|
n.v. |
n.v. |
n.v. |
0.69 |
n.v. |
|
copper homeostasis protein cutC homolog isoform 2 |
| 165932350 |
|
Cutc |
|
0 |
0 |
0 |
57 |
0 |
|
n.v. |
n.v. |
n.v. |
0.69 |
n.v. |
|
copper homeostasis protein cutC homolog isoform 1 |
| 110835729 |
|
Cux1 |
|
0 |
0 |
9 |
0 |
0 |
|
n.v. |
n.v. |
-0.36 |
n.v. |
n.v. |
|
protein CASP isoform a |
| 110815859 |
|
Cux1 |
|
0 |
136 |
9 |
0 |
0 |
|
n.v. |
-0.02 |
-0.36 |
n.v. |
n.v. |
|
protein CASP isoform b |
| 12963537 |
|
Cwc15 |
|
0 |
0 |
0 |
0 |
1210 |
|
n.v. |
n.v. |
n.v. |
n.v. |
0.46 |
|
spliceosome-associated protein CWC15 homolog |
| 27881425 |
|
Cwc22 |
|
1904 |
724 |
632 |
131 |
0 |
|
-0.66 |
-0.09 |
0.09 |
0.01 |
n.v. |
|
pre-mRNA-splicing factor CWC22 homolog isoform 1 |
| 323462203 |
|
Cwc22 |
|
1904 |
724 |
632 |
131 |
0 |
|
-0.66 |
-0.09 |
0.09 |
0.01 |
n.v. |
|
pre-mRNA-splicing factor CWC22 homolog isoform 2 |
| 262072988 |
|
Cwc25 |
|
0 |
635 |
29 |
0 |
0 |
|
n.v. |
-0.03 |
-0.15 |
n.v. |
n.v. |
|
pre-mRNA-splicing factor CWC25 homolog |
| 110625681 |
|
Cwc27 |
|
0 |
812 |
1080 |
0 |
0 |
|
n.v. |
0.25 |
-0.03 |
n.v. |
n.v. |
|
peptidyl-prolyl cis-trans isomerase CWC27 homolog |
| 124487291 |
|
Cwf19l1 |
|
0 |
8 |
856 |
4281 |
2838 |
|
n.v. |
-0.24 |
0.05 |
0.16 |
0.3 |
|
CWF19-like protein 1 |
| 30842792 |
|
Cwf19l2 |
|
0 |
251 |
3 |
0 |
0 |
|
n.v. |
0.23 |
0.13 |
n.v. |
n.v. |
|
CWF19-like protein 2 |
| 442796434 |
|
Cxadr |
|
0 |
6795 |
7497 |
0 |
0 |
|
n.v. |
-0.24 |
-0.1 |
n.v. |
n.v. |
|
coxsackievirus and adenovirus receptor homolog isoform c
precursor |
| 68510034 |
|
Cxadr |
|
0 |
15681 |
22790 |
0 |
54 |
|
n.v. |
-0.06 |
-0.14 |
n.v. |
-2.29 |
|
coxsackievirus and adenovirus receptor homolog isoform a
precursor |
| 6857775 |
|
Cxadr |
|
0 |
15681 |
20542 |
0 |
54 |
|
n.v. |
-0.06 |
-0.15 |
n.v. |
-2.29 |
|
coxsackievirus and adenovirus receptor homolog isoform b
precursor |
| 18390325 |
|
Cxxc1 |
|
37 |
0 |
0 |
0 |
0 |
|
0.14 |
n.v. |
n.v. |
n.v. |
n.v. |
|
cpG-binding protein |
| 13385268 |
|
Cyb5 |
|
9354 |
3705 |
3481 |
557 |
0 |
|
0.06 |
-0.24 |
-0.32 |
-0.34 |
n.v. |
|
cytochrome b5 |
| 31542436 |
|
Cyb561 |
|
0 |
0 |
48 |
0 |
0 |
|
n.v. |
n.v. |
0.12 |
n.v. |
n.v. |
|
cytochrome b561 |
| 9790029 |
|
Cyb561d2 |
|
0 |
63 |
0 |
0 |
0 |
|
n.v. |
-0.3 |
n.v. |
n.v. |
n.v. |
|
cytochrome b561 domain-containing protein 2 |
| 31542438 |
|
Cyb5b |
|
153624 |
17838 |
10701 |
11370 |
396 |
|
0.02 |
-0.2 |
-0.37 |
-0.35 |
0.08 |
|
cytochrome b5 type B precursor |
| 21312524 |
|
Cyb5r1 |
|
27276 |
8920 |
1496 |
0 |
0 |
|
-0.08 |
-0.25 |
-0.44 |
n.v. |
n.v. |
|
NADH-cytochrome b5 reductase 1 |
| 19745150 |
|
Cyb5r3 |
|
1079432 |
74075 |
94329 |
69798 |
25821 |
|
-0.05 |
-0.13 |
-0.26 |
-0.13 |
-0.06 |
|
NADH-cytochrome b5 reductase 3 |
| 13385006 |
|
Cyc1 |
|
79833 |
17784 |
1766 |
0 |
0 |
|
0.08 |
-0.1 |
-0.34 |
n.v. |
n.v. |
|
cytochrome c1, heme protein, mitochondrial |
| 6681095 |
|
Cycs |
|
6718 |
18717 |
988 |
3282 |
9135 |
|
0.18 |
-0.02 |
-0.13 |
-0.35 |
-0.25 |
|
cytochrome c, somatic |
| 164698474 |
|
Cyfip1 |
|
6133 |
11571 |
27041 |
16461 |
21880 |
|
0.16 |
0.03 |
-0.07 |
-0.3 |
-0.39 |
|
cytoplasmic FMR1-interacting protein 1 isoform a |
| 258547119 |
|
Cyfip1 |
|
6133 |
8039 |
19496 |
13899 |
15025 |
|
0.16 |
0.03 |
-0.08 |
-0.3 |
-0.4 |
|
cytoplasmic FMR1-interacting protein 1 isoform b |
| 84370256 |
|
Cyfip2 |
|
641 |
8941 |
14902 |
8087 |
14661 |
|
0.22 |
0.08 |
-0.03 |
-0.33 |
-0.41 |
|
cytoplasmic FMR1-interacting protein 2 |
| 30725867 |
|
Cyhr1 |
|
0 |
136 |
86 |
0 |
0 |
|
n.v. |
-0.1 |
-0.3 |
n.v. |
n.v. |
|
cysteine and histidine-rich protein 1 isoform 2 |
| 444741673 |
|
Cyhr1 |
|
0 |
0 |
0 |
0 |
5355 |
|
n.v. |
n.v. |
n.v. |
n.v. |
-0.23 |
|
cysteine and histidine-rich protein 1 isoform 3 |
| 9506491 |
|
Cyhr1 |
|
0 |
0 |
0 |
0 |
2506 |
|
n.v. |
n.v. |
n.v. |
n.v. |
-0.22 |
|
cysteine and histidine-rich protein 1 isoform 1 precursor |
| 74271886 |
|
Cyp20a1 |
|
275 |
2797 |
517 |
0 |
0 |
|
-0.69 |
-0.38 |
-0.19 |
n.v. |
n.v. |
|
cytochrome P450 20A1 |
| 21311915 |
|
Cyp2s1 |
|
0 |
605 |
0 |
0 |
0 |
|
n.v. |
-0.17 |
n.v. |
n.v. |
n.v. |
|
cytochrome P450 2S1 precursor |
| 9256529 |
|
Cyp39a1 |
|
0 |
449 |
117 |
0 |
0 |
|
n.v. |
-0.28 |
-0.43 |
n.v. |
n.v. |
|
24-hydroxycholesterol 7-alpha-hydroxylase |
| 13277362 |
|
Cyp4f16 |
|
0 |
132 |
0 |
0 |
0 |
|
n.v. |
-0.33 |
n.v. |
n.v. |
n.v. |
|
cytochrome P450, family 4, subfamily f, polypeptide 16 |
| 71061451 |
|
Cyp51 |
|
0 |
9759 |
104 |
0 |
0 |
|
n.v. |
-0.35 |
-0.49 |
n.v. |
n.v. |
|
lanosterol 14-alpha demethylase |
| 240120154 |
|
Cys1 |
|
0 |
0 |
0 |
0 |
0 |
|
n.v. |
n.v. |
0.51 |
n.v. |
n.v. |
|
cystin-1 |
| 167716849 |
|
CYTB |
|
0 |
1119 |
0 |
0 |
0 |
|
n.v. |
-0.34 |
n.v. |
n.v. |
n.v. |
|
cytochrome bmusculus |
| 226453487 |
|
CYTB |
|
0 |
1119 |
0 |
0 |
0 |
|
n.v. |
-0.34 |
n.v. |
n.v. |
n.v. |
|
cytochrome bmusculus castaneus] |
| 34538610 |
|
CYTB |
|
0 |
1119 |
0 |
0 |
0 |
|
n.v. |
-0.34 |
n.v. |
n.v. |
n.v. |
|
cytochrome b |
| 162951835 |
|
Cyth1 |
|
0 |
0 |
300 |
0 |
0 |
|
n.v. |
n.v. |
-0.19 |
n.v. |
n.v. |
|
cytohesin-1 isoform 2 |
| 162951837 |
|
Cyth1 |
|
0 |
0 |
300 |
0 |
0 |
|
n.v. |
n.v. |
-0.19 |
n.v. |
n.v. |
|
cytohesin-1 isoform 3 |
| 31543516 |
|
Cyth1 |
|
0 |
0 |
300 |
0 |
0 |
|
n.v. |
n.v. |
-0.19 |
n.v. |
n.v. |
|
cytohesin-1 isoform 1 |
| 162951840 |
|
Cyth2 |
|
0 |
0 |
0 |
0 |
910 |
|
n.v. |
n.v. |
n.v. |
n.v. |
-0.05 |
|
cytohesin-2 isoform 2 |
| 6755186 |
|
Cyth2 |
|
0 |
0 |
0 |
0 |
910 |
|
n.v. |
n.v. |
n.v. |
n.v. |
-0.05 |
|
cytohesin-2 isoform 1 |
| 29244042 |
|
D030056L22Rik |
|
0 |
0 |
0 |
98 |
2046 |
|
n.v. |
n.v. |
n.v. |
0.07 |
0.02 |
|
uncharacterized protein C9orf40 homolog |
| 85701756 |
|
D10Bwg1379e |
|
0 |
0 |
0 |
835 |
0 |
|
n.v. |
n.v. |
n.v. |
-0.16 |
n.v. |
|
brefeldin A-inhibited guanine nucleotide-exchange protein
3 |
| 163838637 |
|
D14Abb1e |
|
0 |
0 |
3 |
0 |
0 |
|
n.v. |
n.v. |
0.81 |
n.v. |
n.v. |
|
protein FAM208A isoform 2 |
| 168823452 |
|
D14Abb1e |
|
0 |
0 |
3 |
0 |
0 |
|
n.v. |
n.v. |
0.81 |
n.v. |
n.v. |
|
protein FAM208A isoform 1 |
| 112817622 |
|
D15Ertd621e |
|
0 |
1812 |
3110 |
10551 |
0 |
|
n.v. |
0.02 |
0 |
0.04 |
n.v. |
|
protein FAM91A1 |
| 51591905 |
|
D17H6S53E |
|
0 |
0 |
18 |
0 |
0 |
|
n.v. |
n.v. |
-0.61 |
n.v. |
n.v. |
|
uncharacterized protein C6orf47 homolog |
| 18250288 |
|
D17Wsu104e |
|
1959 |
2528 |
2256 |
0 |
4187 |
|
-0.04 |
-0.1 |
-0.23 |
n.v. |
-0.21 |
|
UPF0556 protein C19orf10 homolog precursor |
| 19527042 |
|
D1Ertd622e |
|
0 |
0 |
0 |
65 |
0 |
|
n.v. |
n.v. |
n.v. |
0.42 |
n.v. |
|
UNC119-binding protein C5orf30 homolog |
| 14861844 |
|
D1Pas1 |
|
120673 |
17921 |
99642 |
109056 |
364 |
|
-0.07 |
0.2 |
0.1 |
-0.01 |
0.37 |
|
putative ATP-dependent RNA helicase Pl10 |
| 170014723 |
|
D2hgdh |
|
0 |
1255 |
0 |
0 |
0 |
|
n.v. |
-0.14 |
n.v. |
n.v. |
n.v. |
|
D-2-hydroxyglutarate dehydrogenase, mitochondrial
precursor |
| 305682577 |
|
D2Wsu81e |
|
0 |
0 |
143 |
0 |
0 |
|
n.v. |
n.v. |
-0.16 |
n.v. |
n.v. |
|
uncharacterized protein C9orf114 homolog |
| 30425010 |
|
D330045A20Rik |
|
0 |
0 |
13 |
0 |
0 |
|
n.v. |
n.v. |
0.35 |
n.v. |
n.v. |
|
uncharacterized protein CXorf57 homolog |
| 153281116 |
|
D3Ertd751e |
|
0 |
50 |
0 |
0 |
2967 |
|
n.v. |
0.09 |
n.v. |
n.v. |
0.02 |
|
UPF0462 protein C4orf33 homolog isoform a |
| 153281135 |
|
D3Ertd751e |
|
0 |
50 |
0 |
0 |
2967 |
|
n.v. |
0.09 |
n.v. |
n.v. |
0.02 |
|
UPF0462 protein C4orf33 homolog isoform b |
| 20070406 |
|
D6Wsu163e |
|
0 |
61 |
0 |
0 |
750 |
|
n.v. |
-0.07 |
n.v. |
n.v. |
0.61 |
|
uncharacterized protein C12orf4 homolog |
| 56090602 |
|
D8Ertd738e |
|
0 |
0 |
335 |
2014 |
0 |
|
n.v. |
n.v. |
0.09 |
-0.21 |
n.v. |
|
leydig cell tumor 10 kDa protein homolog |
| 161333828 |
|
D8Ertd82e |
|
19661 |
0 |
0 |
0 |
0 |
|
-0.04 |
n.v. |
n.v. |
n.v. |
n.v. |
|
tyrosine-protein kinase SgK223 |
| 78191777 |
|
Daam1 |
|
0 |
0 |
219 |
0 |
0 |
|
n.v. |
n.v. |
-0.38 |
n.v. |
n.v. |
|
disheveled-associated activator of morphogenesis 1 |
| 6753598 |
|
Dad1 |
|
47962 |
9273 |
6215 |
336 |
0 |
|
-0.07 |
-0.36 |
-0.37 |
-1.89 |
n.v. |
|
dolichyl-diphosphooligosaccharide--protein
glycosyltransferase subunit DAD1 |
| 451898099;33859532 |
|
Dag1 |
|
18 |
0 |
2341 |
0 |
0 |
|
0.85 |
n.v. |
0.06 |
n.v. |
n.v. |
|
dystroglycan precursor |
| 33859532 |
|
Dag1 |
|
0 |
3135 |
0 |
426 |
20541 |
|
n.v. |
0.07 |
n.v. |
-0.32 |
-0.14 |
|
dystroglycan precursor |
| 21703976 |
|
Dak |
|
0 |
921 |
1674 |
2840 |
1317 |
|
n.v. |
0 |
-0.1 |
0.84 |
0.14 |
|
bifunctional ATP-dependent dihydroxyacetone
kinase/FAD-AMP lyase (cyclizing) |
| 110815857 |
|
Dao |
|
0 |
409 |
0 |
0 |
0 |
|
n.v. |
0.81 |
n.v. |
n.v. |
n.v. |
|
D-amino-acid oxidase |
| 256985203 |
|
Dap3 |
|
2050 |
144 |
0 |
1171 |
0 |
|
-0.09 |
-0.2 |
n.v. |
0 |
n.v. |
|
28S ribosomal protein S29, mitochondrial isoform 2 |
| 256985205 |
|
Dap3 |
|
2050 |
144 |
0 |
1162 |
0 |
|
-0.09 |
-0.2 |
n.v. |
0.02 |
n.v. |
|
28S ribosomal protein S29, mitochondrial isoform 1 |
| 410812207 |
|
Dapk3 |
|
0 |
0 |
127 |
508 |
0 |
|
n.v. |
n.v. |
-0.16 |
1.27 |
n.v. |
|
death-associated protein kinase 3 isoform a |
| 6681133 |
|
Dapk3 |
|
0 |
0 |
127 |
508 |
0 |
|
n.v. |
n.v. |
-0.16 |
1.27 |
n.v. |
|
death-associated protein kinase 3 isoform b |
| 210147402 |
|
Dars |
|
0 |
6365 |
9040 |
90450 |
26592 |
|
n.v. |
0.07 |
0.07 |
0.07 |
0.13 |
|
aspartate--tRNA ligase, cytoplasmic isoform 2 |
| 211065507 |
|
Dars |
|
13510 |
53603 |
86340 |
781689 |
347491 |
|
0.09 |
0.07 |
-0.04 |
0.04 |
0 |
|
aspartate--tRNA ligase, cytoplasmic isoform 1 |
| 27369928 |
|
Dars2 |
|
0 |
607 |
0 |
0 |
0 |
|
n.v. |
-0.1 |
n.v. |
n.v. |
n.v. |
|
aspartate--tRNA ligase, mitochondrial precursor |
| 169790818 |
|
Dazap1 |
|
18233 |
499 |
694 |
0 |
13569 |
|
0.03 |
0.11 |
-0.07 |
n.v. |
0.09 |
|
DAZ-associated protein 1 isoform a |
| 169790820 |
|
Dazap1 |
|
18233 |
499 |
694 |
0 |
13569 |
|
0.03 |
0.11 |
-0.07 |
n.v. |
0.09 |
|
DAZ-associated protein 1 isoform b |
| 169790823 |
|
Dazap1 |
|
18233 |
499 |
694 |
0 |
13569 |
|
0.03 |
0.11 |
-0.07 |
n.v. |
0.09 |
|
DAZ-associated protein 1 isoform c |
| 110815861 |
|
Dbh |
|
0 |
708 |
3521 |
0 |
0 |
|
n.v. |
0.11 |
0.18 |
n.v. |
n.v. |
|
dopamine beta-hydroxylase |
| 6681137 |
|
Dbi |
|
0 |
132 |
1029 |
0 |
1296 |
|
n.v. |
0.5 |
0.22 |
n.v. |
0.3 |
|
acyl-CoA-binding protein isoform 2 |
| 83921595 |
|
Dbi |
|
0 |
132 |
1029 |
0 |
1296 |
|
n.v. |
0.5 |
0.22 |
n.v. |
0.3 |
|
acyl-CoA-binding protein isoform 1 |
| 30794440 |
|
Dbndd2 |
|
0 |
0 |
0 |
0 |
2999 |
|
n.v. |
n.v. |
n.v. |
n.v. |
-0.62 |
|
dysbindin domain-containing protein 2 |
| 226423871 |
|
Dbnl |
|
989 |
380 |
9611 |
0 |
62436 |
|
0.21 |
0.25 |
0.03 |
n.v. |
-0.03 |
|
drebrin-like protein isoform 1 |
| 226423873 |
|
Dbnl |
|
989 |
380 |
9611 |
0 |
62436 |
|
0.21 |
0.25 |
0.03 |
n.v. |
-0.03 |
|
drebrin-like protein isoform 3 |
| 7304993 |
|
Dbnl |
|
989 |
380 |
9611 |
0 |
62436 |
|
0.21 |
0.25 |
0.03 |
n.v. |
-0.03 |
|
drebrin-like protein isoform 2 |
| 50399860 |
|
Dbr1 |
|
0 |
0 |
555 |
5804 |
1606 |
|
n.v. |
n.v. |
-0.25 |
0.1 |
0.13 |
|
lariat debranching enzyme |
| 170172520 |
|
Dbt |
|
7798 |
4154 |
0 |
131 |
0 |
|
-0.29 |
-0.2 |
n.v. |
0.52 |
n.v. |
|
lipoamide acyltransferase component of branched-chain
alpha-keto acid dehydrogenase complex,
mitochondrial |
| 19526930 |
|
Dcaf11 |
|
0 |
0 |
0 |
14799 |
1553 |
|
n.v. |
n.v. |
n.v. |
0.12 |
-0.01 |
|
DDB1- and CUL4-associated factor 11 |
| 21313612 |
|
Dcaf4 |
|
0 |
0 |
31 |
0 |
0 |
|
n.v. |
n.v. |
0 |
0.46 |
n.v. |
|
DDB1 and CUL4 associated factor 4 isoform 2 |
| 259155342 |
|
Dcaf4 |
|
0 |
0 |
31 |
0 |
0 |
|
n.v. |
n.v. |
0 |
0.46 |
n.v. |
|
DDB1 and CUL4 associated factor 4 isoform 1 |
| 56090231 |
|
Dcaf5 |
|
0 |
0 |
38 |
859 |
2560 |
|
n.v. |
n.v. |
0.06 |
0.31 |
-0.06 |
|
DDB1- and CUL4-associated factor 5 |
| 58037257 |
|
Dcaf7 |
|
0 |
0 |
989 |
6851 |
3459 |
|
n.v. |
n.v. |
-0.49 |
0.08 |
-0.67 |
|
DDB1- and CUL4-associated factor 7 |
| 23956326 |
|
Dcaf8 |
|
0 |
0 |
304 |
4166 |
4841 |
|
n.v. |
n.v. |
-1.06 |
-1.42 |
-0.12 |
|
DDB1- and CUL4-associated factor 8 |
| 27754054 |
|
Dcakd |
|
17519 |
7753 |
1579 |
368 |
0 |
|
0.2 |
-0.19 |
-0.27 |
-0.25 |
n.v. |
|
dephospho-CoA kinase domain-containing protein |
| 94369682 |
|
Dchs2 |
|
0 |
0 |
0 |
0 |
10313 |
|
n.v. |
n.v. |
n.v. |
n.v. |
0.08 |
|
PREDICTED: similar to cadherin protein |
| 6681141 |
|
Dck |
|
0 |
0 |
31 |
0 |
7133 |
|
n.v. |
n.v. |
0.17 |
n.v. |
0.11 |
|
deoxycytidine kinase |
| 133778958 |
|
Dcp1a |
|
0 |
0 |
285 |
0 |
0 |
|
n.v. |
n.v. |
0.04 |
n.v. |
n.v. |
|
mRNA-decapping enzyme 1A |
| 21312256 |
|
Dcps |
|
6297 |
2872 |
1510 |
4969 |
50335 |
|
0.46 |
0.03 |
-0.05 |
0.12 |
0.03 |
|
m7GpppX diphosphatase |
| 238859570;238859573 |
|
Dctd |
|
0 |
31 |
0 |
0 |
2281 |
|
n.v. |
0.72 |
n.v. |
n.v. |
0.1 |
|
deoxycytidylate deaminase |
| 118601017 |
|
Dctn1 |
|
2947 |
850 |
26594 |
231324 |
19309 |
|
-0.14 |
-0.05 |
-0.06 |
0.11 |
-0.03 |
|
dynactin subunit 1 isoform 1 |
| 311893358 |
|
Dctn1 |
|
2947 |
850 |
26594 |
234508 |
19309 |
|
-0.14 |
-0.05 |
-0.06 |
0.11 |
-0.03 |
|
dynactin subunit 1 isoform 2 |
| 311893360 |
|
Dctn1 |
|
2947 |
850 |
26594 |
236113 |
19309 |
|
-0.14 |
-0.05 |
-0.06 |
0.11 |
-0.03 |
|
dynactin subunit 1 isoform 3 |
| 28076935 |
|
Dctn2 |
|
0 |
3956 |
6504 |
220110 |
21880 |
|
n.v. |
0.22 |
-0.05 |
0.11 |
-0.02 |
|
dynactin subunit 2 isoform 3 |
| 299522838 |
|
Dctn2 |
|
0 |
3956 |
6504 |
233591 |
21880 |
|
n.v. |
0.22 |
-0.05 |
0.12 |
-0.02 |
|
dynactin subunit 2 isoform 2 |
| 299522842 |
|
Dctn2 |
|
0 |
3956 |
6504 |
219750 |
21880 |
|
n.v. |
0.22 |
-0.05 |
0.11 |
-0.02 |
|
dynactin subunit 2 isoform 1 |
| 227116273 |
|
Dctn3 |
|
696 |
664 |
3698 |
39553 |
3384 |
|
0.13 |
-0.06 |
-0.14 |
0.01 |
-0.17 |
|
dynactin subunit 3 isoform A |
| 227116275 |
|
Dctn3 |
|
696 |
664 |
3676 |
37498 |
3384 |
|
0.13 |
-0.06 |
-0.14 |
0.03 |
-0.17 |
|
dynactin subunit 3 isoform B |
| 13385798 |
|
Dctn4 |
|
0 |
192 |
7565 |
86219 |
257 |
|
n.v. |
-0.47 |
-0.07 |
0.1 |
0.28 |
|
dynactin subunit 4 |
| 188219518 |
|
Dctn5 |
|
0 |
138 |
1119 |
5795 |
4316 |
|
n.v. |
-0.5 |
-0.03 |
0.2 |
0.27 |
|
dynactin subunit 5 |
| 6756009 |
|
Dctn6 |
|
0 |
0 |
556 |
1162 |
0 |
|
n.v. |
n.v. |
0.19 |
0.32 |
n.v. |
|
dynactin subunit 6 |
| 12963573 |
|
Dctpp1 |
|
0 |
0 |
0 |
0 |
3427 |
|
n.v. |
n.v. |
n.v. |
n.v. |
-0.08 |
|
dCTP pyrophosphatase 1 |
| 329299048 |
|
Dcun1d1 |
|
0 |
610 |
1193 |
4445 |
15165 |
|
n.v. |
0.13 |
0.13 |
-0.04 |
0.01 |
|
DCN1-like protein 1 isoform 1 |
| 329299050 |
|
Dcun1d1 |
|
0 |
610 |
975 |
4445 |
15165 |
|
n.v. |
0.13 |
0.14 |
-0.04 |
0.01 |
|
DCN1-like protein 1 isoform 2 |
| 111162655 |
|
Dcun1d2 |
|
0 |
0 |
13 |
0 |
964 |
|
n.v. |
n.v. |
0.14 |
n.v. |
0.42 |
|
DCN1-like protein 2 isoform c |
| 111162657 |
|
Dcun1d2 |
|
0 |
0 |
13 |
0 |
964 |
|
n.v. |
n.v. |
0.14 |
n.v. |
0.42 |
|
DCN1-like protein 2 isoform d |
| 111162659 |
|
Dcun1d2 |
|
0 |
0 |
13 |
0 |
964 |
|
n.v. |
n.v. |
0.14 |
n.v. |
0.42 |
|
DCN1-like protein 2 isoform a |
| 111162661 |
|
Dcun1d2 |
|
0 |
0 |
13 |
0 |
964 |
|
n.v. |
n.v. |
0.14 |
n.v. |
0.42 |
|
DCN1-like protein 2 isoform b |
| 23956220 |
|
Dcun1d5 |
|
256 |
94 |
35 |
65 |
2420 |
|
-2.13 |
0.21 |
-0.06 |
0.58 |
0.43 |
|
DCN1-like protein 5 |
| 146134409 |
|
Dcxr |
|
0 |
468 |
1575 |
1220 |
27534 |
|
n.v. |
-0.06 |
-0.03 |
0.41 |
0.09 |
|
L-xylulose reductase |
| 189491666 |
|
Dda1 |
|
0 |
0 |
0 |
3012 |
4262 |
|
n.v. |
n.v. |
n.v. |
0.24 |
-0.06 |
|
DET1- and DDB1-associated protein 1 |
| 38371755 |
|
Ddah1 |
|
0 |
171 |
989 |
0 |
35695 |
|
n.v. |
0.1 |
0.2 |
n.v. |
0.11 |
|
N(G),N(G)-dimethylarginine dimethylaminohydrolase 1 |
| 299522791 |
|
Ddah2 |
|
494 |
4204 |
10511 |
1408 |
58035 |
|
0.01 |
-0.02 |
-0.09 |
-0.07 |
0.07 |
|
N(G),N(G)-dimethylarginine dimethylaminohydrolase 2
isoform 1 |
| 7949035 |
|
Ddah2 |
|
494 |
1599 |
4409 |
90 |
27631 |
|
0.01 |
-0.11 |
-0.08 |
0.05 |
0.09 |
|
N(G),N(G)-dimethylarginine dimethylaminohydrolase 2
isoform 2 |
| 7657011 |
|
Ddb1 |
|
8860 |
3334 |
24216 |
194587 |
298624 |
|
0.6 |
-0.06 |
-0.01 |
0.13 |
0.04 |
|
DNA damage-binding protein 1 |
| 63003917 |
|
Ddi2 |
|
0 |
365 |
34 |
0 |
11491 |
|
n.v. |
-0.61 |
0.02 |
n.v. |
0.11 |
|
protein DDI1 homolog 2 |
| 46195798 |
|
Ddost |
|
82011 |
32421 |
20760 |
0 |
0 |
|
-0.05 |
-0.11 |
-0.4 |
n.v. |
n.v. |
|
dolichyl-diphosphooligosaccharide--protein
glycosyltransferase 48 kDa subunit precursor |
| 110350660 |
|
Ddrgk1 |
|
0 |
58 |
0 |
0 |
0 |
|
n.v. |
0.07 |
n.v. |
n.v. |
n.v. |
|
DDRGK domain-containing protein 1 precursor |
| 6753618 |
|
Ddt |
|
2581 |
5743 |
3190 |
3520 |
53697 |
|
0.15 |
0.13 |
0.13 |
0.05 |
0.09 |
|
D-dopachrome decarboxylase |
| 19527256 |
|
Ddx1 |
|
5327 |
5697 |
97636 |
92849 |
50024 |
|
0.18 |
0.15 |
0.06 |
0.11 |
-0.05 |
|
ATP-dependent RNA helicase DDX1 |
| 40068489 |
|
Ddx17 |
|
147199 |
3935 |
23235 |
23591 |
0 |
|
-0.05 |
0.26 |
0.07 |
0.13 |
n.v. |
|
probable ATP-dependent RNA helicase DDX17 isoform 3 |
| 40068491 |
|
Ddx17 |
|
976351 |
21153 |
109909 |
154404 |
289 |
|
-0.09 |
0.22 |
0.03 |
-0.16 |
0.11 |
|
probable ATP-dependent RNA helicase DDX17 isoform 2 |
| 40068493 |
|
Ddx17 |
|
1123550 |
25739 |
136888 |
177995 |
289 |
|
-0.08 |
0.23 |
0.03 |
-0.12 |
0.11 |
|
probable ATP-dependent RNA helicase DDX17 isoform 1 |
| 93587673 |
|
Ddx17 |
|
1123550 |
25739 |
136888 |
177831 |
289 |
|
-0.08 |
0.23 |
0.03 |
-0.13 |
0.11 |
|
probable ATP-dependent RNA helicase DDX17 isoform 4 |
| 31981163 |
|
Ddx18 |
|
2856 |
0 |
284 |
1629 |
0 |
|
0 |
n.v. |
-0.4 |
-0.28 |
n.v. |
|
ATP-dependent RNA helicase DDX18 |
| 170932536 |
|
Ddx19a |
|
1410 |
3851 |
8625 |
13703 |
88203 |
|
0.31 |
0.19 |
0 |
0.04 |
0.1 |
|
ATP-dependent RNA helicase DDX19A |
| 26986593 |
|
Ddx19b |
|
0 |
3106 |
8022 |
12655 |
87368 |
|
n.v. |
0.29 |
0.01 |
0.03 |
0.09 |
|
ATP-dependent RNA helicase DDX19B isoform 2 |
| 299890779 |
|
Ddx19b |
|
0 |
1275 |
6384 |
8456 |
79743 |
|
n.v. |
0.33 |
0 |
-0.2 |
0.09 |
|
ATP-dependent RNA helicase DDX19B isoform 3 |
| 299890868 |
|
Ddx19b |
|
0 |
3106 |
8022 |
12655 |
87368 |
|
n.v. |
0.29 |
0.01 |
0.03 |
0.09 |
|
ATP-dependent RNA helicase DDX19B isoform 1 |
| 72384374 |
|
Ddx21 |
|
94441 |
238 |
9348 |
1727 |
118 |
|
0.04 |
-0.29 |
-0.2 |
-0.2 |
-0.27 |
|
nucleolar RNA helicase 2 |
| 124430514 |
|
Ddx23 |
|
1208 |
2668 |
1057 |
11443 |
0 |
|
0.29 |
0.05 |
-0.14 |
-0.01 |
n.v. |
|
probable ATP-dependent RNA helicase DDX23 |
| 226958385 |
|
Ddx24 |
|
0 |
0 |
127 |
467 |
21 |
|
n.v. |
n.v. |
-0.33 |
-0.26 |
-1.51 |
|
ATP-dependent RNA helicase DDX24 isoform 1 |
| 34328253 |
|
Ddx24 |
|
0 |
0 |
127 |
467 |
21 |
|
n.v. |
n.v. |
-0.33 |
-0.26 |
-1.51 |
|
ATP-dependent RNA helicase DDX24 isoform 2 |
| 163914388 |
|
Ddx25 |
|
0 |
745 |
1086 |
1048 |
31282 |
|
n.v. |
-0.03 |
0.01 |
0.13 |
0.15 |
|
ATP-dependent RNA helicase DDX25 |
| 124249330 |
|
Ddx27 |
|
0 |
0 |
2409 |
1400 |
0 |
|
n.v. |
n.v. |
-0.18 |
-0.19 |
n.v. |
|
probable ATP-dependent RNA helicase DDX27 |
| 255069809 |
|
Ddx28 |
|
0 |
165 |
0 |
0 |
0 |
|
n.v. |
-0.19 |
n.v. |
n.v. |
n.v. |
|
probable ATP-dependent RNA helicase DDX28 |
| 254675193 |
|
Ddx31 |
|
0 |
0 |
265 |
0 |
0 |
|
n.v. |
n.v. |
0.01 |
n.v. |
n.v. |
|
DEAD/H (Asp-Glu-Ala-Asp/His) box polypeptide 31 |
| 38372907 |
|
Ddx39 |
|
720140 |
20253 |
49931 |
71935 |
111047 |
|
-0.04 |
-0.08 |
-0.06 |
-0.03 |
-0.05 |
|
ATP-dependent RNA helicase DDX39A |
| 356995868 |
|
Ddx39b |
|
740753 |
16377 |
48832 |
93496 |
116851 |
|
-0.05 |
-0.08 |
-0.09 |
-0.03 |
-0.08 |
|
spliceosome RNA helicase Ddx39b |
| 6753620 |
|
Ddx3x |
|
134696 |
20184 |
119844 |
118609 |
375 |
|
-0.06 |
0.22 |
0.11 |
0.06 |
-0.27 |
|
ATP-dependent RNA helicase DDX3X |
| 25141235 |
|
Ddx3y |
|
105992 |
15128 |
95079 |
93586 |
0 |
|
-0.07 |
0.2 |
0.1 |
-0.04 |
n.v. |
|
ATP-dependent RNA helicase DDX3Y |
| 225007636 |
|
Ddx4 |
|
0 |
1958 |
13199 |
7498 |
0 |
|
n.v. |
0.29 |
0.12 |
0.17 |
n.v. |
|
probable ATP-dependent RNA helicase DDX4 isoform 1 |
| 33859536 |
|
Ddx4 |
|
0 |
1958 |
13199 |
7498 |
0 |
|
n.v. |
0.29 |
0.12 |
0.17 |
n.v. |
|
probable ATP-dependent RNA helicase DDX4 isoform 2 |
| 270047502 |
|
Ddx41 |
|
0 |
0 |
7337 |
1907 |
0 |
|
n.v. |
n.v. |
0 |
0.07 |
n.v. |
|
probable ATP-dependent RNA helicase DDX41 |
| 157838001 |
|
Ddx42 |
|
3240 |
1163 |
0 |
115 |
2013 |
|
-0.1 |
-0.08 |
n.v. |
-0.2 |
-0.13 |
|
ATP-dependent RNA helicase DDX42 |
| 160420299 |
|
Ddx46 |
|
37 |
8505 |
2385 |
1432 |
0 |
|
0.34 |
0.06 |
-0.1 |
0.17 |
n.v. |
|
probable ATP-dependent RNA helicase DDX46 |
| 27229058 |
|
Ddx47 |
|
0 |
950 |
858 |
1981 |
0 |
|
n.v. |
-0.09 |
-0.24 |
-0.35 |
n.v. |
|
probable ATP-dependent RNA helicase DDX47 |
| 67972435 |
|
Ddx49 |
|
0 |
0 |
26 |
458 |
0 |
|
n.v. |
n.v. |
0.18 |
-0.33 |
n.v. |
|
probable ATP-dependent RNA helicase DDX49 |
| 83816893 |
|
Ddx5 |
|
1274245 |
35559 |
160839 |
203256 |
1028 |
|
-0.07 |
0.03 |
-0.04 |
-0.19 |
0.02 |
|
probable ATP-dependent RNA helicase DDX5 |
| 16716475 |
|
Ddx50 |
|
0 |
0 |
130 |
0 |
0 |
|
n.v. |
n.v. |
-0.23 |
n.v. |
n.v. |
|
ATP-dependent RNA helicase DDX50 |
| 40538825 |
|
Ddx51 |
|
0 |
0 |
0 |
246 |
0 |
|
n.v. |
n.v. |
n.v. |
-0.91 |
n.v. |
|
ATP-dependent RNA helicase DDX51 |
| 117647283 |
|
Ddx55 |
|
0 |
0 |
174 |
0 |
0 |
|
n.v. |
n.v. |
0.13 |
n.v. |
n.v. |
|
ATP-dependent RNA helicase DDX55 isoform 1 |
| 299890889 |
|
Ddx55 |
|
0 |
0 |
174 |
0 |
0 |
|
n.v. |
n.v. |
0.13 |
n.v. |
n.v. |
|
ATP-dependent RNA helicase DDX55 isoform 2 |
| 21312650 |
|
Ddx56 |
|
989 |
132 |
2925 |
2546 |
0 |
|
-0.42 |
0.4 |
-0.19 |
0.01 |
n.v. |
|
probable ATP-dependent RNA helicase DDX56 |
| 153945886 |
|
Ddx58 |
|
0 |
0 |
20 |
352 |
28991 |
|
n.v. |
n.v. |
0.13 |
0.18 |
-0.09 |
|
probable ATP-dependent RNA helicase DDX58 |
| 6681159 |
|
Ddx6 |
|
0 |
16596 |
93357 |
133638 |
29194 |
|
n.v. |
0.31 |
0.07 |
0.12 |
-0.25 |
|
probable ATP-dependent RNA helicase DDX6 |
| 124487049 |
|
Ddx60 |
|
0 |
0 |
13 |
0 |
0 |
|
n.v. |
n.v. |
0.33 |
n.v. |
n.v. |
|
probable ATP-dependent RNA helicase DDX60 |
| 21312078 |
|
Deb1 |
|
0 |
0 |
4 |
0 |
0 |
|
n.v. |
n.v. |
-0.22 |
n.v. |
n.v. |
|
SS18-like protein 2 |
| 6753622 |
|
Decr2 |
|
787 |
3501 |
2109 |
0 |
0 |
|
-0.23 |
-0.48 |
-0.31 |
n.v. |
n.v. |
|
peroxisomal 2,4-dienoyl-CoA reductase |
| 6681175 |
|
Degs1 |
|
659 |
219 |
98 |
0 |
0 |
|
0.08 |
-0.52 |
-0.26 |
n.v. |
n.v. |
|
sphingolipid delta(4)-desaturase DES1 |
| 253795498 |
|
Dek |
|
7524 |
20633 |
17479 |
0 |
161 |
|
0.09 |
-0.06 |
-0.23 |
n.v. |
-0.95 |
|
protein DEK |
| 24025656 |
|
Dennd1c |
|
0 |
551 |
0 |
0 |
0 |
|
n.v. |
-0.13 |
n.v. |
n.v. |
n.v. |
|
DENN domain-containing protein 1C |
| 27369652 |
|
Dennd2a |
|
0 |
0 |
37 |
0 |
0 |
|
n.v. |
n.v. |
0.23 |
n.v. |
n.v. |
|
DENN domain-containing protein 2A |
| 238814338 |
|
Dennd2c |
|
0 |
0 |
37 |
0 |
0 |
|
n.v. |
n.v. |
0.23 |
n.v. |
n.v. |
|
DENN domain-containing protein 2C |
| 389616154 |
|
Dennd2d |
|
0 |
0 |
1658 |
5255 |
0 |
|
n.v. |
n.v. |
-0.07 |
-0.25 |
n.v. |
|
DENN domain-containing protein 2D isoform 1 |
| 147904706 |
|
Dennd2d |
|
0 |
198 |
2865 |
6532 |
375 |
|
n.v. |
0.08 |
0.04 |
-0.24 |
0 |
|
DENN domain-containing protein 2D isoform 2 |
| 124486710 |
|
Dennd3 |
|
0 |
0 |
59 |
0 |
0 |
|
n.v. |
n.v. |
0.26 |
n.v. |
n.v. |
|
DENN domain-containing protein 3 precursor |
| 124486610 |
|
Dennd4c |
|
0 |
0 |
42 |
0 |
0 |
|
n.v. |
n.v. |
0.47 |
n.v. |
n.v. |
|
DENN domain-containing protein 4C isoform 2 |
| 300863147 |
|
Dennd4c |
|
0 |
0 |
42 |
0 |
0 |
|
n.v. |
n.v. |
0.47 |
n.v. |
n.v. |
|
DENN domain-containing protein 4C isoform 1 |
| 39930409 |
|
Dennd5a |
|
0 |
0 |
247 |
0 |
0 |
|
n.v. |
n.v. |
0.21 |
n.v. |
n.v. |
|
DENN domain-containing protein 5A |
| 197333847 |
|
Dennd6a |
|
0 |
106 |
16 |
0 |
0 |
|
n.v. |
-0.08 |
0.06 |
n.v. |
n.v. |
|
protein FAM116A isoform a |
| 22122407 |
|
Dennd6a |
|
0 |
106 |
16 |
0 |
0 |
|
n.v. |
-0.08 |
0.06 |
n.v. |
n.v. |
|
protein FAM116A isoform b |
| 13386092 |
|
Denr |
|
0 |
0 |
0 |
13121 |
3877 |
|
n.v. |
n.v. |
n.v. |
0.12 |
0 |
|
density-regulated protein |
| 21450165 |
|
Depdc7 |
|
0 |
0 |
0 |
336 |
0 |
|
n.v. |
n.v. |
n.v. |
0.14 |
n.v. |
|
DEP domain-containing protein 7 |
| 27777677 |
|
Dera |
|
0 |
313 |
48 |
21413 |
236 |
|
n.v. |
0.07 |
0.22 |
-0.08 |
0.05 |
|
putative deoxyribose-phosphate aldolase |
| 13195638 |
|
Derl1 |
|
3204 |
1893 |
858 |
0 |
0 |
|
0 |
-0.19 |
-0.35 |
n.v. |
n.v. |
|
derlin-1 |
| 15808990 |
|
Derl2 |
|
0 |
758 |
133 |
0 |
0 |
|
n.v. |
-0.21 |
-0.46 |
n.v. |
n.v. |
|
derlin-2 |
| 33563250 |
|
Des |
|
715600 |
0 |
2644 |
0 |
0 |
|
0.01 |
n.v. |
-0.44 |
n.v. |
n.v. |
|
desmin |
| 70608119 |
|
Dffa |
|
0 |
0 |
0 |
0 |
439 |
|
n.v. |
n.v. |
n.v. |
n.v. |
0.33 |
|
DNA fragmentation factor subunit alpha isoform a |
| 70608144 |
|
Dffa |
|
0 |
0 |
0 |
0 |
439 |
|
n.v. |
n.v. |
n.v. |
n.v. |
0.33 |
|
DNA fragmentation factor subunit alpha isoform b |
| 9055204 |
|
Dfna5 |
|
0 |
0 |
13 |
0 |
0 |
|
n.v. |
n.v. |
-0.19 |
n.v. |
n.v. |
|
non-syndromic hearing impairment protein 5 homolog |
| 41152099 |
|
Dgcr8 |
|
0 |
0 |
152 |
0 |
0 |
|
n.v. |
n.v. |
-0.01 |
n.v. |
n.v. |
|
microprocessor complex subunit DGCR8 |
| 31560474 |
|
Dgka |
|
0 |
530 |
0 |
720 |
0 |
|
n.v. |
-1.24 |
n.v. |
-0.3 |
n.v. |
|
diacylglycerol kinase alpha |
| 9506541 |
|
Dgke |
|
0 |
173 |
117 |
0 |
0 |
|
n.v. |
-0.22 |
-0.42 |
n.v. |
n.v. |
|
diacylglycerol kinase epsilon |
| 124486741 |
|
Dgkh |
|
0 |
113 |
0 |
0 |
600 |
|
n.v. |
0.31 |
n.v. |
n.v. |
0.19 |
|
diacylglycerol kinase eta |
| 247269607 |
|
Dguok |
|
1757 |
1015 |
0 |
0 |
0 |
|
0.1 |
-0.22 |
n.v. |
n.v. |
n.v. |
|
deoxyguanosine kinase, mitochondrial isoform 1 |
| 247269645 |
|
Dguok |
|
1757 |
1015 |
0 |
0 |
0 |
|
0.1 |
-0.22 |
n.v. |
n.v. |
n.v. |
|
deoxyguanosine kinase, mitochondrial isoform 2 |
| 114155129 |
|
Dhcr24 |
|
0 |
269 |
19 |
0 |
0 |
|
n.v. |
-0.37 |
0.05 |
n.v. |
n.v. |
|
delta(24)-sterol reductase precursor |
| 6681179 |
|
Dhcr7 |
|
0 |
470 |
457 |
0 |
0 |
|
n.v. |
-0.38 |
-0.16 |
n.v. |
n.v. |
|
7-dehydrocholesterol reductase |
| 7106289 |
|
Dhfr |
|
1227 |
1173 |
3958 |
2210 |
74752 |
|
-0.01 |
0.29 |
0.05 |
0.12 |
0.08 |
|
dihydrofolate reductase |
| 9910194 |
|
Dhodh |
|
0 |
142 |
603 |
0 |
0 |
|
n.v. |
0.01 |
-0.31 |
n.v. |
n.v. |
|
dihydroorotate dehydrogenase (quinone), mitochondrial
precursor |
| 87252720 |
|
Dhps |
|
0 |
0 |
0 |
0 |
2613 |
|
n.v. |
n.v. |
n.v. |
n.v. |
0.72 |
|
deoxyhypusine synthase |
| 31980844 |
|
Dhrs1 |
|
52575 |
11260 |
11366 |
237 |
0 |
|
0.02 |
0 |
-0.04 |
0.78 |
n.v. |
|
dehydrogenase/reductase SDR family member 1 |
| 109715818 |
|
Dhrs11 |
|
0 |
0 |
0 |
0 |
2752 |
|
n.v. |
n.v. |
n.v. |
n.v. |
0.64 |
|
dehydrogenase/reductase SDR family member 11 precursor |
| 117647267 |
|
Dhrs13 |
|
0 |
40 |
1968 |
0 |
0 |
|
n.v. |
-0.19 |
-0.29 |
n.v. |
n.v. |
|
dehydrogenase/reductase SDR family member 13 precursor |
| 289063391 |
|
Dhrs3 |
|
0 |
1712 |
588 |
0 |
0 |
|
n.v. |
-0.12 |
-0.29 |
n.v. |
n.v. |
|
short-chain dehydrogenase/reductase 3 isoform 2 |
| 6755380 |
|
Dhrs3 |
|
0 |
1712 |
588 |
0 |
0 |
|
n.v. |
-0.12 |
-0.29 |
n.v. |
n.v. |
|
short-chain dehydrogenase/reductase 3 isoform 1 |
| 13507612 |
|
Dhrs4 |
|
33335 |
3156 |
5948 |
1866 |
0 |
|
-0.65 |
-0.06 |
-0.36 |
-0.49 |
n.v. |
|
dehydrogenase/reductase SDR family member 4 isoform
2 |
| 256220343 |
|
Dhrs4 |
|
36795 |
12452 |
13847 |
2251 |
0 |
|
-0.65 |
-0.13 |
-0.27 |
-0.54 |
n.v. |
|
dehydrogenase/reductase SDR family member 4 isoform
1 |
| 226958616 |
|
Dhrs7 |
|
0 |
781 |
325 |
0 |
0 |
|
n.v. |
-0.02 |
-0.76 |
n.v. |
n.v. |
|
dehydrogenase/reductase SDR family member 7 precursor |
| 21703854 |
|
Dhrs7b |
|
659 |
4077 |
786 |
0 |
0 |
|
-0.68 |
-0.28 |
-0.31 |
n.v. |
n.v. |
|
dehydrogenase/reductase SDR family member 7B isoform
2 |
| 285403538 |
|
Dhrs7b |
|
659 |
4077 |
786 |
0 |
0 |
|
-0.68 |
-0.28 |
-0.31 |
n.v. |
n.v. |
|
dehydrogenase/reductase SDR family member 7B isoform
1 |
| 110835723 |
|
Dhx15 |
|
53325 |
9112 |
12403 |
38865 |
93880 |
|
-0.08 |
0.14 |
0.04 |
0.09 |
0.01 |
|
putative pre-mRNA-splicing factor ATP-dependent RNA
helicase DHX15 isoform 2 |
| 110835726 |
|
Dhx15 |
|
48822 |
8809 |
11518 |
37441 |
95657 |
|
-0.08 |
0.17 |
0.04 |
0.09 |
-0.01 |
|
putative pre-mRNA-splicing factor ATP-dependent RNA
helicase DHX15 isoform 1 |
| 226246667 |
|
Dhx16 |
|
0 |
0 |
1788 |
0 |
1542 |
|
n.v. |
n.v. |
0.02 |
n.v. |
0.3 |
|
DEAH (Asp-Glu-Ala-His) box polypeptide 16 |
| 46852276 |
|
Dhx29 |
|
0 |
0 |
6120 |
516 |
0 |
|
n.v. |
n.v. |
0.18 |
-0.24 |
n.v. |
|
ATP-dependent RNA helicase Dhx29 |
| 19111156 |
|
Dhx30 |
|
348 |
4286 |
18220 |
2873 |
0 |
|
-0.39 |
-0.03 |
0.11 |
-0.25 |
n.v. |
|
putative ATP-dependent RNA helicase DHX30 isoform 2 |
| 358248315 |
|
Dhx30 |
|
348 |
4286 |
18220 |
2873 |
0 |
|
-0.39 |
-0.03 |
0.11 |
-0.25 |
n.v. |
|
putative ATP-dependent RNA helicase DHX30 isoform 1 |
| 358248329 |
|
Dhx30 |
|
348 |
4286 |
18094 |
2873 |
0 |
|
-0.39 |
-0.03 |
0.11 |
-0.25 |
n.v. |
|
putative ATP-dependent RNA helicase DHX30 isoform 3 |
| 21919420 |
|
Dhx35 |
|
0 |
0 |
736 |
0 |
0 |
|
n.v. |
n.v. |
-0.1 |
n.v. |
n.v. |
|
probable ATP-dependent RNA helicase DHX35 |
| 240848573 |
|
Dhx36 |
|
0 |
0 |
11187 |
9266 |
0 |
|
n.v. |
n.v. |
0.19 |
-0.06 |
n.v. |
|
probable ATP-dependent RNA helicase DHX36 |
| 42600571 |
|
Dhx37 |
|
0 |
0 |
40 |
0 |
0 |
|
n.v. |
n.v. |
-0.15 |
n.v. |
n.v. |
|
probable ATP-dependent RNA helicase DHX37 |
| 30410010 |
|
Dhx38 |
|
0 |
0 |
3 |
1072 |
24771 |
|
n.v. |
n.v. |
-0.58 |
-0.11 |
0.07 |
|
pre-mRNA-splicing factor ATP-dependent RNA helicase PRP16 |
| 144926009 |
|
Dhx40 |
|
0 |
0 |
0 |
1367 |
0 |
|
n.v. |
n.v. |
n.v. |
0.19 |
n.v. |
|
probable ATP-dependent RNA helicase DHX40 |
| 254939651 |
|
Dhx57 |
|
0 |
0 |
1182 |
16 |
0 |
|
n.v. |
n.v. |
0.26 |
-0.6 |
n.v. |
|
putative ATP-dependent RNA helicase DHX57 isoform 2 |
| 254939654 |
|
Dhx57 |
|
0 |
0 |
1182 |
16 |
0 |
|
n.v. |
n.v. |
0.26 |
-0.6 |
n.v. |
|
putative ATP-dependent RNA helicase DHX57 isoform 1 |
| 56699440 |
|
Dhx8 |
|
0 |
0 |
1727 |
0 |
1542 |
|
n.v. |
n.v. |
0.09 |
n.v. |
0.3 |
|
ATP-dependent RNA helicase DHX8 |
| 150456419 |
|
Dhx9 |
|
818352 |
4588 |
52182 |
57315 |
2088 |
|
-0.03 |
-0.1 |
0 |
-0.08 |
-0.04 |
|
ATP-dependent RNA helicase A |
| 85677504 |
|
Diablo |
|
0 |
676 |
51 |
499 |
182 |
|
n.v. |
-0.25 |
-0.24 |
-0.26 |
-0.43 |
|
diablo homolog, mitochondrial precursor |
| 6681183 |
|
Diap1 |
|
0 |
163 |
1444 |
31285 |
19727 |
|
n.v. |
-0.63 |
0.03 |
0.19 |
0.07 |
|
protein diaphanous homolog 1 |
| 189491671 |
|
Diap2 |
|
0 |
0 |
217 |
0 |
0 |
|
n.v. |
n.v. |
0.1 |
n.v. |
n.v. |
|
protein diaphanous homolog 2 |
| 9789931 |
|
Diap3 |
|
0 |
0 |
129 |
0 |
0 |
|
n.v. |
n.v. |
0.33 |
n.v. |
n.v. |
|
protein diaphanous homolog 3 |
| 117168271 |
|
Dicer1 |
|
0 |
0 |
0 |
0 |
10142 |
|
n.v. |
n.v. |
n.v. |
n.v. |
-0.01 |
|
endoribonuclease Dicer |
| 51571541 |
|
Dido1 |
|
366 |
0 |
0 |
0 |
0 |
|
0.04 |
n.v. |
n.v. |
n.v. |
n.v. |
|
death-inducer obliterator 1 isoform 2 |
| 76096375 |
|
Dido1 |
|
366 |
0 |
0 |
0 |
0 |
|
0.04 |
n.v. |
n.v. |
n.v. |
n.v. |
|
death-inducer obliterator 1 isoform 3 |
| 21313560 |
|
Dimt1 |
|
0 |
0 |
916 |
2390 |
0 |
|
n.v. |
n.v. |
-0.17 |
-0.04 |
n.v. |
|
probable dimethyladenosine transferase |
| 359807008 |
|
Dip2a |
|
0 |
0 |
116 |
0 |
0 |
|
n.v. |
n.v. |
0 |
n.v. |
n.v. |
|
disco-interacting protein 2 homolog A |
| 226823258 |
|
Dip2b |
|
0 |
0 |
164 |
0 |
0 |
|
n.v. |
n.v. |
0.14 |
n.v. |
n.v. |
|
disco-interacting protein 2 homolog B isoform 1 |
| 226823266 |
|
Dip2b |
|
0 |
0 |
116 |
0 |
0 |
|
n.v. |
n.v. |
0 |
n.v. |
n.v. |
|
disco-interacting protein 2 homolog B isoform 2 |
| 21644583 |
|
Diras1 |
|
0 |
134 |
834 |
0 |
0 |
|
n.v. |
0.35 |
0.17 |
n.v. |
n.v. |
|
GTP-binding protein Di-Ras1 |
| 71725385 |
|
Diras2 |
|
0 |
134 |
834 |
0 |
0 |
|
n.v. |
0.35 |
0.17 |
n.v. |
n.v. |
|
GTP-binding protein Di-Ras2 |
| 145207992 |
|
Dis3 |
|
2215 |
132 |
8642 |
55326 |
8867 |
|
0.25 |
0.46 |
0.04 |
0.1 |
0.02 |
|
exosome complex exonuclease RRP44 |
| 27369724 |
|
Dis3l |
|
0 |
0 |
37 |
0 |
0 |
|
n.v. |
n.v. |
0.58 |
n.v. |
n.v. |
|
DIS3-like exonuclease 1 isoform 2 |
| 295293138 |
|
Dis3l |
|
0 |
0 |
37 |
172 |
0 |
|
n.v. |
n.v. |
0.58 |
0.68 |
n.v. |
|
DIS3-like exonuclease 1 isoform 1 |
| 24233556 |
|
Dis3l2 |
|
0 |
0 |
0 |
0 |
2003 |
|
n.v. |
n.v. |
n.v. |
n.v. |
-0.21 |
|
DIS3-like exonuclease 2 isoform 2 |
| 288541376 |
|
Dis3l2 |
|
0 |
0 |
0 |
0 |
2003 |
|
n.v. |
n.v. |
n.v. |
n.v. |
-0.21 |
|
DIS3-like exonuclease 2 isoform 1 |
| 91064867 |
|
Dkc1 |
|
6023 |
192 |
78 |
0 |
0 |
|
0.14 |
0.04 |
-0.92 |
n.v. |
n.v. |
|
H/ACA ribonucleoprotein complex subunit 4 |
| 257796245 |
|
Dlat |
|
126897 |
22407 |
177 |
9061 |
0 |
|
0.04 |
-0.11 |
-0.25 |
-0.41 |
n.v. |
|
dihydrolipoyllysine-residue acetyltransferase component
of pyruvate dehydrogenase complex, mitochondrial |
| 113195692 |
|
Dlc1 |
|
0 |
0 |
26 |
10518 |
0 |
|
n.v. |
n.v. |
6.5 |
0.36 |
n.v. |
|
rho GTPase-activating protein 7 isoform 2 |
| 302699221 |
|
Dlc1 |
|
0 |
0 |
26 |
10518 |
0 |
|
n.v. |
n.v. |
6.5 |
0.36 |
n.v. |
|
rho GTPase-activating protein 7 isoform 1 |
| 302699225 |
|
Dlc1 |
|
0 |
0 |
26 |
10518 |
0 |
|
n.v. |
n.v. |
6.5 |
0.36 |
n.v. |
|
rho GTPase-activating protein 7 isoform 3 |
| 31982856 |
|
Dld |
|
260055 |
72871 |
4607 |
7924 |
19898 |
|
0.01 |
-0.1 |
-0.34 |
-0.25 |
-0.28 |
|
dihydrolipoyl dehydrogenase, mitochondrial precursor |
| 356995919 |
|
Dlg1 |
|
53984 |
3701 |
34344 |
0 |
0 |
|
-0.08 |
-0.07 |
-0.11 |
n.v. |
n.v. |
|
disks large homolog 1 isoform 3 |
| 356995921 |
|
Dlg1 |
|
53984 |
3701 |
34344 |
0 |
0 |
|
-0.08 |
-0.07 |
-0.11 |
n.v. |
n.v. |
|
disks large homolog 1 isoform 4 |
| 356995923 |
|
Dlg1 |
|
53984 |
3701 |
34097 |
0 |
0 |
|
-0.08 |
-0.07 |
-0.11 |
n.v. |
n.v. |
|
disks large homolog 1 isoform 5 |
| 356995917 |
|
Dlg1 |
|
53984 |
4092 |
35049 |
385 |
54 |
|
-0.08 |
0.02 |
-0.09 |
0.13 |
-0.58 |
|
disks large homolog 1 isoform 2 |
| 40254642 |
|
Dlg1 |
|
53984 |
4092 |
35049 |
385 |
54 |
|
-0.08 |
0.02 |
-0.09 |
0.13 |
-0.58 |
|
disks large homolog 1 isoform 1 |
| 118136297 |
|
Dlg2 |
|
2050 |
0 |
4160 |
0 |
0 |
|
0.13 |
n.v. |
-0.11 |
n.v. |
n.v. |
|
disks large homolog 2 isoform 1 |
| 340007425 |
|
Dlg2 |
|
2050 |
0 |
2694 |
0 |
0 |
|
0.13 |
n.v. |
-0.09 |
n.v. |
n.v. |
|
disks large homolog 2 isoform 2 |
| 340007427 |
|
Dlg2 |
|
2050 |
0 |
2694 |
0 |
0 |
|
0.13 |
n.v. |
-0.09 |
n.v. |
n.v. |
|
disks large homolog 2 isoform 3 |
| 295293129 |
|
Dlg3 |
|
2050 |
175 |
2770 |
0 |
0 |
|
0.13 |
0.27 |
-0.12 |
n.v. |
n.v. |
|
disks large homolog 3 isoform 4 |
| 295293124 |
|
Dlg3 |
|
2050 |
175 |
2770 |
25 |
0 |
|
0.13 |
0.27 |
-0.12 |
1.31 |
n.v. |
|
disks large homolog 3 isoform 2 |
| 295293127 |
|
Dlg3 |
|
2050 |
175 |
2770 |
25 |
0 |
|
0.13 |
0.27 |
-0.12 |
1.31 |
n.v. |
|
disks large homolog 3 isoform 3 |
| 7949129 |
|
Dlg3 |
|
2050 |
175 |
2770 |
25 |
0 |
|
0.13 |
0.27 |
-0.12 |
1.31 |
n.v. |
|
disks large homolog 3 isoform 1 |
| 254588083 |
|
Dlg5 |
|
0 |
0 |
34 |
0 |
0 |
|
n.v. |
n.v. |
-1.1 |
n.v. |
n.v. |
|
discs large homolog 5 isoform 1 |
| 254588085 |
|
Dlg5 |
|
0 |
0 |
34 |
0 |
0 |
|
n.v. |
n.v. |
-1.1 |
n.v. |
n.v. |
|
discs large homolog 5 isoform 2 |
| 464397471 |
|
Dlgap4 |
|
0 |
0 |
1 |
0 |
0 |
|
n.v. |
n.v. |
0.66 |
n.v. |
n.v. |
|
disks large-associated protein 4 isoform d |
| 464398772 |
|
Dlgap4 |
|
0 |
0 |
1 |
0 |
0 |
|
n.v. |
n.v. |
0.66 |
n.v. |
n.v. |
|
disks large-associated protein 4 isoform e |
| 109891940 |
|
Dlgap4 |
|
0 |
0 |
1 |
0 |
7871 |
|
n.v. |
n.v. |
0.66 |
n.v. |
0.11 |
|
disks large-associated protein 4 isoform b |
| 109891942 |
|
Dlgap4 |
|
0 |
0 |
1 |
0 |
7871 |
|
n.v. |
n.v. |
0.66 |
n.v. |
0.11 |
|
disks large-associated protein 4 isoform c |
| 62530192 |
|
Dlgap4 |
|
0 |
0 |
1 |
0 |
7871 |
|
n.v. |
n.v. |
0.66 |
n.v. |
0.11 |
|
disks large-associated protein 4 isoform a |
| 225543150 |
|
Dlgap5 |
|
0 |
0 |
0 |
0 |
0 |
|
n.v. |
n.v. |
n.v. |
0.59 |
n.v. |
|
disks large-associated protein 5 |
| 21313536 |
|
Dlst |
|
9483 |
24374 |
1092 |
7817 |
0 |
|
0.43 |
-0.17 |
-0.41 |
-0.22 |
n.v. |
|
dihydrolipoyllysine-residue succinyltransferase component
of 2-oxoglutarate dehydrogenase complex,
mitochondrial |
| 6681203 |
|
Dmd |
|
0 |
215 |
4108 |
0 |
0 |
|
n.v. |
-0.25 |
0.11 |
n.v. |
n.v. |
|
dystrophin |
| 283837769 |
|
Dna2 |
|
0 |
0 |
1822 |
0 |
0 |
|
n.v. |
n.v. |
0.19 |
n.v. |
n.v. |
|
DNA replication ATP-dependent helicase/nuclease DNA2 |
| 13386136 |
|
Dnaaf1 |
|
0 |
8 |
45 |
0 |
0 |
|
n.v. |
0.25 |
-0.05 |
n.v. |
n.v. |
|
dynein assembly factor 1, axonemal |
| 66793421 |
|
Dnaaf2 |
|
0 |
0 |
0 |
0 |
1071 |
|
n.v. |
n.v. |
n.v. |
n.v. |
0.1 |
|
protein kintoun |
| 256773234 |
|
Dnah1 |
|
3661 |
0 |
2919 |
5984 |
0 |
|
0.14 |
n.v. |
0.04 |
0 |
n.v. |
|
dynein, axonemal, heavy chain 1 |
| 254692843 |
|
Dnah10 |
|
3661 |
0 |
3275 |
5984 |
0 |
|
0.14 |
n.v. |
0.07 |
0 |
n.v. |
|
dynein heavy chain 10, axonemal |
| 393794754 |
|
Dnah11 |
|
3661 |
0 |
2919 |
5984 |
0 |
|
0.14 |
n.v. |
0.04 |
0 |
n.v. |
|
dynein, axonemal, heavy chain 11 |
| 283837762 |
|
Dnah17 |
|
0 |
0 |
28 |
0 |
0 |
|
n.v. |
n.v. |
0.12 |
n.v. |
n.v. |
|
dynein heavy chain 17, axonemal |
| 342672105 |
|
Dnah5 |
|
3661 |
0 |
2919 |
5984 |
76166 |
|
0.14 |
n.v. |
0.04 |
0 |
-0.12 |
|
dynein heavy chain 5, axonemal |
| 153792273 |
|
Dnah8 |
|
3661 |
0 |
2919 |
5984 |
0 |
|
0.14 |
n.v. |
0.04 |
0 |
n.v. |
|
dynein heavy chain 8, axonemal |
| 153791933 |
|
Dnah9 |
|
0 |
0 |
34 |
0 |
0 |
|
n.v. |
n.v. |
-0.47 |
n.v. |
n.v. |
|
dynein heavy chain 9, axonemal |
| 407262105 |
|
Dnahc12 |
|
3661 |
0 |
2919 |
5984 |
0 |
|
0.14 |
n.v. |
0.04 |
0 |
n.v. |
|
PREDICTED: dynein heavy chain 12, axonemal |
| 407264021 |
|
Dnahc12 |
|
3661 |
0 |
2919 |
5984 |
0 |
|
0.14 |
n.v. |
0.04 |
0 |
n.v. |
|
PREDICTED: dynein heavy chain 12, axonemal |
| 377833725 |
|
Dnahc14 |
|
0 |
0 |
31 |
0 |
0 |
|
n.v. |
n.v. |
0.63 |
n.v. |
n.v. |
|
PREDICTED: dynein heavy chain 14, axonemal |
| 377834821 |
|
Dnahc14 |
|
0 |
0 |
31 |
0 |
0 |
|
n.v. |
n.v. |
0.63 |
n.v. |
n.v. |
|
PREDICTED: dynein heavy chain 14, axonemal |
| 6680297;258547146 |
|
Dnaja1 |
|
5400 |
0 |
0 |
0 |
0 |
|
-0.27 |
n.v. |
n.v. |
n.v. |
n.v. |
|
dnaJ homolog subfamily A member 1 |
| 258547146 |
|
Dnaja1 |
|
0 |
14585 |
13926 |
16641 |
22618 |
|
n.v. |
0.07 |
0.09 |
0.29 |
0.16 |
|
dnaJ homolog subfamily A member 1 |
| 9789937 |
|
Dnaja2 |
|
31651 |
18406 |
17994 |
17476 |
24396 |
|
-0.12 |
0.06 |
0.01 |
0.33 |
0.3 |
|
dnaJ homolog subfamily A member 2 |
| 205361112 |
|
Dnaja3 |
|
11313 |
4785 |
0 |
0 |
0 |
|
0.24 |
-0.34 |
n.v. |
n.v. |
n.v. |
|
dnaJ homolog subfamily A member 3, mitochondrial isoform
1 |
| 205361114 |
|
Dnaja3 |
|
11313 |
4785 |
0 |
0 |
0 |
|
0.24 |
-0.34 |
n.v. |
n.v. |
n.v. |
|
dnaJ homolog subfamily A member 3, mitochondrial isoform
2 |
| 9055242 |
|
Dnajb1 |
|
0 |
564 |
3870 |
15708 |
14062 |
|
n.v. |
0.26 |
0.09 |
0.29 |
-0.15 |
|
dnaJ homolog subfamily B member 1 |
| 110625998 |
|
Dnajb11 |
|
23670 |
5933 |
4090 |
819 |
0 |
|
0.06 |
-0.18 |
-0.34 |
0.06 |
n.v. |
|
dnaJ homolog subfamily B member 11 precursor |
| 31982701 |
|
Dnajb12 |
|
0 |
0 |
13 |
0 |
0 |
|
n.v. |
-2.43 |
-0.46 |
n.v. |
n.v. |
|
dnaJ homolog subfamily B member 12 |
| 229577334;30017349 |
|
Dnajb2 |
|
0 |
0 |
571 |
0 |
0 |
|
n.v. |
n.v. |
-0.12 |
n.v. |
n.v. |
|
dnaJ homolog subfamily B member 2 isoform 2 |
| 30017349 |
|
Dnajb2 |
|
0 |
914 |
0 |
1351 |
0 |
|
n.v. |
-0.11 |
n.v. |
-0.05 |
n.v. |
|
dnaJ homolog subfamily B member 2 isoform 2 |
| 229577329 |
|
Dnajb2 |
|
0 |
914 |
571 |
1351 |
0 |
|
n.v. |
-0.11 |
-0.12 |
-0.05 |
n.v. |
|
dnaJ homolog subfamily B member 2 isoform 1 |
| 229577332 |
|
Dnajb2 |
|
0 |
914 |
571 |
1351 |
0 |
|
n.v. |
-0.11 |
-0.12 |
-0.05 |
n.v. |
|
dnaJ homolog subfamily B member 2 isoform 3 |
| 21313156;165377271 |
|
Dnajb4 |
|
0 |
0 |
4094 |
0 |
0 |
|
n.v. |
n.v. |
-0.02 |
n.v. |
n.v. |
|
dnaJ homolog subfamily B member 4 |
| 165377271 |
|
Dnajb4 |
|
0 |
397 |
0 |
27594 |
10442 |
|
n.v. |
0.54 |
n.v. |
0.2 |
0.27 |
|
dnaJ homolog subfamily B member 4 |
| 188219642 |
|
Dnajb6 |
|
0 |
1875 |
1046 |
2603 |
5805 |
|
n.v. |
0.06 |
0.14 |
-0.94 |
-0.07 |
|
dnaJ homolog subfamily B member 6 isoform b |
| 188219644 |
|
Dnajb6 |
|
0 |
2789 |
1618 |
3962 |
5805 |
|
n.v. |
-0.03 |
0.12 |
-0.05 |
-0.07 |
|
dnaJ homolog subfamily B member 6 isoform d |
| 83816903 |
|
Dnajb6 |
|
0 |
2789 |
1618 |
3962 |
5805 |
|
n.v. |
-0.03 |
0.12 |
-0.05 |
-0.07 |
|
dnaJ homolog subfamily B member 6 isoform c |
| 83816907 |
|
Dnajb6 |
|
0 |
3945 |
1894 |
3962 |
5805 |
|
n.v. |
0.09 |
0.14 |
-0.05 |
-0.07 |
|
dnaJ homolog subfamily B member 6 isoform a |
| 119392096 |
|
Dnajb7 |
|
0 |
875 |
57 |
1866 |
2934 |
|
n.v. |
-1.27 |
0.15 |
-1.88 |
-0.11 |
|
dnaJ homolog subfamily B member 7 |
| 7106295 |
|
Dnajc1 |
|
0 |
0 |
0 |
0 |
835 |
|
n.v. |
n.v. |
n.v. |
n.v. |
-0.36 |
|
dnaJ homolog subfamily C member 1 precursor |
| 119508443 |
|
Dnajc10 |
|
4467 |
3135 |
1488 |
0 |
0 |
|
0 |
-0.26 |
-0.29 |
n.v. |
n.v. |
|
dnaJ homolog subfamily C member 10 precursor |
| 164565394 |
|
Dnajc11 |
|
0 |
3916 |
73 |
0 |
0 |
|
n.v. |
-0.18 |
-0.37 |
n.v. |
n.v. |
|
dnaJ homolog subfamily C member 11 |
| 247494234 |
|
Dnajc13 |
|
2801 |
12492 |
14234 |
1211 |
0 |
|
0.14 |
-0.1 |
0 |
0.29 |
n.v. |
|
DnaJ (Hsp40) homolog, subfamily C, member 13 |
| 71061474 |
|
Dnajc19 |
|
714 |
977 |
76 |
0 |
0 |
|
0 |
-0.15 |
-0.13 |
n.v. |
n.v. |
|
mitochondrial import inner membrane translocase subunit
TIM14 isoform 2 |
| 309268906 |
|
Dnajc19-ps |
|
714 |
977 |
76 |
0 |
0 |
|
0 |
-0.15 |
-0.13 |
n.v. |
n.v. |
|
PREDICTED: mitochondrial import inner membrane
translocase subunit TIM14-like |
| 6677659 |
|
Dnajc2 |
|
1556 |
190 |
15715 |
18483 |
1424 |
|
0.08 |
0.08 |
0.05 |
0.05 |
-0.69 |
|
dnaJ homolog subfamily C member 2 |
| 190194391 |
|
Dnajc21 |
|
0 |
0 |
0 |
9896 |
0 |
|
n.v. |
n.v. |
n.v. |
-0.19 |
n.v. |
|
DnaJ (Hsp40) homolog, subfamily C, member 21 |
| 21729759 |
|
Dnajc24 |
|
0 |
0 |
0 |
0 |
2806 |
|
n.v. |
n.v. |
n.v. |
n.v. |
0.09 |
|
dnaJ homolog subfamily C member 24 |
| 239985468 |
|
Dnajc25 |
|
0 |
0 |
0 |
1744 |
0 |
|
n.v. |
n.v. |
n.v. |
-0.02 |
n.v. |
|
dnaJ homolog subfamily C member 25 precursor |
| 31542563 |
|
Dnajc3 |
|
0 |
3071 |
534 |
0 |
0 |
|
n.v. |
-0.17 |
-0.07 |
n.v. |
n.v. |
|
dnaJ homolog subfamily C member 3 precursor |
| 10181196 |
|
Dnajc4 |
|
0 |
0 |
0 |
8 |
0 |
|
n.v. |
n.v. |
n.v. |
0.23 |
n.v. |
|
dnaJ homolog subfamily C member 4 |
| 7949027 |
|
Dnajc5 |
|
0 |
1420 |
591 |
0 |
0 |
|
n.v. |
-0.04 |
-0.22 |
n.v. |
n.v. |
|
dnaJ homolog subfamily C member 5 |
| 31980994 |
|
Dnajc7 |
|
0 |
1303 |
2350 |
655 |
3663 |
|
n.v. |
0.13 |
0.02 |
0.38 |
-0.05 |
|
dnaJ homolog subfamily C member 7 |
| 157951606 |
|
Dnajc8 |
|
3478 |
0 |
678 |
2693 |
26249 |
|
0.18 |
n.v. |
0.18 |
0.03 |
0.03 |
|
dnaJ homolog subfamily C member 8 |
| 23956266 |
|
Dnajc9 |
|
4668 |
5845 |
5758 |
27798 |
6918 |
|
0.08 |
0.39 |
0.12 |
0.19 |
0.14 |
|
dnaJ homolog subfamily C member 9 |
| 164607162 |
|
Dnal1 |
|
0 |
0 |
0 |
0 |
257 |
|
n.v. |
n.v. |
n.v. |
n.v. |
0.28 |
|
dynein light chain 1, axonemal |
| 148539953 |
|
Dnase1l2 |
|
21491 |
5797 |
609 |
0 |
0 |
|
-0.23 |
-0.18 |
-0.05 |
n.v. |
n.v. |
|
deoxyribonuclease-1-like 2 precursor |
| 6753654 |
|
Dnase2a |
|
0 |
1939 |
51 |
0 |
964 |
|
n.v. |
0.24 |
0.27 |
n.v. |
0.33 |
|
deoxyribonuclease-2-alpha precursor |
| 110625712 |
|
Dnlz |
|
0 |
192 |
0 |
0 |
0 |
|
n.v. |
-0.33 |
n.v. |
n.v. |
n.v. |
|
DNL-type zinc finger protein isoform 1 |
| 218777849 |
|
Dnlz |
|
0 |
75 |
0 |
0 |
0 |
|
n.v. |
-0.32 |
n.v. |
n.v. |
n.v. |
|
DNL-type zinc finger protein isoform 2 |
| 218777851 |
|
Dnlz |
|
0 |
75 |
0 |
0 |
0 |
|
n.v. |
-0.32 |
n.v. |
n.v. |
n.v. |
|
DNL-type zinc finger protein isoform 3 |
| 116063570 |
|
Dnm1 |
|
0 |
2215 |
5483 |
2145 |
15218 |
|
n.v. |
-0.02 |
-0.21 |
-0.57 |
0.12 |
|
dynamin-1 |
| 448261635 |
|
Dnm1l |
|
0 |
9623 |
14093 |
47820 |
47625 |
|
n.v. |
0.03 |
-0.04 |
0.1 |
0.06 |
|
dynamin-1-like protein isoform c |
| 448261637 |
|
Dnm1l |
|
0 |
5843 |
12184 |
40985 |
39411 |
|
n.v. |
0.02 |
-0.07 |
0.09 |
0.04 |
|
dynamin-1-like protein isoform d |
| 71061455 |
|
Dnm1l |
|
0 |
9623 |
14093 |
48630 |
52262 |
|
n.v. |
0.03 |
-0.04 |
0.11 |
0.04 |
|
dynamin-1-like protein isoform b |
| 71061458 |
|
Dnm1l |
|
0 |
9623 |
14093 |
48630 |
47625 |
|
n.v. |
0.03 |
-0.04 |
0.11 |
0.06 |
|
dynamin-1-like protein isoform a |
| 359751391 |
|
Dnm2 |
|
1483 |
4772 |
10572 |
22388 |
30522 |
|
0.66 |
-0.12 |
0.08 |
-0.04 |
-0.05 |
|
dynamin-2 isoform 1 |
| 359751394 |
|
Dnm2 |
|
1483 |
4772 |
9896 |
22388 |
30522 |
|
0.66 |
-0.12 |
0.08 |
-0.04 |
-0.05 |
|
dynamin-2 isoform 3 |
| 359751399 |
|
Dnm2 |
|
1483 |
4772 |
10572 |
22388 |
30522 |
|
0.66 |
-0.12 |
0.08 |
-0.04 |
-0.05 |
|
dynamin-2 isoform 4 |
| 87299637 |
|
Dnm2 |
|
1483 |
4793 |
10572 |
21905 |
30522 |
|
0.66 |
-0.13 |
0.08 |
-0.04 |
-0.05 |
|
dynamin-2 isoform 2 |
| 27369922 |
|
Dnm3 |
|
0 |
2914 |
4229 |
3381 |
15368 |
|
n.v. |
0.02 |
-0.61 |
-0.31 |
0.14 |
|
dynamin-3 isoform 2 |
| 84490431 |
|
Dnm3 |
|
0 |
2914 |
4229 |
3381 |
15368 |
|
n.v. |
0.02 |
-0.61 |
-0.31 |
0.14 |
|
dynamin-3 isoform 1 |
| 313661497 |
|
Dnmt1 |
|
55376 |
975 |
17656 |
11468 |
118 |
|
-0.05 |
0.01 |
-0.15 |
-0.25 |
-0.13 |
|
DNA (cytosine-5)-methyltransferase 1 isoform 3 |
| 313661499 |
|
Dnmt1 |
|
55376 |
975 |
17715 |
11468 |
118 |
|
-0.05 |
0.01 |
-0.15 |
-0.25 |
-0.13 |
|
DNA (cytosine-5)-methyltransferase 1 isoform 4 |
| 327180732 |
|
Dnmt1 |
|
57151 |
975 |
17715 |
11468 |
257 |
|
-0.05 |
0.01 |
-0.15 |
-0.25 |
-0.13 |
|
DNA (cytosine-5)-methyltransferase 1 isoform 1 |
| 327180734 |
|
Dnmt1 |
|
57151 |
975 |
17656 |
11468 |
257 |
|
-0.05 |
0.01 |
-0.15 |
-0.25 |
-0.13 |
|
DNA (cytosine-5)-methyltransferase 1 isoform 2 |
| 161016820 |
|
Dnpep |
|
2947 |
3766 |
6515 |
341338 |
20220 |
|
-0.17 |
-0.04 |
0 |
0.12 |
-0.07 |
|
aspartyl aminopeptidase isoform b |
| 161016822 |
|
Dnpep |
|
2947 |
3766 |
6515 |
341338 |
20220 |
|
-0.17 |
-0.04 |
0 |
0.12 |
-0.07 |
|
aspartyl aminopeptidase isoform a |
| 110625744 |
|
Dnph1 |
|
0 |
714 |
278 |
0 |
16428 |
|
n.v. |
0.16 |
0.14 |
n.v. |
0.2 |
|
2'-deoxynucleoside 5'-phosphate N-hydrolase 1 |
| 24418931 |
|
Dnttip2 |
|
549 |
0 |
0 |
0 |
0 |
|
-0.18 |
n.v. |
n.v. |
n.v. |
n.v. |
|
deoxynucleotidyltransferase terminal-interacting protein
2 |
| 88853584 |
|
Dock1 |
|
0 |
1576 |
5410 |
21602 |
18635 |
|
n.v. |
0.2 |
0.11 |
0.03 |
0.02 |
|
dedicator of cytokinesis protein 1 |
| 148277096 |
|
Dock3 |
|
0 |
0 |
126 |
0 |
0 |
|
n.v. |
n.v. |
0 |
n.v. |
n.v. |
|
dedicator of cytokinesis protein 3 |
| 124358946 |
|
Dock5 |
|
0 |
0 |
0 |
458 |
0 |
|
n.v. |
n.v. |
n.v. |
0.06 |
n.v. |
|
dedicator of cytokinesis protein 5 |
| 78191789 |
|
Dock7 |
|
0 |
0 |
268 |
368 |
0 |
|
n.v. |
n.v. |
-0.22 |
0.69 |
n.v. |
|
dedicator of cytokinesis protein 7 |
| 62241030 |
|
Dock8 |
|
0 |
987 |
519 |
696 |
0 |
|
n.v. |
-0.1 |
0.24 |
-0.46 |
n.v. |
|
dedicator of cytokinesis protein 8 |
| 124486664 |
|
Dock9 |
|
0 |
386 |
998 |
0 |
878 |
|
n.v. |
0.12 |
0.16 |
n.v. |
-0.27 |
|
dedicator of cytokinesis protein 9 isoform 1 |
| 190194397 |
|
Dock9 |
|
0 |
386 |
998 |
0 |
878 |
|
n.v. |
0.12 |
0.16 |
n.v. |
-0.27 |
|
dedicator of cytokinesis protein 9 isoform 2 |
| 190194399 |
|
Dock9 |
|
0 |
386 |
998 |
0 |
878 |
|
n.v. |
0.12 |
0.16 |
n.v. |
-0.27 |
|
dedicator of cytokinesis protein 9 isoform 3 |
| 190194401 |
|
Dock9 |
|
0 |
386 |
998 |
0 |
878 |
|
n.v. |
0.12 |
0.16 |
n.v. |
-0.27 |
|
dedicator of cytokinesis protein 9 isoform 4 |
| 284005490 |
|
Dohh |
|
0 |
0 |
0 |
0 |
8610 |
|
n.v. |
n.v. |
n.v. |
n.v. |
0.07 |
|
deoxyhypusine hydroxylase |
| 190194414 |
|
Dopey1 |
|
0 |
0 |
0 |
131 |
0 |
|
n.v. |
n.v. |
n.v. |
0.52 |
n.v. |
|
protein dopey-1 |
| 62243808 |
|
Dopey2 |
|
0 |
4 |
0 |
0 |
32 |
|
n.v. |
-0.03 |
n.v. |
-1.37 |
0.05 |
|
protein dopey-2 isoform 1 |
| 31541998 |
|
Dpcd |
|
0 |
0 |
176 |
6147 |
0 |
|
n.v. |
n.v. |
-0.59 |
0.45 |
n.v. |
|
protein DPCD |
| 21313683 |
|
Dpep3 |
|
0 |
0 |
142 |
0 |
0 |
|
n.v. |
n.v. |
-0.03 |
n.v. |
n.v. |
|
dipeptidase 3 precursor |
| 6755314 |
|
Dpf2 |
|
476 |
0 |
0 |
0 |
0 |
|
1.15 |
n.v. |
n.v. |
n.v. |
n.v. |
|
zinc finger protein ubi-d4 |
| 118026919 |
|
Dph1 |
|
0 |
0 |
63 |
0 |
900 |
|
n.v. |
n.v. |
-0.01 |
n.v. |
-0.25 |
|
diphthamide biosynthesis protein 1 |
| 33468993 |
|
Dph2 |
|
0 |
0 |
0 |
0 |
1189 |
|
n.v. |
n.v. |
n.v. |
n.v. |
0.29 |
|
diphthamide biosynthesis protein 2 |
| 40254183 |
|
Dph5 |
|
0 |
0 |
0 |
0 |
1371 |
|
n.v. |
n.v. |
n.v. |
n.v. |
0.32 |
|
diphthine synthase |
| 13385136 |
|
Dph6 |
|
0 |
0 |
0 |
0 |
2881 |
|
n.v. |
n.v. |
n.v. |
n.v. |
0.24 |
|
ATP-binding domain-containing protein 4 |
| 21313066 |
|
Dph7 |
|
0 |
0 |
0 |
0 |
1971 |
|
n.v. |
n.v. |
n.v. |
n.v. |
0.7 |
|
WD repeat-containing protein 85 |
| 6753670 |
|
Dpm1 |
|
24457 |
5290 |
2587 |
868 |
0 |
|
-0.06 |
-0.3 |
-0.39 |
-0.33 |
n.v. |
|
dolichol-phosphate mannosyltransferase |
| 58037125 |
|
Dpm3 |
|
17464 |
211 |
1977 |
0 |
0 |
|
-0.09 |
-0.07 |
-0.41 |
n.v. |
n.v. |
|
dolichol-phosphate mannosyltransferase subunit 3
precursor |
| 244791124 |
|
Dpp3 |
|
183 |
7607 |
16955 |
11214 |
67727 |
|
0.41 |
0.2 |
0.02 |
0.15 |
0.16 |
|
dipeptidyl peptidase 3 |
| 227116292 |
|
Dpp4 |
|
0 |
0 |
45 |
0 |
0 |
|
n.v. |
n.v. |
-0.32 |
n.v. |
n.v. |
|
dipeptidyl peptidase 4 isoform 2 |
| 6753674 |
|
Dpp4 |
|
0 |
0 |
45 |
0 |
0 |
|
n.v. |
n.v. |
-0.32 |
n.v. |
n.v. |
|
dipeptidyl peptidase 4 isoform 1 |
| 31981425 |
|
Dpp7 |
|
27496 |
4204 |
5954 |
868 |
30436 |
|
0 |
-0.12 |
-0.3 |
-0.29 |
-0.18 |
|
dipeptidyl peptidase 2 precursor |
| 255003757 |
|
Dpp9 |
|
0 |
0 |
91 |
0 |
2527 |
|
n.v. |
n.v. |
-1.47 |
n.v. |
-0.14 |
|
dipeptidyl peptidase 9 |
| 226246654 |
|
Dpy30 |
|
0 |
708 |
858 |
5648 |
7025 |
|
n.v. |
-0.01 |
0.01 |
0.03 |
-0.19 |
|
protein dpy-30 homolog |
| 40254595 |
|
Dpysl2 |
|
17922 |
13915 |
38781 |
219676 |
87507 |
|
0.14 |
0.18 |
0.07 |
0.2 |
-0.04 |
|
dihydropyrimidinase-related protein 2 |
| 209862992 |
|
Dpysl3 |
|
0 |
58 |
4429 |
17149 |
5237 |
|
n.v. |
0.5 |
0.06 |
0.32 |
0.25 |
|
dihydropyrimidinase-related protein 3 isoform 1 |
| 6681219 |
|
Dpysl3 |
|
0 |
58 |
4429 |
17149 |
5237 |
|
n.v. |
0.5 |
0.06 |
0.32 |
0.25 |
|
dihydropyrimidinase-related protein 3 isoform 2 |
| 12746424 |
|
Dpysl5 |
|
0 |
1092 |
161 |
12868 |
9210 |
|
n.v. |
0.38 |
0.11 |
0.29 |
-0.04 |
|
dihydropyrimidinase-related protein 5 |
| 27754097 |
|
Dr1 |
|
0 |
0 |
92 |
868 |
803 |
|
n.v. |
n.v. |
-0.06 |
0.06 |
0.29 |
|
protein Dr1 |
| 21313106 |
|
Dram2 |
|
0 |
1505 |
672 |
0 |
0 |
|
n.v. |
-0.42 |
-0.23 |
n.v. |
n.v. |
|
DNA damage-regulated autophagy modulator protein 2
isoform 2 |
| 70980526 |
|
Dram2 |
|
0 |
1505 |
672 |
0 |
0 |
|
n.v. |
-0.42 |
-0.23 |
n.v. |
n.v. |
|
DNA damage-regulated autophagy modulator protein 2
isoform 1 |
| 21313424 |
|
Drap1 |
|
0 |
269 |
360 |
4674 |
5515 |
|
n.v. |
-0.26 |
-0.2 |
-0.01 |
0.08 |
|
dr1-associated corepressor |
| 6681225 |
|
Drg1 |
|
1648 |
2868 |
25560 |
69905 |
3909 |
|
0.17 |
0.16 |
-0.02 |
0.06 |
-0.2 |
|
developmentally-regulated GTP-binding protein 1 |
| 10946678 |
|
Drg2 |
|
0 |
65 |
10896 |
9831 |
76798 |
|
n.v. |
0.23 |
0.01 |
0.02 |
0.08 |
|
developmentally-regulated GTP-binding protein 2 |
| 194328670 |
|
Drosha |
|
0 |
0 |
9 |
0 |
0 |
|
n.v. |
n.v. |
0.03 |
n.v. |
n.v. |
|
ribonuclease 3 |
| 62821774 |
|
Dscc1 |
|
0 |
0 |
78 |
5353 |
3159 |
|
n.v. |
n.v. |
-0.28 |
0.1 |
-0.04 |
|
sister chromatid cohesion protein DCC1 |
| 6681145 |
|
Dscr3 |
|
0 |
4430 |
973 |
15348 |
428 |
|
n.v. |
-0.17 |
-0.24 |
0.23 |
0.24 |
|
Down syndrome critical region protein 3 homolog |
| 169234958 |
|
Dsg1a |
|
128 |
0 |
0 |
0 |
0 |
|
-6.47 |
n.v. |
n.v. |
n.v. |
n.v. |
|
desmoglein-1-alpha precursor |
| 32129201 |
|
Dsg1b |
|
128 |
0 |
0 |
0 |
0 |
|
-6.47 |
n.v. |
n.v. |
n.v. |
n.v. |
|
desmoglein-1-beta precursor |
| 161016843 |
|
Dsg2 |
|
0 |
313 |
60 |
0 |
0 |
|
n.v. |
-0.19 |
-0.74 |
n.v. |
n.v. |
|
desmoglein-2 precursor |
| 254540034 |
|
Dsn1 |
|
0 |
25 |
31 |
958 |
471 |
|
n.v. |
-0.04 |
0.05 |
0.15 |
0.05 |
|
kinetochore-associated protein DSN1 homolog |
| 190194418 |
|
Dsp |
|
37857 |
1697 |
4623 |
5132 |
84605 |
|
-0.16 |
-0.04 |
-0.23 |
0.07 |
0.04 |
|
desmoplakin |
| 454525117 |
|
Dst |
|
0 |
284 |
214 |
0 |
0 |
|
n.v. |
0.33 |
-0.01 |
n.v. |
n.v. |
|
dystonin isoform 1 |
| 111154076 |
|
Dst |
|
0 |
284 |
474 |
1326 |
1446 |
|
n.v. |
0.33 |
-0.01 |
0.12 |
-0.33 |
|
dystonin isoform 2 |
| 111154082 |
|
Dst |
|
0 |
284 |
474 |
1187 |
1446 |
|
n.v. |
0.33 |
-0.01 |
-0.01 |
-0.33 |
|
dystonin isoform 3 |
| 9790219 |
|
Dstn |
|
73297 |
31507 |
40645 |
20857 |
275020 |
|
0.22 |
0.11 |
0.06 |
0.33 |
0.05 |
|
destrin |
| 13384676 |
|
Dtd1 |
|
0 |
491 |
237 |
4510 |
5847 |
|
n.v. |
0.31 |
-0.14 |
0.01 |
-0.34 |
|
D-tyrosyl-tRNA(Tyr) deacylase 1 |
| 31324532 |
|
Dtd2 |
|
0 |
672 |
1629 |
11877 |
8793 |
|
n.v. |
0.16 |
-0.04 |
0.18 |
0.19 |
|
probable D-tyrosyl-tRNA(Tyr) deacylase 2 |
| 46519164 |
|
Dtna |
|
0 |
0 |
1324 |
0 |
0 |
|
n.v. |
n.v. |
-0.02 |
n.v. |
n.v. |
|
dystrobrevin alpha isoform 1 |
| 247269547 |
|
Dtnb |
|
860 |
2756 |
3633 |
0 |
0 |
|
-1.13 |
0.03 |
0.1 |
n.v. |
n.v. |
|
dystrobrevin beta isoform b |
| 247269964 |
|
Dtnb |
|
860 |
2756 |
3633 |
0 |
0 |
|
-1.13 |
0.03 |
0.1 |
n.v. |
n.v. |
|
dystrobrevin beta isoform a |
| 133930784 |
|
Dtx3l |
|
0 |
305 |
2270 |
1834 |
0 |
|
n.v. |
-0.08 |
0.03 |
0.3 |
n.v. |
|
E3 ubiquitin-protein ligase DTX3L |
| 12963517 |
|
Dtymk |
|
2361 |
2983 |
613 |
1277 |
24311 |
|
0.15 |
-0.12 |
0.08 |
0.19 |
0.02 |
|
thymidylate kinase isoform 2 |
| 157785665 |
|
Dtymk |
|
4869 |
6561 |
2634 |
2701 |
53355 |
|
0.1 |
0.1 |
-0.05 |
0.21 |
0.07 |
|
thymidylate kinase isoform 1 |
| 31980834 |
|
Dus1l |
|
0 |
0 |
0 |
0 |
257 |
|
n.v. |
n.v. |
n.v. |
n.v. |
0.68 |
|
tRNA-dihydrouridine(16/17) synthase [NAD(P)(+)]-like |
| 255003775 |
|
Dus3l |
|
0 |
251 |
394 |
4166 |
0 |
|
n.v. |
0.8 |
0.1 |
0.3 |
n.v. |
|
tRNA-dihydrouridine(47) synthase [NAD(P)(+)]-like |
| 19527288 |
|
Dusp22 |
|
0 |
420 |
72 |
483 |
64 |
|
n.v. |
0.12 |
-0.11 |
-0.11 |
0.54 |
|
dual specificity protein phosphatase 22 isoform b |
| 83816915 |
|
Dusp22 |
|
0 |
420 |
72 |
303 |
64 |
|
n.v. |
0.12 |
-0.11 |
-0.11 |
0.54 |
|
dual specificity protein phosphatase 22 isoform a |
| 29171320 |
|
Dusp28 |
|
0 |
0 |
0 |
0 |
2088 |
|
n.v. |
n.v. |
n.v. |
n.v. |
0.24 |
|
dual specificity phosphatase 28 |
| 21312314 |
|
Dusp3 |
|
0 |
1868 |
618 |
1121 |
11491 |
|
n.v. |
0.32 |
0.31 |
0.48 |
0.09 |
|
dual specificity protein phosphatase 3 |
| 21281687 |
|
Dut |
|
2233 |
1286 |
1589 |
1359 |
11127 |
|
0.37 |
0.12 |
0 |
0.13 |
0.08 |
|
deoxyuridine triphosphatase isoform 2 |
| 227497222 |
|
Dut |
|
2233 |
1286 |
1444 |
1326 |
11031 |
|
0.37 |
0.12 |
0 |
0.24 |
0.08 |
|
deoxyuridine triphosphatase isoform 1 |
| 87299588 |
|
Dvl2 |
|
0 |
0 |
16 |
0 |
0 |
|
n.v. |
n.v. |
-0.23 |
n.v. |
n.v. |
|
segment polarity protein dishevelled homolog DVL-2 |
| 117168287 |
|
Dvl3 |
|
0 |
0 |
16 |
0 |
0 |
|
n.v. |
n.v. |
-0.23 |
n.v. |
n.v. |
|
segment polarity protein dishevelled homolog DVL-3 |
| 254939704 |
|
Dxo |
|
0 |
0 |
142 |
0 |
0 |
|
n.v. |
n.v. |
-0.13 |
n.v. |
n.v. |
|
protein Dom3Z |
| 25282389 |
|
Dym |
|
0 |
17 |
0 |
802 |
0 |
|
n.v. |
0.12 |
n.v. |
0.02 |
n.v. |
|
dymeclin |
| 134288917 |
|
Dync1h1 |
|
7579 |
84722 |
174442 |
2323914 |
75995 |
|
0.1 |
0.09 |
-0.04 |
0.08 |
-0.12 |
|
cytoplasmic dynein 1 heavy chain 1 |
| 311893374 |
|
Dync1i2 |
|
0 |
553 |
9349 |
52142 |
4798 |
|
n.v. |
0.06 |
-0.02 |
0.08 |
-0.01 |
|
cytoplasmic dynein 1 intermediate chain 2 isoform 1 |
| 311893376 |
|
Dync1i2 |
|
0 |
553 |
9349 |
55163 |
4798 |
|
n.v. |
0.06 |
-0.02 |
0.08 |
-0.01 |
|
cytoplasmic dynein 1 intermediate chain 2 isoform 2 |
| 311893378 |
|
Dync1i2 |
|
0 |
553 |
9349 |
59042 |
4798 |
|
n.v. |
0.06 |
-0.02 |
0.08 |
-0.01 |
|
cytoplasmic dynein 1 intermediate chain 2 isoform 3 |
| 311893380 |
|
Dync1i2 |
|
0 |
553 |
9349 |
55310 |
4798 |
|
n.v. |
0.06 |
-0.02 |
0.08 |
-0.01 |
|
cytoplasmic dynein 1 intermediate chain 2 isoform 4 |
| 6753658 |
|
Dync1i2 |
|
0 |
553 |
9349 |
59042 |
4798 |
|
n.v. |
0.06 |
-0.02 |
0.08 |
-0.01 |
|
cytoplasmic dynein 1 intermediate chain 2 isoform 5 |
| 22122795 |
|
Dync1li1 |
|
0 |
820 |
8039 |
62178 |
5376 |
|
n.v. |
0.55 |
-0.02 |
0.1 |
0.11 |
|
cytoplasmic dynein 1 light intermediate chain 1 |
| 225543181 |
|
Dync1li2 |
|
0 |
2676 |
9598 |
64977 |
4273 |
|
n.v. |
0.14 |
-0.05 |
0.13 |
-0.1 |
|
cytoplasmic dynein 1 light intermediate chain 2 |
| 72534792 |
|
Dync2h1 |
|
0 |
61 |
208 |
909 |
0 |
|
n.v. |
0.08 |
0.16 |
0.23 |
n.v. |
|
cytoplasmic dynein 2 heavy chain 1 |
| 26986541 |
|
Dync2li1 |
|
0 |
0 |
0 |
147 |
0 |
|
n.v. |
n.v. |
n.v. |
0.06 |
n.v. |
|
cytoplasmic dynein 2 light intermediate chain 1 |
| 213688406 |
|
Dynll1 |
|
35532 |
3568 |
8042 |
18540 |
4787 |
|
-0.04 |
0.1 |
-0.01 |
0 |
-0.01 |
|
dynein light chain 1, cytoplasmic |
| 281182473;18087731 |
|
Dynll2 |
|
35532 |
0 |
5154 |
0 |
0 |
|
-0.04 |
n.v. |
0 |
n.v. |
n.v. |
|
dynein light chain 2, cytoplasmic |
| 18087731 |
|
Dynll2 |
|
0 |
2463 |
0 |
17337 |
2099 |
|
n.v. |
0.11 |
n.v. |
-0.01 |
-0.06 |
|
dynein light chain 2, cytoplasmic |
| 254540041 |
|
Dynlrb1 |
|
897 |
173 |
944 |
1342 |
2474 |
|
0.02 |
0.04 |
-0.02 |
0.05 |
-0.05 |
|
dynein light chain roadblock-type 1 |
| 262231815 |
|
Dynlt1a |
|
0 |
1879 |
0 |
44153 |
1585 |
|
n.v. |
0.17 |
n.v. |
0.03 |
0.02 |
|
dynein light chain Tctex-type 1A |
| 6678265;262231815 |
|
Dynlt1b |
|
0 |
0 |
3661 |
0 |
0 |
|
n.v. |
n.v. |
-0.02 |
n.v. |
n.v. |
|
dynein light chain Tctex-type 1 |
| 315711043 |
|
Dynlt1f |
|
0 |
1879 |
3530 |
43662 |
1585 |
|
n.v. |
0.17 |
0 |
0.03 |
0.02 |
|
dynein light chain Tctex-type 1F isoform 2 |
| 31543851 |
|
Dynlt3 |
|
0 |
0 |
20 |
532 |
0 |
|
n.v. |
n.v. |
-0.92 |
0.22 |
n.v. |
|
dynein light chain Tctex-type 3 |
| 164607150 |
|
Dyrk1a |
|
0 |
0 |
53 |
0 |
0 |
|
n.v. |
n.v. |
-0.46 |
n.v. |
n.v. |
|
dual specificity tyrosine-phosphorylation-regulated
kinase 1A |
| 406035327 |
|
Dyrk1b |
|
0 |
0 |
53 |
0 |
0 |
|
n.v. |
n.v. |
-0.46 |
n.v. |
n.v. |
|
dual specificity tyrosine-phosphorylation-regulated
kinase 1B isoform c |
| 6753698 |
|
Dyrk1b |
|
0 |
0 |
53 |
0 |
0 |
|
n.v. |
n.v. |
-0.46 |
n.v. |
n.v. |
|
dual specificity tyrosine-phosphorylation-regulated
kinase 1B isoform a |
| 83816922 |
|
Dyrk1b |
|
0 |
0 |
53 |
0 |
0 |
|
n.v. |
n.v. |
-0.46 |
n.v. |
n.v. |
|
dual specificity tyrosine-phosphorylation-regulated
kinase 1B isoform b |
| 116174791 |
|
Dysf |
|
0 |
2382 |
4590 |
0 |
0 |
|
n.v. |
-0.2 |
-0.06 |
n.v. |
n.v. |
|
dysferlin isoform 1 |
| 118026931 |
|
Dysf |
|
0 |
2382 |
4590 |
0 |
0 |
|
n.v. |
-0.2 |
-0.06 |
n.v. |
n.v. |
|
dysferlin isoform 2 |
| 124249054 |
|
Dzip3 |
|
0 |
405 |
416 |
0 |
0 |
|
n.v. |
0.13 |
0.07 |
n.v. |
n.v. |
|
E3 ubiquitin-protein ligase DZIP3 isoform 2 |
| 158517947 |
|
Dzip3 |
|
0 |
405 |
416 |
0 |
0 |
|
n.v. |
0.13 |
0.07 |
n.v. |
n.v. |
|
E3 ubiquitin-protein ligase DZIP3 isoform 1 |
| 149234198 |
|
E030010N08Rik |
|
0 |
0 |
0 |
0 |
2303 |
|
n.v. |
n.v. |
n.v. |
n.v. |
-2.51 |
|
PREDICTED: rootletin |
| 309264118 |
|
E030010N08Rik |
|
0 |
0 |
0 |
0 |
2303 |
|
n.v. |
n.v. |
n.v. |
n.v. |
-2.51 |
|
PREDICTED: rootletin |
| 170650679 |
|
E130309D02Rik |
|
0 |
0 |
13 |
0 |
0 |
|
n.v. |
n.v. |
-0.16 |
n.v. |
n.v. |
|
uncharacterized protein C7orf26 homolog |
| 29244450 |
|
E130311K13Rik |
|
0 |
61 |
0 |
0 |
0 |
|
n.v. |
0.72 |
n.v. |
n.v. |
n.v. |
|
uncharacterized protein C3orf33 homolog |
| 319402141 |
|
E330021D16Rik |
|
0 |
0 |
0 |
0 |
2538 |
|
n.v. |
n.v. |
n.v. |
n.v. |
0.11 |
|
ubiquitin-conjugating enzyme E2 Q2-like |
| 46048300 |
|
E430025E21Rik |
|
183 |
27 |
2305 |
8726 |
10238 |
|
-0.01 |
-0.05 |
-0.09 |
-0.12 |
0.07 |
|
WASH complex subunit strumpellin |
| 21312986 |
|
Ears2 |
|
3661 |
271 |
2919 |
5984 |
0 |
|
0.14 |
-1.13 |
0.04 |
0 |
n.v. |
|
probable glutamate--tRNA ligase, mitochondrial
precursor |
| 31982524 |
|
Ebag9 |
|
0 |
184 |
0 |
0 |
0 |
|
n.v. |
-0.22 |
n.v. |
n.v. |
n.v. |
|
receptor-binding cancer antigen expressed on SiSo
cells |
| 6681255 |
|
Ebp |
|
0 |
735 |
1100 |
213 |
0 |
|
n.v. |
-0.08 |
-0.29 |
0.19 |
n.v. |
|
3-beta-hydroxysteroid-Delta(8),Delta(7)-isomerase |
| 7949037 |
|
Ech1 |
|
3606 |
5922 |
768 |
0 |
0 |
|
0.17 |
-0.09 |
-0.33 |
n.v. |
n.v. |
|
delta(3,5)-Delta(2,4)-dienoyl-CoA isomerase,
mitochondrial precursor |
| 158854020 |
|
Echdc1 |
|
0 |
1687 |
224 |
2456 |
22158 |
|
n.v. |
0.24 |
-0.18 |
0.11 |
0.03 |
|
ethylmalonyl-CoA decarboxylase isoform a |
| 158854022 |
|
Echdc1 |
|
0 |
1687 |
224 |
2456 |
22158 |
|
n.v. |
0.24 |
-0.18 |
0.11 |
0.03 |
|
ethylmalonyl-CoA decarboxylase isoform b |
| 225543400 |
|
Echdc2 |
|
1336 |
822 |
0 |
0 |
0 |
|
0 |
-0.17 |
n.v. |
n.v. |
n.v. |
|
enoyl-CoA hydratase domain-containing protein 2,
mitochondrial isoform 1 precursor |
| 363543337 |
|
Echdc2 |
|
1336 |
822 |
0 |
0 |
0 |
|
0 |
-0.17 |
n.v. |
n.v. |
n.v. |
|
enoyl-CoA hydratase domain-containing protein 2,
mitochondrial isoform 2 |
| 31980955 |
|
Echdc3 |
|
0 |
1290 |
73 |
0 |
0 |
|
n.v. |
-0.02 |
-0.14 |
n.v. |
n.v. |
|
enoyl-CoA hydratase domain-containing protein 3,
mitochondrial precursor |
| 29789289 |
|
Echs1 |
|
74890 |
21226 |
550 |
892 |
5569 |
|
0.03 |
-0.15 |
-0.31 |
-0.1 |
-0.03 |
|
enoyl-CoA hydratase, mitochondrial precursor |
| 31981810 |
|
Eci1 |
|
137002 |
47908 |
967 |
0 |
8386 |
|
-0.08 |
-0.14 |
-0.47 |
n.v. |
-0.21 |
|
enoyl-CoA delta isomerase 1, mitochondrial precursor |
| 160333193 |
|
Eci2 |
|
2252 |
161 |
1026 |
0 |
0 |
|
-0.2 |
-0.14 |
-0.29 |
n.v. |
n.v. |
|
enoyl-CoA delta isomerase 2, mitochondrial isoform a |
| 160333195 |
|
Eci2 |
|
2252 |
161 |
1026 |
0 |
0 |
|
-0.2 |
-0.14 |
-0.29 |
n.v. |
n.v. |
|
enoyl-CoA delta isomerase 2, mitochondrial isoform b |
| 21312210 |
|
Eci3 |
|
0 |
132 |
877 |
0 |
0 |
|
n.v. |
-0.14 |
-0.29 |
n.v. |
n.v. |
|
enoyl-Coenzyme A delta isomerase 3 |
| 6755522 |
|
Ecsit |
|
0 |
8 |
0 |
0 |
0 |
|
n.v. |
-0.31 |
n.v. |
n.v. |
n.v. |
|
evolutionarily conserved signaling intermediate in Toll
pathway, mitochondrial precursor |
| 24418913 |
|
Edc3 |
|
0 |
0 |
1515 |
25 |
0 |
|
n.v. |
n.v. |
0.06 |
-0.33 |
n.v. |
|
enhancer of mRNA-decapping protein 3 |
| 31712002 |
|
Edc4 |
|
0 |
0 |
12756 |
3250 |
14415 |
|
n.v. |
n.v. |
0.15 |
-0.3 |
-0.32 |
|
enhancer of mRNA-decapping protein 4 |
| 10946942 |
|
Edf1 |
|
275 |
1672 |
10477 |
2202 |
257 |
|
0.73 |
0.21 |
0.07 |
0.24 |
-0.1 |
|
endothelial differentiation-related factor 1 |
| 50053824 |
|
Eea1 |
|
0 |
142 |
8871 |
0 |
10217 |
|
n.v. |
-0.22 |
-0.14 |
n.v. |
-0.29 |
|
early endosome antigen 1 |
| 6681273 |
|
Eef1a2 |
|
2233407 |
222652 |
339013 |
1310615 |
1540830 |
|
0.02 |
-0.02 |
-0.03 |
0.01 |
-0.07 |
|
elongation factor 1-alpha 2 |
| 31980922 |
|
Eef1b2 |
|
12741 |
8127 |
6813 |
146219 |
58463 |
|
0.13 |
0.1 |
0.05 |
0.04 |
-0.12 |
|
elongation factor 1-beta |
| 549806736 |
|
Eef1d |
|
106559 |
0 |
0 |
0 |
0 |
|
0.16 |
n.v. |
n.v. |
n.v. |
n.v. |
|
elongation factor 1-delta isoform d |
| 549806774 |
|
Eef1d |
|
107658 |
0 |
0 |
0 |
0 |
|
0.18 |
n.v. |
n.v. |
n.v. |
n.v. |
|
elongation factor 1-delta isoform c |
| 54287684 |
|
Eef1d |
|
118696 |
49708 |
42414 |
741162 |
210870 |
|
0.16 |
0.12 |
0 |
-0.01 |
-0.17 |
|
elongation factor 1-delta isoform b |
| 56699438 |
|
Eef1d |
|
118696 |
49708 |
42414 |
793402 |
210870 |
|
0.16 |
0.12 |
0 |
0 |
-0.17 |
|
elongation factor 1-delta isoform a |
| 13384756 |
|
Eef1e1 |
|
0 |
257 |
9 |
39946 |
0 |
|
n.v. |
-0.11 |
-0.07 |
0.03 |
n.v. |
|
eukaryotic translation elongation factor 1 epsilon-1 |
| 110625979 |
|
Eef1g |
|
210977 |
51359 |
83149 |
792674 |
161017 |
|
0.12 |
0.07 |
0.06 |
0.06 |
-0.14 |
|
elongation factor 1-gamma |
| 33859482 |
|
Eef2 |
|
835596 |
137361 |
400635 |
951072 |
1765237 |
|
0.03 |
0.18 |
0.03 |
0.12 |
0.01 |
|
elongation factor 2 |
| 6681275 |
|
Eef2k |
|
0 |
0 |
0 |
0 |
3823 |
|
n.v. |
n.v. |
n.v. |
n.v. |
0.19 |
|
eukaryotic elongation factor 2 kinase |
| 12746442 |
|
Eefsec |
|
0 |
1881 |
23859 |
33438 |
4959 |
|
n.v. |
0.3 |
0.06 |
0.14 |
0.05 |
|
selenocysteine-specific elongation factor |
| 13386360 |
|
Efhd1 |
|
0 |
286 |
186 |
0 |
2892 |
|
n.v. |
0.36 |
0.31 |
n.v. |
0.19 |
|
EF-hand domain-containing protein D1 |
| 31981086 |
|
Efhd2 |
|
0 |
2334 |
2300 |
508 |
66260 |
|
n.v. |
0.11 |
-0.13 |
0.61 |
0.02 |
|
EF-hand domain-containing protein D2 |
| 31542597 |
|
Efnb2 |
|
0 |
816 |
86 |
0 |
0 |
|
n.v. |
-0.19 |
-0.25 |
n.v. |
n.v. |
|
ephrin-B2 precursor |
| 54020730 |
|
Efr3a |
|
0 |
17 |
0 |
0 |
0 |
|
n.v. |
-0.14 |
n.v. |
n.v. |
n.v. |
|
protein EFR3 homolog A |
| 227908782 |
|
Eftud1 |
|
0 |
90 |
563 |
0 |
12102 |
|
n.v. |
0.33 |
-0.57 |
n.v. |
0.03 |
|
elongation factor Tu GTP-binding domain-containing
protein 1 |
| 158508674 |
|
Eftud2 |
|
108372 |
5317 |
29054 |
45577 |
227577 |
|
0 |
-0.21 |
0.01 |
-0.02 |
0.01 |
|
116 kDa U5 small nuclear ribonucleoprotein component
isoform b |
| 6755594 |
|
Eftud2 |
|
108372 |
5317 |
29054 |
45577 |
227577 |
|
0 |
-0.21 |
0.01 |
-0.02 |
0.01 |
|
116 kDa U5 small nuclear ribonucleoprotein component
isoform a |
| 46560582 |
|
Egfr |
|
2087 |
2436 |
13934 |
0 |
0 |
|
-0.11 |
0.08 |
-0.02 |
n.v. |
n.v. |
|
epidermal growth factor receptor isoform 1 precursor |
| 6681283 |
|
Egfr |
|
2087 |
981 |
6689 |
0 |
0 |
|
-0.11 |
0.03 |
-0.05 |
n.v. |
n.v. |
|
epidermal growth factor receptor isoform 2 precursor |
| 158303306 |
|
Egln1 |
|
0 |
67 |
181 |
0 |
2763 |
|
n.v. |
0 |
0.12 |
n.v. |
0.21 |
|
egl nine homolog 1 |
| 167736351 |
|
Ehbp1l1 |
|
0 |
0 |
0 |
0 |
0 |
|
n.v. |
n.v. |
-0.16 |
n.v. |
n.v. |
|
EH domain-binding protein 1-like protein 1 isoform a |
| 7106303 |
|
Ehd1 |
|
1117 |
12154 |
32887 |
132737 |
4005 |
|
0.33 |
0.08 |
-0.05 |
-0.04 |
0.04 |
|
EH domain-containing protein 1 |
| 55742711 |
|
Ehd2 |
|
0 |
0 |
0 |
2660 |
0 |
|
n.v. |
n.v. |
n.v. |
-0.03 |
n.v. |
|
EH domain-containing protein 2 |
| 215983062 |
|
Ehd3 |
|
0 |
4590 |
12466 |
52961 |
2720 |
|
n.v. |
0.08 |
-0.05 |
0 |
0.06 |
|
EH domain-containing protein 3 |
| 31981592 |
|
Ehd4 |
|
1025 |
20147 |
35742 |
188939 |
3813 |
|
2.23 |
0.17 |
-0.02 |
-0.02 |
0.3 |
|
EH domain-containing protein 4 |
| 31541815 |
|
Ehhadh |
|
0 |
106 |
22 |
0 |
0 |
|
n.v. |
-0.67 |
-0.01 |
n.v. |
n.v. |
|
peroxisomal bifunctional enzyme |
| 313747488 |
|
Ei24 |
|
0 |
658 |
78 |
0 |
0 |
|
n.v. |
-0.38 |
-0.39 |
n.v. |
n.v. |
|
etoposide-induced protein 2.4 |
| 22165347 |
|
Eif1 |
|
3881 |
2597 |
2855 |
5108 |
4048 |
|
0 |
0.12 |
0.12 |
0.13 |
-0.08 |
|
eukaryotic translation initiation factor 1 |
| 158631225 |
|
Eif1a |
|
2123 |
3163 |
22342 |
45495 |
8075 |
|
-0.13 |
0.21 |
0.12 |
0.02 |
-0.07 |
|
eukaryotic translation initiation factor 1A |
| 58037183 |
|
Eif1ad |
|
0 |
0 |
0 |
131 |
2378 |
|
n.v. |
n.v. |
n.v. |
0.08 |
0.25 |
|
probable RNA-binding protein EIF1AD |
| 31541824 |
|
Eif1ax |
|
2123 |
1776 |
19841 |
57119 |
6983 |
|
-0.13 |
0.23 |
0.13 |
-0.04 |
-0.07 |
|
eukaryotic translation initiation factor 1A,
X-chromosomal |
| 21312159 |
|
Eif1b |
|
3881 |
2597 |
2855 |
5108 |
4048 |
|
0 |
0.12 |
0.12 |
0.13 |
-0.08 |
|
eukaryotic translation initiation factor 1b |
| 54020676 |
|
Eif2a |
|
1172 |
5954 |
71135 |
157621 |
0 |
|
0.59 |
0.08 |
-0.01 |
0 |
n.v. |
|
eukaryotic translation initiation factor 2A |
| 6755160 |
|
Eif2ak2 |
|
0 |
367 |
9577 |
13334 |
3545 |
|
n.v. |
-0.2 |
0.06 |
-0.04 |
-0.23 |
|
interferon-induced, double-stranded RNA-activated protein
kinase |
| 166851838 |
|
Eif2ak4 |
|
0 |
0 |
228 |
0 |
0 |
|
n.v. |
n.v. |
0.03 |
n.v. |
n.v. |
|
eukaryotic translation initiation factor 2-alpha kinase 4
isoform 1 |
| 295317391 |
|
Eif2ak4 |
|
0 |
0 |
228 |
0 |
0 |
|
n.v. |
n.v. |
0.03 |
n.v. |
n.v. |
|
eukaryotic translation initiation factor 2-alpha kinase 4
isoform 2 |
| 21703744 |
|
Eif2b1 |
|
0 |
246 |
811 |
21585 |
3802 |
|
n.v. |
-0.04 |
-0.1 |
0.04 |
-0.4 |
|
translation initiation factor eIF-2B subunit alpha |
| 21703888 |
|
Eif2b2 |
|
0 |
0 |
6 |
33839 |
2335 |
|
n.v. |
n.v. |
-0.03 |
0.09 |
-0.2 |
|
translation initiation factor eIF-2B subunit beta |
| 110626005 |
|
Eif2b3 |
|
0 |
0 |
0 |
12933 |
0 |
|
n.v. |
n.v. |
n.v. |
0.15 |
n.v. |
|
eukaryotic translation initiation factor 2B, subunit 3
gamma isoform 2 |
| 162287102 |
|
Eif2b3 |
|
0 |
0 |
0 |
12933 |
0 |
|
n.v. |
n.v. |
n.v. |
0.15 |
n.v. |
|
eukaryotic translation initiation factor 2B, subunit 3
gamma isoform 1 |
| 188219551 |
|
Eif2b4 |
|
0 |
33 |
571 |
37752 |
782 |
|
n.v. |
-0.62 |
-1.19 |
0.06 |
0.05 |
|
translation initiation factor eIF-2B subunit delta
isoform 2 |
| 188219553 |
|
Eif2b4 |
|
0 |
33 |
571 |
37752 |
782 |
|
n.v. |
-0.62 |
-1.19 |
0.06 |
0.05 |
|
translation initiation factor eIF-2B subunit delta
isoform 1 |
| 26986557 |
|
Eif2b5 |
|
0 |
223 |
269 |
21299 |
0 |
|
n.v. |
0.23 |
0.51 |
0.09 |
n.v. |
|
translation initiation factor eIF-2B subunit epsilon |
| 209862947 |
|
Eif2d |
|
0 |
0 |
1412 |
33053 |
0 |
|
n.v. |
n.v. |
0.08 |
0.06 |
n.v. |
|
eukaryotic translation initiation factor 2D isoform
1 |
| 229577222 |
|
Eif2d |
|
0 |
0 |
1412 |
33053 |
0 |
|
n.v. |
n.v. |
0.08 |
0.06 |
n.v. |
|
eukaryotic translation initiation factor 2D isoform
2 |
| 13385624 |
|
Eif2s1 |
|
108829 |
19069 |
71608 |
302350 |
70479 |
|
0.07 |
0.09 |
0.07 |
-0.06 |
0.03 |
|
eukaryotic translation initiation factor 2 subunit 1 |
| 14149756 |
|
Eif2s2 |
|
4320 |
9500 |
50329 |
190282 |
15657 |
|
-0.33 |
0.14 |
0.07 |
0.05 |
-0.07 |
|
eukaryotic translation initiation factor 2 subunit 2 |
| 6753738 |
|
Eif2s3x |
|
14205 |
26566 |
123403 |
186041 |
21558 |
|
-0.02 |
0.28 |
0.09 |
0.03 |
0.09 |
|
eukaryotic translation initiation factor 2 subunit 3,
X-linked |
| 7242148 |
|
Eif2s3y |
|
14205 |
17800 |
74451 |
178674 |
16546 |
|
-0.02 |
0.29 |
0.12 |
0.01 |
0.09 |
|
eukaryotic translation initiation factor 2 subunit 3,
Y-linked |
| 146219837 |
|
Eif3a |
|
29235 |
2263 |
120737 |
680196 |
86 |
|
0.07 |
0.11 |
0.17 |
-0.05 |
-0.48 |
|
eukaryotic translation initiation factor 3 subunit A |
| 29789343 |
|
Eif3b |
|
15926 |
3357 |
127473 |
453767 |
11373 |
|
0.03 |
0.01 |
0.16 |
-0.06 |
-0.03 |
|
eukaryotic translation initiation factor 3 subunit B |
| 22203755 |
|
Eif3c |
|
20796 |
12650 |
136845 |
481139 |
4980 |
|
0.05 |
0.15 |
0.17 |
-0.04 |
-0.09 |
|
eukaryotic translation initiation factor 3 subunit C |
| 125628629 |
|
Eif3d |
|
1995 |
12625 |
40878 |
230817 |
0 |
|
0.34 |
0.26 |
0.21 |
-0.03 |
n.v. |
|
eukaryotic translation initiation factor 3 subunit D |
| 45476573 |
|
Eif3e |
|
6737 |
11723 |
88190 |
150991 |
225 |
|
-0.15 |
0.14 |
0.18 |
-0.06 |
-0.15 |
|
eukaryotic translation initiation factor 3 subunit E |
| 225637531 |
|
Eif3f |
|
11405 |
10878 |
72484 |
266023 |
7207 |
|
0.14 |
0.13 |
0.15 |
-0.04 |
-0.32 |
|
eukaryotic translation initiation factor 3 subunit F |
| 31980808 |
|
Eif3g |
|
35770 |
11481 |
30837 |
123537 |
1692 |
|
-0.07 |
0.17 |
0.16 |
-0.11 |
0.05 |
|
eukaryotic translation initiation factor 3 subunit G |
| 18079341 |
|
Eif3h |
|
13254 |
184 |
29280 |
256519 |
4637 |
|
-0.01 |
0.25 |
0.15 |
-0.06 |
-0.12 |
|
eukaryotic translation initiation factor 3 subunit H |
| 9055370 |
|
Eif3i |
|
8183 |
6926 |
50016 |
205147 |
4348 |
|
0.05 |
0.22 |
0.13 |
0.05 |
0.24 |
|
eukaryotic translation initiation factor 3 subunit I |
| 124244040 |
|
Eif3j1 |
|
0 |
1609 |
17618 |
93160 |
0 |
|
n.v. |
0.12 |
0.04 |
-0.02 |
n.v. |
|
eukaryotic translation initiation factor 3 subunit J |
| 365906249 |
|
Eif3j2 |
|
0 |
1609 |
17618 |
93160 |
0 |
|
n.v. |
0.12 |
0.04 |
-0.02 |
n.v. |
|
eukaryotic translation initiation factor 3 subunit
J-B |
| 552953694 |
|
Eif3k |
|
1446 |
0 |
0 |
0 |
0 |
|
0.16 |
n.v. |
n.v. |
n.v. |
n.v. |
|
eukaryotic translation initiation factor 3 subunit K
isoform 3 |
| 553727155 |
|
Eif3k |
|
1446 |
0 |
0 |
0 |
0 |
|
0.16 |
n.v. |
n.v. |
n.v. |
n.v. |
|
eukaryotic translation initiation factor 3 subunit K
isoform 2 |
| 21312044 |
|
Eif3k |
|
7597 |
8350 |
20754 |
56178 |
2420 |
|
0.04 |
0.24 |
0.17 |
0.04 |
0.03 |
|
eukaryotic translation initiation factor 3 subunit K |
| 51093840 |
|
Eif3l |
|
46992 |
17120 |
122843 |
310888 |
1821 |
|
0.1 |
0.09 |
0.13 |
-0.05 |
-0.08 |
|
eukaryotic translation initiation factor 3 subunit L |
| 21703762 |
|
Eif3m |
|
10050 |
589 |
29236 |
183578 |
7025 |
|
0.08 |
-0.39 |
0.17 |
-0.05 |
0.04 |
|
eukaryotic translation initiation factor 3 subunit M |
| 21450625 |
|
Eif4a1 |
|
406778 |
117318 |
286713 |
594878 |
678415 |
|
0.14 |
0.17 |
0.17 |
-0.01 |
0.03 |
|
eukaryotic initiation factor 4A-I isoform 1 |
| 226823309 |
|
Eif4a1 |
|
396929 |
111532 |
235153 |
495554 |
617981 |
|
0.13 |
0.15 |
0.15 |
-0.03 |
0 |
|
eukaryotic initiation factor 4A-I isoform 2 |
| 176865892 |
|
Eif4a2 |
|
381351 |
104781 |
150583 |
303013 |
368054 |
|
0.07 |
0.12 |
0.12 |
-0.01 |
-0.02 |
|
eukaryotic initiation factor 4A-II isoform a |
| 176865998 |
|
Eif4a2 |
|
181028 |
67155 |
90997 |
181056 |
256782 |
|
0.05 |
0.12 |
0.09 |
0.02 |
-0.06 |
|
eukaryotic initiation factor 4A-II isoform b |
| 176866061 |
|
Eif4a2 |
|
377708 |
99848 |
143776 |
288263 |
344782 |
|
0.07 |
0.1 |
0.09 |
-0.01 |
-0.01 |
|
eukaryotic initiation factor 4A-II isoform c |
| 20149756 |
|
Eif4a3 |
|
197375 |
38924 |
79117 |
74243 |
49649 |
|
0.02 |
0.22 |
0.16 |
-0.09 |
-0.02 |
|
eukaryotic initiation factor 4A-III |
| 167234372 |
|
Eif4b |
|
2984 |
647 |
6703 |
31302 |
79197 |
|
0.11 |
-0.08 |
-0.34 |
-0.13 |
-0.1 |
|
eukaryotic translation initiation factor 4B |
| 83627717 |
|
Eif4e |
|
6224 |
5286 |
15287 |
18557 |
59684 |
|
0.15 |
0.33 |
0.3 |
0.37 |
-0.09 |
|
eukaryotic translation initiation factor 4E |
| 85677506 |
|
Eif4e2 |
|
0 |
555 |
3947 |
8636 |
1596 |
|
n.v. |
0.46 |
0.13 |
0.08 |
-0.84 |
|
eukaryotic translation initiation factor 4E type 2
isoform 3 |
| 85677508 |
|
Eif4e2 |
|
0 |
578 |
3996 |
8439 |
1596 |
|
n.v. |
0.46 |
0.16 |
0.07 |
-0.84 |
|
eukaryotic translation initiation factor 4E type 2
isoform 2 |
| 85677510 |
|
Eif4e2 |
|
0 |
591 |
3996 |
8849 |
1596 |
|
n.v. |
0.49 |
0.16 |
0.1 |
-0.84 |
|
eukaryotic translation initiation factor 4E type 2
isoform 1 |
| 6753742 |
|
Eif4ebp2 |
|
0 |
0 |
0 |
0 |
5537 |
|
n.v. |
n.v. |
n.v. |
n.v. |
-0.06 |
|
eukaryotic translation initiation factor 4E-binding
protein 2 |
| 56699432 |
|
Eif4g1 |
|
92 |
5730 |
70608 |
134620 |
63593 |
|
0.02 |
0.25 |
0.38 |
0.21 |
-0.33 |
|
eukaryotic translation initiation factor 4 gamma 1
isoform a |
| 56699434 |
|
Eif4g1 |
|
92 |
5730 |
70608 |
134620 |
63593 |
|
0.02 |
0.25 |
0.38 |
0.21 |
-0.33 |
|
eukaryotic translation initiation factor 4 gamma 1
isoform b |
| 110630015 |
|
Eif4g2 |
|
1281 |
1785 |
28628 |
9872 |
3234 |
|
0.03 |
0.09 |
0.13 |
0.3 |
-0.32 |
|
eukaryotic translation initiation factor 4 gamma 2
isoform 2 |
| 34486094 |
|
Eif4g2 |
|
1281 |
1785 |
28644 |
10289 |
3234 |
|
0.03 |
0.09 |
0.13 |
0.29 |
-0.32 |
|
eukaryotic translation initiation factor 4 gamma 2
isoform 1 |
| 371875676 |
|
Eif4g3 |
|
0 |
505 |
12352 |
13015 |
5880 |
|
n.v. |
0.39 |
0.34 |
0.34 |
0.01 |
|
eukaryotic translation initiation factor 4 gamma 3
isoform 2 |
| 371876057 |
|
Eif4g3 |
|
0 |
505 |
12287 |
13015 |
5880 |
|
n.v. |
0.39 |
0.34 |
0.34 |
0.01 |
|
eukaryotic translation initiation factor 4 gamma 3
isoform 3 |
| 50838806 |
|
Eif4g3 |
|
0 |
505 |
12352 |
13015 |
5880 |
|
n.v. |
0.39 |
0.34 |
0.34 |
0.01 |
|
eukaryotic translation initiation factor 4 gamma 3
isoform 1 |
| 15808988 |
|
Eif4h |
|
110 |
612 |
2378 |
4682 |
56086 |
|
0.09 |
0.6 |
0.02 |
0.44 |
0.07 |
|
eukaryotic translation initiation factor 4H |
| 262359891 |
|
Eif5a |
|
34836 |
0 |
0 |
0 |
0 |
|
0.01 |
n.v. |
n.v. |
n.v. |
n.v. |
|
eukaryotic translation initiation factor 5A-1 |
| 262359891;31712036 |
|
Eif5a |
|
0 |
0 |
17324 |
0 |
0 |
|
n.v. |
n.v. |
0.02 |
n.v. |
n.v. |
|
eukaryotic translation initiation factor 5A-1 |
| 31712036;262359891 |
|
Eif5a |
|
0 |
11145 |
0 |
66360 |
193992 |
|
n.v. |
0.14 |
n.v. |
0.15 |
0.02 |
|
eukaryotic translation initiation factor 5A-1 |
| 29243942 |
|
Eif5a2 |
|
34836 |
7544 |
13357 |
59002 |
39432 |
|
0.01 |
0.13 |
0.02 |
0.13 |
0.03 |
|
eukaryotic translation initiation factor 5A-2 |
| 84043961 |
|
Eif5b |
|
513 |
10911 |
29362 |
94764 |
0 |
|
0.32 |
0.19 |
0.13 |
0.12 |
n.v. |
|
eukaryotic translation initiation factor 5B |
| 27501448 |
|
Eif6 |
|
6242 |
5544 |
4440 |
48753 |
51995 |
|
0.29 |
0.02 |
0.07 |
0.03 |
0.14 |
|
eukaryotic translation initiation factor 6 |
| 257153445 |
|
Elac2 |
|
0 |
140 |
40 |
295 |
2859 |
|
n.v. |
-0.42 |
-0.05 |
0.32 |
-0.03 |
|
zinc phosphodiesterase ELAC protein 2 |
| 31542602 |
|
Elavl1 |
|
340748 |
12517 |
26992 |
71837 |
0 |
|
-0.09 |
0.1 |
0.28 |
0.15 |
n.v. |
|
ELAV-like protein 1 |
| 124358953 |
|
Ell |
|
0 |
0 |
234 |
0 |
193 |
|
n.v. |
n.v. |
-0.46 |
n.v. |
0.22 |
|
RNA polymerase II elongation factor ELL |
| 46877043 |
|
Elmo2 |
|
0 |
0 |
0 |
4928 |
0 |
|
n.v. |
n.v. |
n.v. |
0.18 |
n.v. |
|
engulfment and cell motility protein 2 isoform 3 |
| 46877050 |
|
Elmo2 |
|
0 |
0 |
0 |
3332 |
0 |
|
n.v. |
n.v. |
n.v. |
0.24 |
n.v. |
|
engulfment and cell motility protein 2 isoform 1 |
| 46877052 |
|
Elmo2 |
|
0 |
0 |
0 |
4928 |
0 |
|
n.v. |
n.v. |
n.v. |
0.18 |
n.v. |
|
engulfment and cell motility protein 2 isoform 2 |
| 255683297 |
|
Elmo3 |
|
0 |
1165 |
1517 |
31416 |
1885 |
|
n.v. |
0.12 |
-0.11 |
0.18 |
-0.39 |
|
engulfment and cell motility protein 3 |
| 283436077 |
|
Elmod2 |
|
0 |
1163 |
57 |
0 |
0 |
|
n.v. |
-0.42 |
-0.21 |
n.v. |
n.v. |
|
ELMO domain-containing protein 2 |
| 25140989 |
|
Elof1 |
|
0 |
0 |
0 |
417 |
493 |
|
n.v. |
n.v. |
n.v. |
-0.35 |
0.05 |
|
transcription elongation factor 1 homolog |
| 85702351 |
|
Elovl1 |
|
0 |
580 |
19 |
0 |
0 |
|
n.v. |
-2.06 |
-0.36 |
n.v. |
n.v. |
|
elongation of very long chain fatty acids protein 1
isoform 2 |
| 9507145 |
|
Elovl1 |
|
0 |
580 |
19 |
0 |
0 |
|
n.v. |
-2.06 |
-0.36 |
n.v. |
n.v. |
|
elongation of very long chain fatty acids protein 1
isoform 1 |
| 148540000 |
|
Elovl7 |
|
0 |
543 |
0 |
0 |
0 |
|
n.v. |
-0.65 |
n.v. |
n.v. |
n.v. |
|
elongation of very long chain fatty acids protein 7 |
| 134032030 |
|
Elp2 |
|
0 |
0 |
0 |
14709 |
1092 |
|
n.v. |
n.v. |
n.v. |
0.02 |
0.38 |
|
elongator complex protein 2 |
| 33469023 |
|
Elp3 |
|
0 |
150 |
97 |
42418 |
0 |
|
n.v. |
-0.09 |
0.16 |
0.11 |
n.v. |
|
elongator complex protein 3 isoform 2 |
| 359465533 |
|
Elp3 |
|
0 |
150 |
97 |
42418 |
0 |
|
n.v. |
-0.09 |
0.16 |
0.11 |
n.v. |
|
elongator complex protein 3 isoform 1 |
| 31542608 |
|
Elp4 |
|
0 |
0 |
104 |
12802 |
3448 |
|
n.v. |
n.v. |
0.1 |
0.06 |
0.07 |
|
elongator complex protein 4 |
| 244790025 |
|
Elp5 |
|
0 |
0 |
98 |
12860 |
0 |
|
n.v. |
n.v. |
-0.36 |
0.04 |
n.v. |
|
elongator complex protein 5 isoform 1 |
| 358498583 |
|
Elp5 |
|
0 |
0 |
98 |
7727 |
0 |
|
n.v. |
n.v. |
-0.36 |
0.01 |
n.v. |
|
elongator complex protein 5 isoform 2 |
| 145587074 |
|
Elp6 |
|
0 |
0 |
40 |
9446 |
0 |
|
n.v. |
n.v. |
0.16 |
-0.05 |
n.v. |
|
elongator complex protein 6 |
| 31542273 |
|
Emc1 |
|
28631 |
157 |
5269 |
0 |
0 |
|
0.05 |
-0.6 |
-0.4 |
n.v. |
n.v. |
|
ER membrane protein complex subunit 1 isoform 1
precursor |
| 85861260 |
|
Emc1 |
|
28631 |
157 |
5315 |
0 |
0 |
|
0.05 |
-0.6 |
-0.4 |
n.v. |
n.v. |
|
ER membrane protein complex subunit 1 isoform 2
precursor |
| 13385196 |
|
Emc2 |
|
32090 |
10667 |
4918 |
679 |
0 |
|
0.16 |
-0.05 |
-0.2 |
0.25 |
n.v. |
|
ER membrane protein complex subunit 2 |
| 28827824 |
|
Emc3 |
|
8421 |
4701 |
956 |
0 |
0 |
|
0.31 |
-0.55 |
-0.29 |
n.v. |
n.v. |
|
ER membrane protein complex subunit 3 |
| 13386014 |
|
Emc4 |
|
5583 |
2983 |
1485 |
0 |
0 |
|
-0.18 |
-0.37 |
-0.37 |
n.v. |
n.v. |
|
ER membrane protein complex subunit 4 |
| 13384684 |
|
Emc6 |
|
4851 |
3052 |
1149 |
98 |
0 |
|
0.48 |
-0.31 |
-0.34 |
-0.98 |
n.v. |
|
ER membrane protein complex subunit 6 |
| 19526956 |
|
Emc7 |
|
439 |
735 |
922 |
0 |
0 |
|
0.41 |
-0.19 |
-0.32 |
n.v. |
n.v. |
|
ER membrane protein complex subunit 7 precursor |
| 6754870 |
|
Emc8 |
|
567 |
2937 |
2567 |
0 |
1810 |
|
-0.01 |
-0.27 |
-0.29 |
n.v. |
0.54 |
|
ER membrane protein complex subunit 8 |
| 6679641 |
|
Emd |
|
14132 |
1271 |
1256 |
0 |
0 |
|
0.41 |
-0.15 |
-0.32 |
n.v. |
n.v. |
|
emerin |
| 7305109 |
|
Emg1 |
|
0 |
0 |
123 |
90 |
0 |
|
n.v. |
n.v. |
0.03 |
0.12 |
n.v. |
|
ribosomal RNA small subunit methyltransferase NEP1 |
| 244790233 |
|
Eml2 |
|
0 |
5970 |
4636 |
8300 |
31614 |
|
n.v. |
0.16 |
0.06 |
0.23 |
0.04 |
|
echinoderm microtubule-associated protein-like 2 isoform
1 |
| 244790299 |
|
Eml2 |
|
0 |
6682 |
4636 |
8300 |
31775 |
|
n.v. |
0.16 |
0.06 |
0.23 |
0.04 |
|
echinoderm microtubule-associated protein-like 2 isoform
2 |
| 21450111 |
|
Eml3 |
|
0 |
0 |
0 |
8292 |
0 |
|
n.v. |
n.v. |
n.v. |
0.26 |
n.v. |
|
echinoderm microtubule-associated protein-like 3 |
| 167234433 |
|
Eml4 |
|
0 |
503 |
33034 |
104112 |
4037 |
|
n.v. |
0.21 |
0 |
-0.02 |
-0.31 |
|
echinoderm microtubule-associated protein-like 4 isoform
3 |
| 167234435 |
|
Eml4 |
|
0 |
509 |
35768 |
120655 |
4037 |
|
n.v. |
0.21 |
0.02 |
0.07 |
-0.31 |
|
echinoderm microtubule-associated protein-like 4 isoform
1 |
| 167234437 |
|
Eml4 |
|
0 |
503 |
33034 |
104112 |
4037 |
|
n.v. |
0.21 |
0 |
-0.02 |
-0.31 |
|
echinoderm microtubule-associated protein-like 4 isoform
2 |
| 133778926 |
|
Enah |
|
0 |
0 |
541 |
0 |
0 |
|
n.v. |
n.v. |
0.17 |
n.v. |
n.v. |
|
protein enabled homolog isoform 1 |
| 133778939 |
|
Enah |
|
0 |
0 |
541 |
0 |
0 |
|
n.v. |
n.v. |
0.17 |
n.v. |
n.v. |
|
protein enabled homolog isoform 2 |
| 133778997 |
|
Enah |
|
0 |
0 |
541 |
8 |
0 |
|
n.v. |
n.v. |
0.17 |
0.51 |
n.v. |
|
protein enabled homolog isoform 4 |
| 133779002 |
|
Enah |
|
0 |
0 |
541 |
8 |
0 |
|
n.v. |
n.v. |
0.17 |
0.51 |
n.v. |
|
protein enabled homolog isoform 3 |
| 160333729 |
|
Endod1 |
|
1556 |
1708 |
1157 |
0 |
0 |
|
0.44 |
-0.13 |
-0.1 |
n.v. |
n.v. |
|
endonuclease domain-containing 1 protein precursor |
| 27369816 |
|
Engase |
|
0 |
0 |
88 |
0 |
0 |
|
n.v. |
n.v. |
0.27 |
n.v. |
n.v. |
|
cytosolic endo-beta-N-acetylglucosaminidase |
| 158853992;70794816 |
|
Eno1 |
|
0 |
0 |
349748 |
0 |
0 |
|
n.v. |
n.v. |
0.01 |
n.v. |
n.v. |
|
alpha-enolase |
| 7305027 |
|
Eno2 |
|
116847 |
20846 |
4406 |
81103 |
97778 |
|
0.22 |
0.22 |
-0.23 |
0.41 |
-0.01 |
|
gamma-enolase |
| 6679651 |
|
Eno3 |
|
306003 |
0 |
0 |
0 |
0 |
|
0.11 |
n.v. |
n.v. |
n.v. |
n.v. |
|
beta-enolase |
| 6679651;209862931 |
|
Eno3 |
|
0 |
0 |
104962 |
0 |
0 |
|
n.v. |
n.v. |
-0.03 |
n.v. |
n.v. |
|
beta-enolase |
| 209862931;6679651 |
|
Eno3 |
|
0 |
38216 |
0 |
175654 |
514613 |
|
n.v. |
-0.06 |
n.v. |
0.02 |
-0.02 |
|
beta-enolase isoform 2 |
| 251823872 |
|
Enoph1 |
|
0 |
109 |
0 |
0 |
4734 |
|
n.v. |
0.04 |
n.v. |
n.v. |
0.47 |
|
enolase-phosphatase E1 |
| 84872231 |
|
Enpp4 |
|
0 |
401 |
59 |
0 |
0 |
|
n.v. |
-0.07 |
0.04 |
n.v. |
n.v. |
|
ectonucleotide pyrophosphatase/phosphodiesterase family
member 4 precursor |
| 14030779 |
|
Enpp5 |
|
6755 |
5298 |
38 |
0 |
182 |
|
-0.05 |
-0.15 |
-0.16 |
n.v. |
-0.3 |
|
ectonucleotide pyrophosphatase/phosphodiesterase family
member 5 precursor |
| 71892414 |
|
Enpp7 |
|
0 |
265 |
0 |
0 |
0 |
|
n.v. |
-0.25 |
n.v. |
n.v. |
n.v. |
|
ectonucleotide pyrophosphatase/phosphodiesterase family
member 7 precursor |
| 71061466 |
|
Ensa |
|
0 |
10 |
0 |
0 |
3406 |
|
n.v. |
0.37 |
n.v. |
n.v. |
-0.05 |
|
alpha-endosulfine isoform b |
| 9624979 |
|
Ensa |
|
0 |
10 |
0 |
0 |
3406 |
|
n.v. |
0.37 |
n.v. |
n.v. |
-0.05 |
|
alpha-endosulfine isoform a |
| 161484610 |
|
Entpd2 |
|
0 |
2144 |
2138 |
0 |
0 |
|
n.v. |
-0.23 |
-0.42 |
n.v. |
n.v. |
|
ectonucleoside triphosphate diphosphohydrolase 2
precursor |
| 71061460 |
|
Entpd5 |
|
0 |
378 |
0 |
0 |
257 |
|
n.v. |
-0.63 |
n.v. |
n.v. |
-1.84 |
|
ectonucleoside triphosphate diphosphohydrolase 5 isoform
a |
| 71061462 |
|
Entpd5 |
|
0 |
378 |
0 |
0 |
257 |
|
n.v. |
-0.63 |
n.v. |
n.v. |
-1.84 |
|
ectonucleoside triphosphate diphosphohydrolase 5 isoform
b precursor |
| 30023855 |
|
Eny2 |
|
0 |
0 |
32 |
0 |
0 |
|
n.v. |
n.v. |
0.06 |
n.v. |
n.v. |
|
enhancer of yellow 2 transcription factor homolog |
| 94421034 |
|
Ep300 |
|
0 |
31 |
89 |
1040 |
750 |
|
n.v. |
-0.01 |
0.01 |
-0.19 |
-0.09 |
|
histone acetyltransferase p300 |
| 190684669 |
|
Epb4.1 |
|
458 |
230 |
2463 |
0 |
0 |
|
0.61 |
0.2 |
-0.14 |
n.v. |
n.v. |
|
protein 4.1 isoform 1 |
| 190684673 |
|
Epb4.1 |
|
403 |
230 |
2268 |
0 |
0 |
|
0.54 |
0.2 |
-0.13 |
n.v. |
n.v. |
|
protein 4.1 isoform 3 |
| 190881478 |
|
Epb4.1 |
|
458 |
230 |
2463 |
0 |
0 |
|
0.61 |
0.2 |
-0.14 |
n.v. |
n.v. |
|
protein 4.1 isoform 2 |
| 54873604 |
|
Epb4.1l1 |
|
2105 |
1096 |
6125 |
0 |
22351 |
|
0.14 |
-0.35 |
-0.11 |
n.v. |
0.27 |
|
band 4.1-like protein 1 isoform b |
| 7305029 |
|
Epb4.1l1 |
|
2105 |
1096 |
5631 |
0 |
21494 |
|
0.14 |
-0.35 |
-0.09 |
n.v. |
0.24 |
|
band 4.1-like protein 1 isoform a |
| 312922373 |
|
Epb4.1l2 |
|
10196 |
3236 |
10353 |
0 |
889 |
|
-0.04 |
0.03 |
-0.15 |
n.v. |
0.17 |
|
band 4.1-like protein 2 |
| 7305031 |
|
Epb4.1l3 |
|
0 |
4 |
2114 |
115 |
0 |
|
n.v. |
-0.19 |
-0.07 |
0.29 |
n.v. |
|
band 4.1-like protein 3 |
| 87042272 |
|
Epb4.1l4a |
|
0 |
0 |
164 |
0 |
0 |
|
n.v. |
n.v. |
-0.06 |
n.v. |
n.v. |
|
band 4.1-like protein 4A |
| 169234799 |
|
Epb4.1l4b |
|
23633 |
7663 |
3404 |
5141 |
0 |
|
-0.16 |
0.06 |
-0.09 |
-0.5 |
n.v. |
|
band 4.1-like protein 4B |
| 164663872 |
|
Epb4.1l5 |
|
58158 |
18270 |
27073 |
16879 |
0 |
|
-0.01 |
-0.09 |
-0.02 |
-0.29 |
n.v. |
|
band 4.1-like protein 5 isoform 2 |
| 30841014 |
|
Epb4.1l5 |
|
58158 |
18270 |
25779 |
16879 |
0 |
|
-0.01 |
-0.09 |
-0.02 |
-0.29 |
n.v. |
|
band 4.1-like protein 5 isoform 1 |
| 112293275 |
|
Epcam |
|
146851 |
10325 |
23334 |
13334 |
0 |
|
0.12 |
0.1 |
0.09 |
-0.24 |
n.v. |
|
epithelial cell adhesion molecule precursor |
| 282165729 |
|
Epdr1 |
|
0 |
326 |
0 |
0 |
0 |
|
n.v. |
0.86 |
n.v. |
n.v. |
n.v. |
|
mammalian ependymin-related protein 1 precursor |
| 32484983 |
|
Epha2 |
|
0 |
315 |
530 |
0 |
0 |
|
n.v. |
0.17 |
-0.06 |
n.v. |
n.v. |
|
ephrin type-A receptor 2 precursor |
| 34328113 |
|
Epha4 |
|
0 |
315 |
471 |
0 |
0 |
|
n.v. |
0.17 |
-0.24 |
n.v. |
n.v. |
|
ephrin type-A receptor 4 precursor |
| 145312274 |
|
Epha6 |
|
0 |
315 |
471 |
0 |
0 |
|
n.v. |
0.17 |
-0.24 |
n.v. |
n.v. |
|
ephrin type-A receptor 6 |
| 171541811 |
|
Epha7 |
|
0 |
315 |
471 |
0 |
0 |
|
n.v. |
0.17 |
-0.24 |
n.v. |
n.v. |
|
ephrin type-A receptor 7 isoform 1 precursor |
| 269973846 |
|
Ephb1 |
|
0 |
315 |
508 |
0 |
0 |
|
n.v. |
0.17 |
-0.11 |
n.v. |
n.v. |
|
ephrin type-B receptor 1 isoform 1 precursor |
| 269973848 |
|
Ephb1 |
|
0 |
315 |
471 |
0 |
0 |
|
n.v. |
0.17 |
-0.24 |
n.v. |
n.v. |
|
ephrin type-B receptor 1 isoform 2 precursor |
| 47777351 |
|
Ephb2 |
|
0 |
1428 |
1397 |
0 |
0 |
|
n.v. |
-1.65 |
-0.12 |
n.v. |
n.v. |
|
ephrin type-B receptor 2 precursor |
| 33859548 |
|
Ephb3 |
|
0 |
315 |
531 |
0 |
0 |
|
n.v. |
0.17 |
-0.13 |
n.v. |
n.v. |
|
ephrin type-B receptor 3 precursor |
| 227330573 |
|
Ephb4 |
|
0 |
315 |
618 |
0 |
0 |
|
n.v. |
0.17 |
-0.06 |
n.v. |
n.v. |
|
ephrin type-B receptor 4 isoform b precursor |
| 227330575 |
|
Ephb4 |
|
0 |
315 |
618 |
0 |
0 |
|
n.v. |
0.17 |
-0.06 |
n.v. |
n.v. |
|
ephrin type-B receptor 4 isoform a precursor |
| 226437667 |
|
Ephb6 |
|
0 |
0 |
0 |
0 |
107 |
|
n.v. |
n.v. |
n.v. |
n.v. |
-0.29 |
|
ephrin type-B receptor 6 precursor |
| 6753762 |
|
Ephx1 |
|
23468 |
26706 |
16989 |
0 |
0 |
|
0.17 |
-0.13 |
-0.23 |
n.v. |
n.v. |
|
epoxide hydrolase 1 precursor |
| 30424918 |
|
Epm2aip1 |
|
0 |
142 |
0 |
6679 |
2677 |
|
n.v. |
0.59 |
n.v. |
0.25 |
0.22 |
|
EPM2A-interacting protein 1 |
| 356995862;46195711 |
|
Epn1 |
|
0 |
0 |
792 |
0 |
0 |
|
n.v. |
n.v. |
0.31 |
n.v. |
n.v. |
|
epsin-1 |
| 46195711 |
|
Epn1 |
|
0 |
0 |
0 |
0 |
1328 |
|
n.v. |
n.v. |
n.v. |
n.v. |
0.05 |
|
epsin-1 |
| 33468893 |
|
Epn2 |
|
0 |
0 |
0 |
0 |
1028 |
|
n.v. |
n.v. |
n.v. |
n.v. |
-0.33 |
|
epsin-2 isoform 2 |
| 356582234 |
|
Epn2 |
|
0 |
0 |
0 |
0 |
878 |
|
n.v. |
n.v. |
n.v. |
n.v. |
0.1 |
|
epsin-2 isoform 1 |
| 356582238 |
|
Epn2 |
|
0 |
0 |
0 |
0 |
878 |
|
n.v. |
n.v. |
n.v. |
n.v. |
0.1 |
|
epsin-2 isoform 3 |
| 30794400 |
|
Epn3 |
|
0 |
0 |
1397 |
0 |
3459 |
|
n.v. |
n.v. |
0.43 |
n.v. |
0.11 |
|
epsin-3 |
| 37537522 |
|
Eppk1 |
|
33445 |
1294 |
729 |
21880 |
514 |
|
0.21 |
0.4 |
0.23 |
0.57 |
1.01 |
|
epiplakin |
| 82617575 |
|
Eprs |
|
2673 |
806 |
20849 |
1164184 |
27952 |
|
0.21 |
0.15 |
0.06 |
0.04 |
0.03 |
|
bifunctional glutamate/proline--tRNA ligase |
| 229577163 |
|
Eps15 |
|
0 |
58 |
69 |
0 |
19299 |
|
n.v. |
0.55 |
0.16 |
n.v. |
-0.17 |
|
epidermal growth factor receptor substrate 15 isoform B |
| 6679671 |
|
Eps15 |
|
0 |
255 |
69 |
0 |
20348 |
|
n.v. |
0.55 |
0.16 |
n.v. |
-0.14 |
|
epidermal growth factor receptor substrate 15 isoform A |
| 170784834 |
|
Eps15l1 |
|
0 |
192 |
451 |
0 |
15122 |
|
n.v. |
0.4 |
-0.12 |
n.v. |
-0.26 |
|
epidermal growth factor receptor substrate 15-like 1
isoform a |
| 170784836 |
|
Eps15l1 |
|
0 |
192 |
451 |
0 |
12659 |
|
n.v. |
0.4 |
-0.12 |
n.v. |
-0.28 |
|
epidermal growth factor receptor substrate 15-like 1
isoform b |
| 18874094 |
|
Eps8l1 |
|
0 |
1616 |
23835 |
1858 |
43181 |
|
n.v. |
-0.06 |
-0.22 |
-0.92 |
-0.28 |
|
epidermal growth factor receptor kinase substrate 8-like
protein 1 |
| 21040233 |
|
Eps8l2 |
|
2984 |
12051 |
39428 |
8349 |
42388 |
|
0.32 |
0.15 |
-0.32 |
0.08 |
0.19 |
|
epidermal growth factor receptor kinase substrate 8-like
protein 2 |
| 19527082 |
|
Eps8l3 |
|
0 |
48 |
0 |
0 |
0 |
|
n.v. |
0.03 |
n.v. |
n.v. |
n.v. |
|
epidermal growth factor receptor kinase substrate 8-like
protein 3 |
| 165377197 |
|
Eral1 |
|
659 |
1668 |
0 |
0 |
0 |
|
-0.38 |
-0.08 |
n.v. |
n.v. |
n.v. |
|
GTPase Era, mitochondrial |
| 13507656 |
|
Erap1 |
|
458 |
1956 |
1438 |
0 |
910 |
|
0.49 |
-0.35 |
-0.4 |
n.v. |
-0.78 |
|
endoplasmic reticulum aminopeptidase 1 |
| 54873610 |
|
Erbb2 |
|
0 |
2914 |
13821 |
0 |
0 |
|
n.v. |
0.06 |
0.05 |
n.v. |
n.v. |
|
receptor tyrosine-protein kinase erbB-2 precursor |
| 54607112 |
|
Erbb2ip |
|
92 |
0 |
312 |
0 |
0 |
|
0.25 |
n.v. |
-0.27 |
n.v. |
n.v. |
|
protein LAP2 isoform 2 |
| 54607114 |
|
Erbb2ip |
|
92 |
0 |
312 |
0 |
0 |
|
0.25 |
n.v. |
-0.27 |
n.v. |
n.v. |
|
protein LAP2 isoform 1 |
| 146134398 |
|
Erbb4 |
|
0 |
1455 |
7087 |
0 |
0 |
|
n.v. |
0.23 |
0.2 |
n.v. |
n.v. |
|
receptor tyrosine-protein kinase erbB-4 precursor |
| 120300971 |
|
Erc1 |
|
0 |
822 |
4002 |
0 |
20809 |
|
n.v. |
0.51 |
0.29 |
n.v. |
-0.8 |
|
ELKS/Rab6-interacting/CAST family member 1 isoform 1 |
| 30017397 |
|
Erc1 |
|
0 |
440 |
1316 |
0 |
7390 |
|
n.v. |
0.51 |
0.32 |
n.v. |
-0.62 |
|
ELKS/Rab6-interacting/CAST family member 1 isoform 2 |
| 37360977 |
|
Erc2 |
|
0 |
317 |
1536 |
0 |
2335 |
|
n.v. |
0.18 |
0.13 |
n.v. |
-1.72 |
|
ERC protein 2 |
| 31542614 |
|
Ercc2 |
|
0 |
0 |
0 |
737 |
0 |
|
n.v. |
n.v. |
n.v. |
-0.27 |
n.v. |
|
TFIIH basal transcription factor complex helicase XPD
subunit |
| 241666402 |
|
Ercc4 |
|
0 |
0 |
89 |
0 |
0 |
|
n.v. |
n.v. |
-0.16 |
n.v. |
n.v. |
|
DNA repair endonuclease XPF |
| 27414501 |
|
Ercc6l |
|
0 |
0 |
0 |
0 |
439 |
|
n.v. |
n.v. |
n.v. |
n.v. |
0.2 |
|
DNA excision repair protein ERCC-6-like |
| 13385678 |
|
Ergic1 |
|
9245 |
4632 |
4962 |
4363 |
0 |
|
0 |
-0.05 |
0.02 |
0.26 |
n.v. |
|
endoplasmic reticulum-Golgi intermediate compartment
protein 1 |
| 21312962 |
|
Ergic2 |
|
0 |
1797 |
300 |
0 |
0 |
|
n.v. |
-0.25 |
-0.4 |
n.v. |
n.v. |
|
endoplasmic reticulum-Golgi intermediate compartment
protein 2 isoform 1 |
| 66773206 |
|
Ergic2 |
|
0 |
1797 |
300 |
0 |
0 |
|
n.v. |
-0.25 |
-0.4 |
n.v. |
n.v. |
|
endoplasmic reticulum-Golgi intermediate compartment
protein 2 isoform 2 |
| 13384938 |
|
Ergic3 |
|
0 |
2338 |
1743 |
0 |
0 |
|
n.v. |
-0.2 |
-0.17 |
n.v. |
n.v. |
|
endoplasmic reticulum-Golgi intermediate compartment
protein 3 |
| 6679685 |
|
Erh |
|
33610 |
503 |
5228 |
0 |
3020 |
|
-0.01 |
-0.08 |
0.02 |
n.v. |
-0.16 |
|
enhancer of rudimentary homolog |
| 165905605 |
|
Eri1 |
|
0 |
0 |
4558 |
7915 |
0 |
|
n.v. |
n.v. |
0.04 |
-0.12 |
n.v. |
|
3'-5' exoribonuclease 1 |
| 114205437 |
|
Erlec1 |
|
0 |
8 |
160 |
0 |
0 |
|
n.v. |
0.02 |
-0.99 |
n.v. |
n.v. |
|
endoplasmic reticulum lectin 1 precursor |
| 256355015;256355012 |
|
Erlin1 |
|
49152 |
11047 |
13395 |
2382 |
0 |
|
-0.04 |
-0.29 |
-0.41 |
-0.25 |
n.v. |
|
erlin-1 |
| 23956396 |
|
Erlin2 |
|
108683 |
29647 |
24426 |
2382 |
0 |
|
-0.04 |
-0.24 |
-0.36 |
-0.25 |
n.v. |
|
erlin-2 |
| 124487057 |
|
Ermp1 |
|
68886 |
17794 |
23488 |
0 |
0 |
|
-0.01 |
-0.27 |
-0.54 |
n.v. |
n.v. |
|
endoplasmic reticulum metallopeptidase 1 |
| 7657067 |
|
Ero1l |
|
13162 |
3572 |
7331 |
0 |
16011 |
|
-0.12 |
-0.63 |
-0.39 |
n.v. |
-0.52 |
|
ERO1-like protein alpha precursor |
| 38348230 |
|
Ero1lb |
|
0 |
0 |
1175 |
0 |
1424 |
|
n.v. |
n.v. |
-0.47 |
n.v. |
-0.51 |
|
ERO1-like protein beta precursor |
| 19526463 |
|
Erp29 |
|
39358 |
13323 |
4697 |
139 |
39861 |
|
0 |
-0.16 |
-0.24 |
-0.53 |
-0.34 |
|
endoplasmic reticulum resident protein 29 precursor |
| 19072792 |
|
Erp44 |
|
6224 |
10079 |
6722 |
0 |
6629 |
|
-0.1 |
-0.15 |
-0.1 |
n.v. |
-0.27 |
|
endoplasmic reticulum resident protein 44 precursor |
| 550544230 |
|
Esd |
|
2801 |
0 |
0 |
0 |
0 |
|
0.19 |
n.v. |
n.v. |
n.v. |
n.v. |
|
S-formylglutathione hydrolase isoform 1 |
| 13937355 |
|
Esd |
|
5565 |
2941 |
8433 |
8906 |
122613 |
|
0.2 |
0.15 |
0.02 |
0.15 |
0.1 |
|
S-formylglutathione hydrolase |
| 165972311 |
|
Esrp1 |
|
0 |
1935 |
4372 |
1424 |
3106 |
|
n.v. |
0.17 |
0.18 |
0.21 |
0.36 |
|
epithelial splicing regulatory protein 1 |
| 28849887 |
|
Esrp2 |
|
0 |
0 |
2589 |
1318 |
13987 |
|
n.v. |
n.v. |
0.06 |
-0.35 |
-0.02 |
|
epithelial splicing regulatory protein 2 |
| 112293262 |
|
Esrra |
|
16091 |
488 |
45 |
614 |
0 |
|
0.01 |
-0.01 |
-0.14 |
-0.03 |
n.v. |
|
steroid hormone receptor ERR1 |
| 226958365 |
|
Esrrb |
|
18086 |
488 |
133 |
614 |
2174 |
|
0.01 |
-0.01 |
-0.14 |
-0.03 |
-0.44 |
|
steroid hormone receptor ERR2 isoform 1 |
| 226958367 |
|
Esrrb |
|
18086 |
488 |
133 |
614 |
2174 |
|
0.01 |
-0.01 |
-0.14 |
-0.03 |
-0.44 |
|
steroid hormone receptor ERR2 isoform 2 |
| 344925886 |
|
Esrrg |
|
0 |
0 |
35 |
0 |
0 |
|
n.v. |
n.v. |
-0.76 |
n.v. |
n.v. |
|
estrogen-related receptor gamma isoform 2 |
| 6753774 |
|
Esrrg |
|
0 |
0 |
35 |
0 |
0 |
|
n.v. |
n.v. |
-0.76 |
n.v. |
n.v. |
|
estrogen-related receptor gamma isoform1 |
| 33859650 |
|
Esyt1 |
|
41518 |
2321 |
10362 |
1989 |
0 |
|
0.02 |
-0.22 |
-0.25 |
-0.39 |
n.v. |
|
extended synaptotagmin-1 |
| 67782360 |
|
Esyt2 |
|
14132 |
3060 |
4688 |
0 |
0 |
|
0.13 |
-0.1 |
-0.23 |
n.v. |
n.v. |
|
extended synaptotagmin-2 |
| 124286826 |
|
Etf1 |
|
2746 |
8542 |
24569 |
45274 |
61805 |
|
-0.61 |
0.15 |
0.06 |
0.09 |
0.04 |
|
eukaryotic peptide chain release factor subunit 1 |
| 227500281 |
|
Etfa |
|
532614 |
57361 |
3644 |
377 |
18945 |
|
-0.03 |
-0.17 |
-0.37 |
-0.7 |
-0.22 |
|
electron transfer flavoprotein subunit alpha,
mitochondrial |
| 38142460 |
|
Etfb |
|
414357 |
84870 |
594 |
0 |
25971 |
|
-0.09 |
-0.13 |
-0.57 |
n.v. |
-0.19 |
|
electron transfer flavoprotein subunit beta |
| 254588014 |
|
Etfdh |
|
18837 |
10886 |
1408 |
0 |
0 |
|
-0.04 |
-0.13 |
-0.35 |
n.v. |
n.v. |
|
electron transfer flavoprotein-ubiquinone oxidoreductase,
mitochondrial precursor |
| 12963539 |
|
Ethe1 |
|
6828 |
5699 |
0 |
0 |
825 |
|
-0.09 |
-0.22 |
n.v. |
n.v. |
-0.53 |
|
persulfide dioxygenase ETHE1, mitochondrial
precursor |
| 226371696 |
|
Etnk1 |
|
0 |
0 |
0 |
0 |
1756 |
|
n.v. |
n.v. |
n.v. |
n.v. |
0.25 |
|
ethanolamine kinase 1 |
| 84370337 |
|
Etv6 |
|
0 |
0 |
0 |
0 |
118 |
|
n.v. |
n.v. |
n.v. |
n.v. |
-0.34 |
|
transcription factor ETV6 |
| 254281243 |
|
Evl |
|
0 |
0 |
4 |
0 |
0 |
|
n.v. |
n.v. |
-0.46 |
n.v. |
n.v. |
|
ena/VASP-like protein isoform 1 |
| 254281245 |
|
Evl |
|
0 |
0 |
4 |
0 |
0 |
|
n.v. |
n.v. |
-0.46 |
n.v. |
n.v. |
|
ena/VASP-like protein isoform 2 |
| 254281247 |
|
Evl |
|
0 |
0 |
4 |
0 |
0 |
|
n.v. |
n.v. |
-0.46 |
n.v. |
n.v. |
|
ena/VASP-like protein isoform 3 |
| 254281249 |
|
Evl |
|
0 |
0 |
4 |
0 |
0 |
|
n.v. |
n.v. |
-0.46 |
n.v. |
n.v. |
|
ena/VASP-like protein isoform 4 |
| 111185907 |
|
Evpl |
|
1098 |
238 |
4792 |
0 |
161 |
|
0.55 |
0.5 |
0.52 |
n.v. |
0.66 |
|
envoplakin |
| 545687694 |
|
Ewsr1 |
|
10068 |
0 |
0 |
0 |
0 |
|
0 |
n.v. |
n.v. |
n.v. |
n.v. |
|
RNA-binding protein EWS isoform 1 |
| 545688864 |
|
Ewsr1 |
|
10068 |
0 |
0 |
0 |
0 |
|
0 |
n.v. |
n.v. |
n.v. |
n.v. |
|
RNA-binding protein EWS isoform 3 |
| 88853581 |
|
Ewsr1 |
|
14443 |
1943 |
19566 |
13081 |
5676 |
|
0.03 |
0.02 |
-0.12 |
-0.28 |
-0.42 |
|
RNA-binding protein EWS |
| 237681098 |
|
Exd2 |
|
0 |
44 |
0 |
0 |
0 |
|
n.v. |
0.11 |
n.v. |
n.v. |
n.v. |
|
exonuclease 3'-5' domain-containing protein 2 |
| 89111939 |
|
Exoc1 |
|
0 |
134 |
148 |
65 |
439 |
|
n.v. |
0.76 |
-0.07 |
0.96 |
0.81 |
|
exocyst complex component 1 |
| 21313438 |
|
Exoc2 |
|
0 |
129 |
138 |
10027 |
835 |
|
n.v. |
0.07 |
-0.11 |
0.14 |
-0.63 |
|
exocyst complex component 2 |
| 84579825 |
|
Exoc3 |
|
0 |
0 |
407 |
4617 |
0 |
|
n.v. |
n.v. |
0.43 |
-1.01 |
n.v. |
|
exocyst complex component 3 |
| 309265796 |
|
Exoc3l2 |
|
0 |
405 |
414 |
0 |
0 |
|
n.v. |
0.13 |
-0.14 |
n.v. |
n.v. |
|
PREDICTED: exocyst complex component 3-like 2 |
| 83921574 |
|
Exoc4 |
|
0 |
0 |
1910 |
10928 |
3823 |
|
n.v. |
n.v. |
0.32 |
-0.11 |
0.28 |
|
exocyst complex component 4 |
| 46402177 |
|
Exoc5 |
|
0 |
0 |
904 |
6688 |
0 |
|
n.v. |
n.v. |
0.19 |
-0.36 |
n.v. |
|
exocyst complex component 5 |
| 62526126 |
|
Exoc6 |
|
8897 |
474 |
2388 |
5263 |
5483 |
|
0.07 |
0.54 |
0.04 |
0.19 |
0.14 |
|
exocyst complex component 6 |
| 226371698 |
|
Exoc6b |
|
0 |
470 |
225 |
0 |
0 |
|
n.v. |
-0.68 |
0.15 |
n.v. |
n.v. |
|
exocyst complex component 6B |
| 247269408 |
|
Exoc7 |
|
0 |
61 |
51 |
7482 |
0 |
|
n.v. |
-0.05 |
0.01 |
0.1 |
n.v. |
|
exocyst complex component 7 isoform 1 |
| 247269443 |
|
Exoc7 |
|
0 |
61 |
51 |
7482 |
0 |
|
n.v. |
-0.05 |
0.01 |
0.1 |
n.v. |
|
exocyst complex component 7 isoform 2 |
| 37674218 |
|
Exoc8 |
|
0 |
430 |
464 |
9127 |
2195 |
|
n.v. |
0.24 |
-0.13 |
0.14 |
-0.03 |
|
exocyst complex component 8 |
| 27369613 |
|
Exog |
|
0 |
0 |
67 |
0 |
0 |
|
n.v. |
n.v. |
-0.37 |
n.v. |
n.v. |
|
nuclease EXOG, mitochondrial isoform 2 precursor |
| 287327708 |
|
Exog |
|
0 |
0 |
67 |
0 |
0 |
|
n.v. |
n.v. |
-0.37 |
n.v. |
n.v. |
|
nuclease EXOG, mitochondrial isoform 1 precursor |
| 22267446 |
|
Exosc1 |
|
0 |
729 |
1834 |
18409 |
1692 |
|
n.v. |
0.09 |
0.09 |
-0.01 |
-0.1 |
|
exosome complex component CSL4 isoform 1 |
| 257096005 |
|
Exosc1 |
|
0 |
729 |
1715 |
15798 |
1692 |
|
n.v. |
0.09 |
0.1 |
0.01 |
-0.1 |
|
exosome complex component CSL4 isoform 2 |
| 227116266 |
|
Exosc10 |
|
0 |
0 |
359 |
13580 |
0 |
|
n.v. |
n.v. |
-0.04 |
0.12 |
n.v. |
|
exosome component 10 |
| 21450259 |
|
Exosc2 |
|
0 |
409 |
918 |
38186 |
0 |
|
n.v. |
0.19 |
-0.22 |
0.04 |
n.v. |
|
exosome complex component RRP4 |
| 39930417 |
|
Exosc3 |
|
0 |
0 |
307 |
22412 |
11 |
|
n.v. |
n.v. |
0.01 |
-0.03 |
0.62 |
|
exosome complex component RRP40 |
| 29611663 |
|
Exosc4 |
|
0 |
0 |
438 |
7654 |
0 |
|
n.v. |
n.v. |
0 |
-0.16 |
n.v. |
|
exosome complex component RRP41 |
| 20070392 |
|
Exosc5 |
|
0 |
44 |
170 |
10093 |
0 |
|
n.v. |
0.64 |
0.18 |
0.14 |
n.v. |
|
exosome complex component RRP46 |
| 30794378 |
|
Exosc6 |
|
1721 |
522 |
1835 |
34027 |
4070 |
|
-0.06 |
-0.01 |
-0.16 |
-0.1 |
-0.21 |
|
exosome complex component MTR3 |
| 124487127 |
|
Exosc7 |
|
0 |
1503 |
2114 |
24557 |
0 |
|
n.v. |
-0.16 |
-0.18 |
-0.06 |
n.v. |
|
exosome complex exonuclease RRP42 |
| 254675240 |
|
Exosc8 |
|
0 |
104 |
1949 |
18884 |
2410 |
|
n.v. |
0.01 |
0.12 |
0.01 |
-0.13 |
|
exosome complex component RRP43 isoform 1 |
| 254692991 |
|
Exosc8 |
|
0 |
104 |
2240 |
20971 |
2410 |
|
n.v. |
0.01 |
0.12 |
0.01 |
-0.13 |
|
exosome complex component RRP43 isoform 2 |
| 9506981 |
|
Exosc9 |
|
0 |
1436 |
4928 |
80988 |
278 |
|
n.v. |
-0.31 |
-0.06 |
0.06 |
0.38 |
|
exosome complex component RRP45 |
| 254553481 |
|
Extl2 |
|
0 |
6 |
0 |
0 |
0 |
|
n.v. |
-0.15 |
n.v. |
n.v. |
n.v. |
|
exostosin-like 2 isoform a |
| 254553485 |
|
Extl2 |
|
0 |
6 |
0 |
0 |
0 |
|
n.v. |
-0.15 |
n.v. |
n.v. |
n.v. |
|
exostosin-like 2 isoform b precursor |
| 46877074 |
|
Eya3 |
|
0 |
0 |
0 |
0 |
129 |
|
n.v. |
n.v. |
n.v. |
n.v. |
0.1 |
|
eyes absent homolog 3 isoform 2 |
| 46877076 |
|
Eya3 |
|
0 |
0 |
0 |
0 |
129 |
|
n.v. |
n.v. |
n.v. |
n.v. |
0.1 |
|
eyes absent homolog 3 isoform 1 |
| 46877080 |
|
Eya3 |
|
0 |
0 |
0 |
0 |
129 |
|
n.v. |
n.v. |
n.v. |
n.v. |
0.1 |
|
eyes absent homolog 3 isoform 3 |
| 83921618 |
|
Ezr |
|
1191978 |
133282 |
400380 |
185951 |
248557 |
|
0.11 |
0.02 |
-0.24 |
-0.01 |
0.04 |
|
ezrin |
| 27734847 |
|
F11r |
|
49609 |
17118 |
27266 |
729 |
4509 |
|
0.05 |
-0.09 |
-0.13 |
-0.56 |
-0.81 |
|
junctional adhesion molecule A precursor |
| 6753798 |
|
F2 |
|
0 |
0 |
0 |
974 |
0 |
|
n.v. |
n.v. |
n.v. |
-0.34 |
n.v. |
|
prothrombin precursor |
| 170172540 |
|
F3 |
|
13290 |
19921 |
19145 |
0 |
0 |
|
-0.58 |
-0.29 |
-0.41 |
n.v. |
n.v. |
|
tissue factor precursor |
| 83921576 |
|
F8a |
|
0 |
0 |
9 |
1252 |
0 |
|
n.v. |
n.v. |
0.19 |
0.29 |
n.v. |
|
factor VIII intron 22 protein |
| 226443015 |
|
Faah |
|
1940 |
2133 |
1014 |
0 |
0 |
|
-0.05 |
-0.18 |
-0.22 |
0.54 |
n.v. |
|
fatty-acid amide hydrolase 1 |
| 22164784 |
|
Fads1 |
|
1831 |
8060 |
5921 |
0 |
0 |
|
-0.28 |
-0.15 |
-0.25 |
n.v. |
n.v. |
|
fatty acid desaturase 1 |
| 9790071 |
|
Fads2 |
|
3606 |
10914 |
5407 |
0 |
0 |
|
0.01 |
-0.22 |
-0.34 |
n.v. |
n.v. |
|
fatty acid desaturase 2 |
| 40789280 |
|
Faf1 |
|
0 |
572 |
426 |
1670 |
13944 |
|
n.v. |
0.23 |
-0.06 |
0.23 |
-0.04 |
|
FAS-associated factor 1 |
| 158533976 |
|
Faf2 |
|
11990 |
12502 |
3254 |
0 |
0 |
|
-0.12 |
-0.15 |
-0.33 |
n.v. |
n.v. |
|
FAS-associated factor 2 |
| 240120112 |
|
Fah |
|
0 |
0 |
0 |
0 |
5548 |
|
n.v. |
n.v. |
n.v. |
n.v. |
-0.48 |
|
fumarylacetoacetase |
| 12963697 |
|
Fahd1 |
|
659 |
2267 |
0 |
0 |
5483 |
|
0.25 |
0.1 |
n.v. |
n.v. |
-0.02 |
|
acylpyruvase FAHD1, mitochondrial |
| 29366814 |
|
Fahd2a |
|
1300 |
3142 |
0 |
0 |
0 |
|
0.29 |
-0.01 |
n.v. |
n.v. |
n.v. |
|
fumarylacetoacetate hydrolase domain-containing protein
2A |
| 171184428 |
|
Faim |
|
0 |
0 |
19 |
442 |
1510 |
|
n.v. |
n.v. |
-0.67 |
0 |
-0.04 |
|
fas apoptotic inhibitory molecule 1 Faim-S |
| 171184430 |
|
Faim |
|
0 |
0 |
19 |
442 |
1510 |
|
n.v. |
n.v. |
-0.67 |
0 |
-0.04 |
|
fas apoptotic inhibitory molecule 1 Faim-L |
| 254675227 |
|
Fam102b |
|
0 |
0 |
0 |
0 |
482 |
|
n.v. |
n.v. |
n.v. |
n.v. |
0 |
|
protein FAM102B |
| 149588667 |
|
Fam104a |
|
0 |
15 |
0 |
57 |
0 |
|
n.v. |
-0.05 |
n.v. |
-0.21 |
n.v. |
|
uncharacterized protein LOC28081 |
| 13385088 |
|
Fam107b |
|
0 |
0 |
0 |
0 |
20894 |
|
n.v. |
n.v. |
n.v. |
n.v. |
0 |
|
protein FAM107B |
| 170650597 |
|
Fam114a1 |
|
0 |
0 |
332 |
974 |
0 |
|
n.v. |
n.v. |
-2.65 |
1.31 |
n.v. |
|
protein Noxp20 |
| 21312816 |
|
Fam114a2 |
|
0 |
2040 |
1282 |
278 |
4273 |
|
n.v. |
0.02 |
0.11 |
0.26 |
-0.46 |
|
protein FAM114A2 isoform 2 |
| 281183372 |
|
Fam114a2 |
|
0 |
2040 |
1282 |
278 |
4273 |
|
n.v. |
0.02 |
0.11 |
0.26 |
-0.46 |
|
protein FAM114A2 isoform 1 |
| 19526958 |
|
Fam118a |
|
0 |
0 |
0 |
0 |
289 |
|
n.v. |
n.v. |
n.v. |
n.v. |
0.76 |
|
protein FAM118A isoform a |
| 30425122 |
|
Fam118b |
|
0 |
0 |
0 |
0 |
225 |
|
n.v. |
n.v. |
n.v. |
n.v. |
-0.73 |
|
protein FAM118B isoform 2 |
| 34787417 |
|
Fam118b |
|
0 |
0 |
0 |
0 |
225 |
|
n.v. |
n.v. |
n.v. |
n.v. |
-0.73 |
|
protein FAM118B isoform 1 |
| 126090857 |
|
Fam120a |
|
9958 |
11020 |
104718 |
84483 |
985 |
|
-0.04 |
0.21 |
0.18 |
-0.03 |
-0.11 |
|
constitutive coactivator of PPAR-gamma-like protein 1 |
| 126723307 |
|
Fam120c |
|
0 |
0 |
1127 |
0 |
0 |
|
n.v. |
n.v. |
0.14 |
n.v. |
n.v. |
|
constitutive coactivator of PPAR-gamma-like protein 2 |
| 117940063 |
|
Fam126a |
|
0 |
0 |
38 |
0 |
0 |
|
n.v. |
n.v. |
-0.19 |
n.v. |
n.v. |
|
hyccin |
| 241982745 |
|
Fam129a |
|
9592 |
24925 |
42410 |
48737 |
133258 |
|
0.04 |
0.06 |
-0.06 |
0.09 |
0.02 |
|
protein Niban |
| 22122641 |
|
Fam129b |
|
0 |
3851 |
12803 |
18712 |
45087 |
|
n.v. |
-0.18 |
0.04 |
-0.18 |
-0.14 |
|
niban-like protein 1 |
| 109948295 |
|
Fam133b |
|
0 |
200 |
42 |
0 |
0 |
|
n.v. |
0.3 |
-0.13 |
n.v. |
n.v. |
|
protein FAM133B |
| 28077025 |
|
Fam134c |
|
0 |
0 |
316 |
0 |
0 |
|
n.v. |
n.v. |
-0.56 |
n.v. |
n.v. |
|
protein FAM134C isoform 2 |
| 21312666 |
|
Fam134c |
|
0 |
236 |
316 |
0 |
0 |
|
n.v. |
-0.26 |
-0.56 |
n.v. |
n.v. |
|
protein FAM134C isoform 1 |
| 13385042 |
|
Fam136a |
|
0 |
0 |
0 |
0 |
793 |
|
n.v. |
n.v. |
n.v. |
n.v. |
-0.36 |
|
protein FAM136A |
| 158341634 |
|
Fam160a1 |
|
0 |
0 |
0 |
0 |
2892 |
|
n.v. |
n.v. |
n.v. |
n.v. |
-0.04 |
|
protein FAM160A1 |
| 166706907 |
|
Fam160b1 |
|
0 |
67 |
597 |
0 |
600 |
|
n.v. |
0.58 |
0.08 |
n.v. |
0.01 |
|
protein FAM160B1 |
| 257196165 |
|
Fam160b2 |
|
0 |
0 |
597 |
0 |
0 |
|
n.v. |
n.v. |
0.08 |
n.v. |
n.v. |
|
protein FAM160B2 |
| 21312546 |
|
Fam162a |
|
35038 |
9275 |
1374 |
0 |
0 |
|
0 |
-0.13 |
-0.66 |
n.v. |
n.v. |
|
protein FAM162A |
| 66955879 |
|
Fam173a |
|
0 |
1722 |
7 |
0 |
0 |
|
n.v. |
-0.97 |
-0.76 |
n.v. |
n.v. |
|
protein FAM173A |
| 21312640 |
|
Fam173b |
|
0 |
35 |
0 |
0 |
0 |
|
n.v. |
0.05 |
n.v. |
n.v. |
n.v. |
|
protein FAM173B |
| 347582639 |
|
Fam175b |
|
0 |
0 |
421 |
2930 |
4959 |
|
n.v. |
n.v. |
-0.06 |
0.01 |
0.23 |
|
BRISC complex subunit Abro1 |
| 37537562;153945763 |
|
Fam177a |
|
0 |
5275 |
572 |
851 |
1082 |
|
n.v. |
0.02 |
-0.06 |
-0.32 |
-0.06 |
|
protein FAM177A1 |
| 254939685 |
|
Fam179b |
|
0 |
0 |
0 |
1613 |
0 |
|
n.v. |
n.v. |
n.v. |
0.1 |
n.v. |
|
protein FAM179B |
| 15277329 |
|
Fam188a |
|
0 |
0 |
0 |
0 |
3159 |
|
n.v. |
n.v. |
n.v. |
n.v. |
0.05 |
|
protein FAM188A |
| 31560083 |
|
Fam192a |
|
0 |
0 |
0 |
0 |
10892 |
|
n.v. |
n.v. |
n.v. |
n.v. |
0.08 |
|
protein FAM192A |
| 85701732 |
|
Fam195b |
|
0 |
0 |
9 |
0 |
782 |
|
n.v. |
n.v. |
0.14 |
n.v. |
-0.6 |
|
protein FAM195B |
| 225903450 |
|
Fam203a |
|
0 |
0 |
231 |
0 |
2635 |
|
n.v. |
n.v. |
-0.08 |
n.v. |
-0.04 |
|
protein FAM203A |
| 19527218 |
|
Fam207a |
|
0 |
0 |
0 |
1064 |
2849 |
|
n.v. |
n.v. |
n.v. |
-0.11 |
-0.12 |
|
protein FAM207A |
| 21703824 |
|
Fam20b |
|
0 |
5557 |
0 |
0 |
0 |
|
n.v. |
-0.26 |
n.v. |
n.v. |
n.v. |
|
glycosaminoglycan xylosylkinase |
| 167234439 |
|
Fam20c |
|
0 |
17 |
0 |
0 |
0 |
|
n.v. |
0.18 |
n.v. |
n.v. |
n.v. |
|
extracellular serine/threonine protein kinase FAM20C
precursor |
| 267844902 |
|
Fam21 |
|
0 |
234 |
0 |
8 |
2303 |
|
n.v. |
1.1 |
n.v. |
0.61 |
-0.46 |
|
WASH complex subunit FAM21 |
| 24418876 |
|
Fam210a |
|
0 |
29 |
0 |
0 |
0 |
|
n.v. |
2.57 |
n.v. |
n.v. |
n.v. |
|
protein FAM210A |
| 224967102 |
|
Fam210b |
|
293 |
33 |
6 |
0 |
0 |
|
0.08 |
-0.16 |
-0.16 |
n.v. |
n.v. |
|
protein FAM210B |
| 27229101 |
|
Fam213a |
|
61984 |
13249 |
2763 |
336 |
0 |
|
0.04 |
-0.2 |
-0.38 |
-0.56 |
n.v. |
|
redox-regulatory protein FAM213A |
| 13385950 |
|
Fam32a |
|
0 |
56 |
212 |
0 |
0 |
|
n.v. |
-0.27 |
0.01 |
n.v. |
n.v. |
|
protein FAM32A |
| 21313538 |
|
Fam3a |
|
0 |
0 |
250 |
0 |
0 |
|
n.v. |
n.v. |
-0.33 |
n.v. |
n.v. |
|
protein FAM3A precursor |
| 42734496 |
|
Fam3c |
|
24988 |
16585 |
20671 |
6417 |
0 |
|
-0.11 |
-0.13 |
-0.37 |
0.16 |
n.v. |
|
protein FAM3C precursor |
| 268370235 |
|
Fam45a |
|
0 |
4400 |
2262 |
10748 |
2720 |
|
n.v. |
-0.16 |
-0.2 |
0.08 |
0.12 |
|
protein FAM45A isoform 1 |
| 268370237 |
|
Fam45a |
|
0 |
4400 |
2262 |
10748 |
2720 |
|
n.v. |
-0.16 |
-0.2 |
0.08 |
0.12 |
|
protein FAM45A isoform 2 |
| 31981350 |
|
Fam49a |
|
0 |
1689 |
610 |
0 |
40825 |
|
n.v. |
0.11 |
0.25 |
n.v. |
0.13 |
|
protein FAM49A |
| 21450053 |
|
Fam49b |
|
384 |
11895 |
2676 |
1432 |
97071 |
|
-0.82 |
0.31 |
0.2 |
0.7 |
0.14 |
|
protein FAM49B |
| 262073031 |
|
Fam50a |
|
0 |
0 |
795 |
966 |
17821 |
|
n.v. |
n.v. |
-0.09 |
0.19 |
-0.03 |
|
protein FAM50A |
| 227908825 |
|
Fam50b |
|
0 |
0 |
45 |
720 |
11663 |
|
n.v. |
n.v. |
0.06 |
0.07 |
-0.18 |
|
protein FAM50B |
| 300934856 |
|
Fam63a |
|
0 |
0 |
260 |
0 |
1596 |
|
n.v. |
n.v. |
0.08 |
n.v. |
-0.02 |
|
protein FAM63A isoform 1 |
| 41680647 |
|
Fam63a |
|
0 |
0 |
260 |
0 |
1596 |
|
n.v. |
n.v. |
0.08 |
n.v. |
-0.02 |
|
protein FAM63A isoform 2 |
| 118403316 |
|
Fam63b |
|
0 |
0 |
0 |
0 |
64 |
|
n.v. |
n.v. |
n.v. |
n.v. |
-0.45 |
|
protein FAM63B |
| 145301546 |
|
Fam65a |
|
0 |
0 |
47 |
0 |
1349 |
|
n.v. |
n.v. |
0.14 |
n.v. |
-1.01 |
|
protein FAM65A |
| 28849885 |
|
Fam76b |
|
0 |
0 |
132 |
0 |
1296 |
|
n.v. |
n.v. |
-0.14 |
n.v. |
0.05 |
|
protein FAM76B |
| 269914116 |
|
Fam83h |
|
18 |
144 |
240 |
2734 |
0 |
|
0.36 |
0.62 |
0.37 |
-0.06 |
n.v. |
|
protein FAM83H |
| 242397444 |
|
Fam84b |
|
0 |
0 |
874 |
0 |
0 |
|
n.v. |
n.v. |
0.22 |
n.v. |
n.v. |
|
uncharacterized protein LOC399603 |
| 74315977 |
|
Fam86 |
|
0 |
0 |
0 |
827 |
0 |
|
n.v. |
n.v. |
n.v. |
0.15 |
n.v. |
|
protein FAM86A |
| 13386128 |
|
Fam96a |
|
0 |
0 |
0 |
0 |
1831 |
|
n.v. |
n.v. |
n.v. |
n.v. |
0.03 |
|
MIP18 family protein FAM96A precursor |
| 21312046 |
|
Fam96b |
|
0 |
580 |
25 |
11239 |
182 |
|
n.v. |
0.26 |
0.14 |
0.26 |
0.37 |
|
mitotic spindle-associated MMXD complex subunit MIP18 |
| 139948818 |
|
Fam98a |
|
0 |
923 |
13547 |
8439 |
0 |
|
n.v. |
0.14 |
0.07 |
-0.03 |
n.v. |
|
protein FAM98A |
| 61098124 |
|
Fam98b |
|
0 |
10312 |
3592 |
7866 |
15400 |
|
n.v. |
0.15 |
0.05 |
-0.04 |
-0.08 |
|
protein FAM98B |
| 225637492 |
|
Fam98c |
|
0 |
0 |
0 |
0 |
846 |
|
n.v. |
n.v. |
n.v. |
n.v. |
0.76 |
|
uncharacterized protein LOC73833 |
| 257467664 |
|
Fan1 |
|
0 |
0 |
121 |
0 |
0 |
|
n.v. |
n.v. |
0.12 |
n.v. |
n.v. |
|
fanconi-associated nuclease 1 |
| 126722700 |
|
Fanci |
|
0 |
0 |
0 |
49 |
1896 |
|
n.v. |
n.v. |
n.v. |
-0.19 |
0.23 |
|
Fanconi anemia group I protein homolog |
| 74096448 |
|
Far1 |
|
0 |
7077 |
6922 |
0 |
0 |
|
n.v. |
-0.28 |
-0.25 |
n.v. |
n.v. |
|
fatty acyl-CoA reductase 1 |
| 110349752 |
|
Farp1 |
|
0 |
3833 |
6469 |
0 |
0 |
|
n.v. |
0.02 |
0.13 |
n.v. |
n.v. |
|
FERMRhoGEF (Arhgef) and pleckstrin domain protein 1 |
| 229892332 |
|
Farp2 |
|
0 |
0 |
459 |
0 |
0 |
|
n.v. |
n.v. |
-0.19 |
n.v. |
n.v. |
|
FERM, RhoGEF and pleckstrin domain-containing protein
2 |
| 162138894 |
|
Farsa |
|
3515 |
5315 |
100428 |
203804 |
0 |
|
-0.66 |
0.13 |
0.01 |
0.04 |
n.v. |
|
phenylalanine--tRNA ligase alpha subunit |
| 31981400 |
|
Farsb |
|
0 |
23704 |
133668 |
333103 |
0 |
|
n.v. |
0.11 |
0.01 |
-0.03 |
n.v. |
|
phenylalanine--tRNA ligase beta subunit |
| 93102409 |
|
Fasn |
|
26178 |
53994 |
86930 |
1887141 |
1026088 |
|
0.23 |
0.07 |
0 |
0.13 |
-0.07 |
|
fatty acid synthase |
| 27369557 |
|
Fastkd2 |
|
0 |
655 |
0 |
0 |
0 |
|
n.v. |
-1 |
n.v. |
n.v. |
n.v. |
|
FAST kinase domain-containing protein 2 |
| 157951641 |
|
Fat1 |
|
0 |
54 |
98 |
0 |
0 |
|
n.v. |
0.19 |
-0.66 |
n.v. |
n.v. |
|
FAT tumor suppressor homolog 1 precursor |
| 237681133 |
|
Fau |
|
0 |
13366 |
19414 |
53190 |
0 |
|
n.v. |
0.01 |
0.23 |
-0.11 |
n.v. |
|
40S ribosomal protein S30 precursor |
| 144922653 |
|
Fbf1 |
|
0 |
0 |
31 |
0 |
0 |
|
n.v. |
n.v. |
0.63 |
n.v. |
n.v. |
|
fas-binding factor 1 |
| 110625770 |
|
Fblim1 |
|
0 |
0 |
0 |
0 |
20637 |
|
n.v. |
n.v. |
n.v. |
n.v. |
0.46 |
|
filamin-binding LIM protein 1 |
| 51921297 |
|
Fbll1 |
|
97736 |
5428 |
764 |
11042 |
0 |
|
0.08 |
0.1 |
-0.48 |
-0.2 |
n.v. |
|
rRNA/tRNA 2'-O-methyltransferase fibrillarin-like protein
1 |
| 122937183 |
|
Fbp2 |
|
0 |
0 |
31 |
205 |
11149 |
|
n.v. |
n.v. |
-0.58 |
0.52 |
0.05 |
|
fructose-1,6-bisphosphatase isozyme 2 |
| 125347476 |
|
Fbrsl1 |
|
0 |
0 |
1772 |
0 |
0 |
|
n.v. |
n.v. |
-0.05 |
n.v. |
n.v. |
|
fibrosin-like 1 isoform 2 |
| 217416345 |
|
Fbrsl1 |
|
0 |
0 |
1772 |
0 |
0 |
|
n.v. |
n.v. |
-0.05 |
n.v. |
n.v. |
|
fibrosin-like 1 isoform 1 |
| 140970874 |
|
Fbxl15 |
|
0 |
0 |
0 |
0 |
2624 |
|
n.v. |
n.v. |
n.v. |
n.v. |
0.41 |
|
F-box/LRR-repeat protein 15 |
| 153945830 |
|
Fbxl18 |
|
0 |
0 |
20 |
0 |
0 |
|
n.v. |
n.v. |
0.18 |
n.v. |
n.v. |
|
F-box and leucine-rich repeat protein 18 |
| 111494221 |
|
Fbxl20 |
|
0 |
240 |
114 |
0 |
0 |
|
n.v. |
0.03 |
-0.12 |
n.v. |
n.v. |
|
F-box/LRR-repeat protein 20 |
| 255683411 |
|
Fbxl8 |
|
0 |
0 |
38 |
0 |
471 |
|
n.v. |
n.v. |
0.13 |
n.v. |
0.61 |
|
F-box/LRR-repeat protein 8 |
| 33859801 |
|
Fbxo2 |
|
0 |
0 |
0 |
0 |
7572 |
|
n.v. |
n.v. |
n.v. |
n.v. |
-0.07 |
|
F-box only protein 2 |
| 21704134 |
|
Fbxo21 |
|
0 |
0 |
0 |
0 |
396 |
|
n.v. |
n.v. |
n.v. |
n.v. |
0.18 |
|
F-box only protein 21 |
| 139948465 |
|
Fbxo22 |
|
0 |
1472 |
762 |
7081 |
48225 |
|
n.v. |
-0.07 |
0.24 |
0.35 |
0.08 |
|
F-box only protein 22 |
| 28201989 |
|
Fbxo28 |
|
0 |
0 |
0 |
8 |
0 |
|
n.v. |
n.v. |
n.v. |
-0.17 |
n.v. |
|
F-box only protein 28 |
| 10181216 |
|
Fbxo3 |
|
0 |
0 |
0 |
0 |
1456 |
|
n.v. |
n.v. |
n.v. |
n.v. |
0.05 |
|
F-box only protein 3 isoform 2 |
| 46877055 |
|
Fbxo3 |
|
0 |
0 |
0 |
0 |
1456 |
|
n.v. |
n.v. |
n.v. |
n.v. |
0.05 |
|
F-box only protein 3 isoform 1 |
| 13385848 |
|
Fbxo32 |
|
0 |
0 |
4 |
0 |
0 |
|
n.v. |
n.v. |
4.73 |
n.v. |
n.v. |
|
F-box only protein 32 |
| 256665259 |
|
Fbxo4 |
|
0 |
40 |
0 |
0 |
1681 |
|
n.v. |
0.61 |
n.v. |
n.v. |
-0.01 |
|
F-box only protein 4 |
| 47564092 |
|
Fbxo41 |
|
0 |
0 |
0 |
0 |
2677 |
|
n.v. |
n.v. |
n.v. |
n.v. |
0.09 |
|
F-box only protein 41 |
| 56961627 |
|
Fbxo45 |
|
0 |
0 |
47 |
1981 |
0 |
|
n.v. |
n.v. |
-0.05 |
0.02 |
n.v. |
|
F-box/SPRY domain-containing protein 1 |
| 7657083 |
|
Fbxo6 |
|
0 |
541 |
114 |
3184 |
5687 |
|
n.v. |
-0.28 |
-0.01 |
-0.01 |
0.34 |
|
F-box only protein 6 |
| 23956270 |
|
Fbxw11 |
|
0 |
0 |
91 |
401 |
0 |
|
n.v. |
n.v. |
0.1 |
0.01 |
n.v. |
|
F-box/WD repeat-containing protein 11 isoform a |
| 405778325 |
|
Fbxw11 |
|
0 |
0 |
91 |
401 |
0 |
|
n.v. |
n.v. |
0.1 |
0.01 |
n.v. |
|
F-box/WD repeat-containing protein 11 isoform b |
| 405778327 |
|
Fbxw11 |
|
0 |
0 |
91 |
401 |
0 |
|
n.v. |
n.v. |
0.1 |
0.01 |
n.v. |
|
F-box/WD repeat-containing protein 11 isoform c |
| 405778329 |
|
Fbxw11 |
|
0 |
0 |
91 |
401 |
0 |
|
n.v. |
n.v. |
0.1 |
0.01 |
n.v. |
|
F-box/WD repeat-containing protein 11 isoform d |
| 29243960 |
|
Fbxw13 |
|
0 |
0 |
173 |
0 |
0 |
|
n.v. |
n.v. |
-0.27 |
n.v. |
n.v. |
|
F-box and WD-40 domain protein 13 |
| 47271358 |
|
Fbxw14 |
|
0 |
0 |
0 |
827 |
0 |
|
n.v. |
n.v. |
n.v. |
0.11 |
n.v. |
|
F-box and WD-40 domain protein 14 |
| 148539588 |
|
Fbxw22 |
|
0 |
0 |
0 |
827 |
0 |
|
n.v. |
n.v. |
n.v. |
0.11 |
n.v. |
|
F-box and WD-40 domain protein 22 |
| 294459937 |
|
Fbxw28 |
|
0 |
0 |
0 |
827 |
0 |
|
n.v. |
n.v. |
n.v. |
0.11 |
n.v. |
|
F-box and WD-40 domain protein 28 isoform 1 |
| 294459939 |
|
Fbxw28 |
|
0 |
0 |
0 |
827 |
0 |
|
n.v. |
n.v. |
n.v. |
0.11 |
n.v. |
|
F-box and WD-40 domain protein 28 isoform 2 |
| 14780880 |
|
Fbxw4 |
|
0 |
0 |
3 |
82 |
0 |
|
n.v. |
n.v. |
0.19 |
0.08 |
n.v. |
|
F-box/WD repeat-containing protein 4 |
| 120407054 |
|
Fbxw8 |
|
0 |
0 |
0 |
2038 |
0 |
|
n.v. |
n.v. |
n.v. |
0.14 |
n.v. |
|
F-box/WD repeat-containing protein 8 |
| 359279906 |
|
Fcer2a |
|
0 |
0 |
157 |
0 |
0 |
|
n.v. |
n.v. |
-0.22 |
n.v. |
n.v. |
|
low affinity immunoglobulin epsilon Fc receptor isoform C |
| 359279914 |
|
Fcer2a |
|
0 |
0 |
157 |
0 |
0 |
|
n.v. |
n.v. |
-0.22 |
n.v. |
n.v. |
|
low affinity immunoglobulin epsilon Fc receptor isoform A |
| 359279919 |
|
Fcer2a |
|
0 |
0 |
157 |
0 |
0 |
|
n.v. |
n.v. |
-0.22 |
n.v. |
n.v. |
|
low affinity immunoglobulin epsilon Fc receptor isoform E |
| 359279923 |
|
Fcer2a |
|
0 |
0 |
157 |
0 |
0 |
|
n.v. |
n.v. |
-0.22 |
n.v. |
n.v. |
|
low affinity immunoglobulin epsilon Fc receptor isoform F |
| 359279925 |
|
Fcer2a |
|
0 |
0 |
157 |
0 |
0 |
|
n.v. |
n.v. |
-0.22 |
n.v. |
n.v. |
|
low affinity immunoglobulin epsilon Fc receptor isoform G |
| 359339166 |
|
Fcer2a |
|
0 |
0 |
157 |
0 |
0 |
|
n.v. |
n.v. |
-0.22 |
n.v. |
n.v. |
|
low affinity immunoglobulin epsilon Fc receptor isoform B |
| 7305051 |
|
Fcer2a |
|
0 |
0 |
157 |
0 |
0 |
|
n.v. |
n.v. |
-0.22 |
n.v. |
n.v. |
|
low affinity immunoglobulin epsilon Fc receptor isoform A |
| 268607601 |
|
Fcf1 |
|
0 |
0 |
600 |
205 |
0 |
|
n.v. |
n.v. |
-0.06 |
1.04 |
n.v. |
|
rRNA-processing protein FCF1 homolog |
| 169790797 |
|
Fcgbp |
|
0 |
8864 |
6011 |
409 |
2784 |
|
n.v. |
-0.38 |
-0.57 |
-0.12 |
-0.21 |
|
Fc fragment of IgG binding protein precursor |
| 224994271 |
|
Fcho2 |
|
0 |
0 |
0 |
360 |
4573 |
|
n.v. |
n.v. |
n.v. |
0.9 |
-0.18 |
|
FCH domain only protein 2 |
| 34328173 |
|
Fdft1 |
|
0 |
522 |
0 |
0 |
0 |
|
n.v. |
-1 |
n.v. |
n.v. |
n.v. |
|
squalene synthase |
| 19882207 |
|
Fdps |
|
19899 |
850 |
13643 |
27757 |
187609 |
|
0.12 |
0.13 |
0.12 |
0.25 |
0.09 |
|
farnesyl pyrophosphate synthase isoform 2 |
| 359279938 |
|
Fdps |
|
19899 |
850 |
13643 |
27757 |
187609 |
|
0.12 |
0.13 |
0.12 |
0.25 |
0.09 |
|
farnesyl pyrophosphate synthase isoform 1 precursor |
| 6679765 |
|
Fdx1 |
|
4247 |
1027 |
0 |
0 |
1285 |
|
0.12 |
-0.15 |
n.v. |
n.v. |
-0.28 |
|
adrenodoxin, mitochondrial precursor |
| 90017457 |
|
Fdx1l |
|
0 |
359 |
0 |
0 |
0 |
|
n.v. |
-0.3 |
n.v. |
n.v. |
n.v. |
|
adrenodoxin-like protein, mitochondrial precursor |
| 6679767 |
|
Fdxr |
|
0 |
3877 |
0 |
0 |
0 |
|
n.v. |
-0.3 |
n.v. |
n.v. |
n.v. |
|
NADPH:adrenodoxin oxidoreductase, mitochondrial precursor |
| 20452466 |
|
Fech |
|
0 |
449 |
0 |
0 |
0 |
|
n.v. |
-1.08 |
n.v. |
n.v. |
n.v. |
|
ferrochelatase, mitochondrial |
| 6753840 |
|
Fem1b |
|
0 |
0 |
0 |
745 |
0 |
|
n.v. |
n.v. |
n.v. |
0.22 |
n.v. |
|
protein fem-1 homolog B |
| 27734132 |
|
Fem1c |
|
0 |
0 |
0 |
565 |
0 |
|
n.v. |
n.v. |
n.v. |
-0.06 |
n.v. |
|
protein fem-1 homolog C |
| 46048490 |
|
Fen1 |
|
8567 |
21562 |
11010 |
34690 |
37815 |
|
0.14 |
0.25 |
0.04 |
0.12 |
0.04 |
|
flap endonuclease 1 |
| 124487315 |
|
Fermt1 |
|
0 |
0 |
920 |
0 |
0 |
|
n.v. |
n.v. |
0.12 |
n.v. |
n.v. |
|
fermitin family homolog 1 |
| 67906179 |
|
Fermt2 |
|
0 |
1497 |
7745 |
4723 |
8054 |
|
n.v. |
0.29 |
0.16 |
-0.22 |
0.19 |
|
fermitin family homolog 2 |
| 40789098 |
|
Fez2 |
|
0 |
0 |
0 |
0 |
214 |
|
n.v. |
n.v. |
n.v. |
n.v. |
0.25 |
|
fasciculation and elongation protein zeta-2 |
| 31982367 |
|
Fgd1 |
|
0 |
0 |
0 |
0 |
1242 |
|
n.v. |
n.v. |
n.v. |
n.v. |
0.3 |
|
FYVE, RhoGEF and PH domain-containing protein 1 |
| 85719309 |
|
Fgd3 |
|
0 |
0 |
0 |
0 |
3545 |
|
n.v. |
n.v. |
n.v. |
n.v. |
0.26 |
|
FYVE, RhoGEF and PH domain-containing protein 3 |
| 22296595 |
|
Fgd4 |
|
0 |
0 |
0 |
0 |
2046 |
|
n.v. |
n.v. |
n.v. |
n.v. |
-0.02 |
|
FYVE, RhoGEF and PH domain-containing protein 4 isoform
beta |
| 22296599 |
|
Fgd4 |
|
0 |
0 |
0 |
0 |
2046 |
|
n.v. |
n.v. |
n.v. |
n.v. |
-0.02 |
|
FYVE, RhoGEF and PH domain-containing protein 4 isoform
gamma |
| 29336047 |
|
Fgd4 |
|
0 |
0 |
0 |
0 |
2046 |
|
n.v. |
n.v. |
n.v. |
n.v. |
-0.02 |
|
FYVE, RhoGEF and PH domain-containing protein 4 isoform
alpha |
| 6753850 |
|
Fgf1 |
|
0 |
0 |
0 |
0 |
21 |
|
n.v. |
n.v. |
n.v. |
n.v. |
-0.15 |
|
fibroblast growth factor 1 precursor |
| 120952633 |
|
Fgfr1 |
|
0 |
2261 |
3440 |
4330 |
34420 |
|
n.v. |
0.15 |
-0.03 |
0.42 |
0.29 |
|
fibroblast growth factor receptor 1 isoform 3 |
| 120952641 |
|
Fgfr1 |
|
0 |
2261 |
3440 |
4330 |
34420 |
|
n.v. |
0.15 |
-0.03 |
0.42 |
0.29 |
|
fibroblast growth factor receptor 1 isoform 1 precursor |
| 120952698 |
|
Fgfr1 |
|
0 |
2261 |
3440 |
4330 |
34420 |
|
n.v. |
0.15 |
-0.03 |
0.42 |
0.29 |
|
fibroblast growth factor receptor 1 isoform 2 precursor |
| 116089349 |
|
Fgfr2 |
|
0 |
2261 |
3440 |
4330 |
34420 |
|
n.v. |
0.15 |
-0.03 |
0.42 |
0.29 |
|
fibroblast growth factor receptor 2 isoform IIIc |
| 116089355 |
|
Fgfr2 |
|
0 |
2261 |
3440 |
4330 |
34420 |
|
n.v. |
0.15 |
-0.03 |
0.42 |
0.29 |
|
fibroblast growth factor receptor 2 isoform IIIb |
| 254028252 |
|
Fgfr3 |
|
0 |
2261 |
3440 |
4330 |
34420 |
|
n.v. |
0.15 |
-0.03 |
0.42 |
0.29 |
|
fibroblast growth factor receptor 3 isoform 2 precursor |
| 254028254 |
|
Fgfr3 |
|
0 |
2261 |
3440 |
4330 |
36220 |
|
n.v. |
0.15 |
-0.03 |
0.42 |
0.17 |
|
fibroblast growth factor receptor 3 isoform 3 precursor |
| 328751707 |
|
Fgfr3 |
|
0 |
2261 |
3440 |
4330 |
34420 |
|
n.v. |
0.15 |
-0.03 |
0.42 |
0.29 |
|
fibroblast growth factor receptor 3 isoform 4 precursor |
| 46877057 |
|
Fgfr3 |
|
0 |
2261 |
3440 |
4330 |
34420 |
|
n.v. |
0.15 |
-0.03 |
0.42 |
0.29 |
|
fibroblast growth factor receptor 3 isoform 1 precursor |
| 112293260 |
|
Fgfr4 |
|
0 |
2261 |
3440 |
4330 |
34420 |
|
n.v. |
0.15 |
-0.03 |
0.42 |
0.29 |
|
fibroblast growth factor receptor 4 precursor |
| 171542819 |
|
Fgr |
|
0 |
2261 |
3440 |
4330 |
34420 |
|
n.v. |
0.15 |
-0.03 |
0.42 |
0.29 |
|
tyrosine-protein kinase Fgr |
| 226823367 |
|
Fh1 |
|
78844 |
23687 |
1248 |
2447 |
73788 |
|
0.07 |
-0.11 |
0 |
0.2 |
-0.15 |
|
fumarate hydratase, mitochondrial precursor |
| 209413705 |
|
Fhad1 |
|
0 |
0 |
0 |
49 |
0 |
|
n.v. |
n.v. |
n.v. |
0.36 |
n.v. |
|
forkhead-associated domain-containing protein 1 |
| 116517334 |
|
Fhl1 |
|
0 |
0 |
539 |
5026 |
3213 |
|
n.v. |
0.65 |
0.24 |
0.26 |
0.3 |
|
four and a half LIM domains protein 1 isoform 3 |
| 116517336 |
|
Fhl1 |
|
0 |
0 |
539 |
5026 |
3213 |
|
n.v. |
0.65 |
0.24 |
0.26 |
0.3 |
|
four and a half LIM domains protein 1 isoform 2 |
| 116517340 |
|
Fhl1 |
|
0 |
0 |
539 |
5026 |
3213 |
|
n.v. |
0.65 |
0.24 |
0.26 |
0.3 |
|
four and a half LIM domains protein 1 isoform 1 |
| 6753866 |
|
Fhl2 |
|
0 |
0 |
0 |
0 |
4851 |
|
n.v. |
n.v. |
n.v. |
n.v. |
0.1 |
|
four and a half LIM domains protein 2 |
| 130488506 |
|
Fhl3 |
|
0 |
453 |
91 |
385 |
46747 |
|
n.v. |
0.23 |
0.17 |
0.32 |
0.1 |
|
four and a half LIM domains protein 3 |
| 269973931 |
|
Fhod1 |
|
0 |
0 |
0 |
0 |
546 |
|
n.v. |
n.v. |
n.v. |
n.v. |
0.98 |
|
FH1/FH2 domain-containing protein 1 |
| 37674240 |
|
Fhod3 |
|
0 |
0 |
183 |
0 |
0 |
|
n.v. |
n.v. |
0.06 |
n.v. |
n.v. |
|
FH1/FH2 domain-containing protein 3 |
| 19527220 |
|
Fig4 |
|
0 |
31 |
48 |
745 |
0 |
|
n.v. |
0.28 |
0.03 |
0.25 |
n.v. |
|
polyphosphoinositide phosphatase |
| 31560300 |
|
Fignl1 |
|
0 |
0 |
1989 |
0 |
4059 |
|
n.v. |
n.v. |
0.14 |
n.v. |
0.23 |
|
fidgetin-like protein 1 |
| 227330595 |
|
Fip1l1 |
|
0 |
0 |
72 |
0 |
0 |
|
n.v. |
n.v. |
-0.34 |
n.v. |
n.v. |
|
pre-mRNA 3'-end-processing factor FIP1 isoform 1 |
| 227330598 |
|
Fip1l1 |
|
0 |
0 |
72 |
0 |
0 |
|
n.v. |
n.v. |
-0.34 |
n.v. |
n.v. |
|
pre-mRNA 3'-end-processing factor FIP1 isoform 3 |
| 31560210 |
|
Fip1l1 |
|
0 |
0 |
72 |
0 |
0 |
|
n.v. |
n.v. |
-0.34 |
n.v. |
n.v. |
|
pre-mRNA 3'-end-processing factor FIP1 isoform 2 |
| 13384998 |
|
Fis1 |
|
43312 |
470 |
7435 |
26112 |
3116 |
|
-0.05 |
-0.04 |
-0.24 |
-0.27 |
-0.18 |
|
mitochondrial fission 1 protein isoform 1 |
| 253735731 |
|
Fis1 |
|
43312 |
470 |
7435 |
26112 |
3116 |
|
-0.05 |
-0.04 |
-0.24 |
-0.27 |
-0.18 |
|
mitochondrial fission 1 protein isoform 2 |
| 27734174 |
|
Fitm2 |
|
0 |
992 |
0 |
0 |
0 |
|
n.v. |
-0.3 |
n.v. |
n.v. |
n.v. |
|
fat storage-inducing transmembrane protein 2 |
| 160333154 |
|
Fiz1 |
|
0 |
0 |
16 |
33 |
0 |
|
n.v. |
n.v. |
0.01 |
-0.34 |
n.v. |
|
flt3-interacting zinc finger protein 1 |
| 227116320 |
|
Fkbp15 |
|
0 |
31 |
401 |
0 |
750 |
|
n.v. |
0.94 |
0.16 |
n.v. |
-0.37 |
|
FK506-binding protein 15 |
| 6679803 |
|
Fkbp1a |
|
366 |
474 |
1813 |
540 |
63058 |
|
0.3 |
0.29 |
0.08 |
-0.04 |
0.17 |
|
peptidyl-prolyl cis-trans isomerase FKBP1A |
| 123173728 |
|
Fkbp1b |
|
0 |
0 |
0 |
0 |
2046 |
|
n.v. |
n.v. |
n.v. |
n.v. |
0 |
|
peptidyl-prolyl cis-trans isomerase FKBP1B |
| 261824055;6679805 |
|
Fkbp2 |
|
13876 |
0 |
1144 |
0 |
0 |
|
0.12 |
n.v. |
-0.34 |
n.v. |
n.v. |
|
peptidyl-prolyl cis-trans isomerase FKBP2 precursor |
| 6679805 |
|
Fkbp2 |
|
0 |
11882 |
0 |
0 |
12284 |
|
n.v. |
-0.22 |
n.v. |
n.v. |
-0.3 |
|
peptidyl-prolyl cis-trans isomerase FKBP2 precursor |
| 7305061 |
|
Fkbp3 |
|
13345 |
11452 |
49650 |
45970 |
8685 |
|
-0.02 |
0.18 |
0.01 |
0.04 |
-0.16 |
|
peptidyl-prolyl cis-trans isomerase FKBP3 |
| 6753882 |
|
Fkbp4 |
|
6114 |
21570 |
41627 |
114262 |
380327 |
|
-0.04 |
0.08 |
0.02 |
0.1 |
-0.07 |
|
peptidyl-prolyl cis-trans isomerase FKBP4 |
| 6753884 |
|
Fkbp5 |
|
2178 |
9797 |
36703 |
73416 |
158394 |
|
0.08 |
0.03 |
0.03 |
0.11 |
0.05 |
|
peptidyl-prolyl cis-trans isomerase FKBP5 |
| 161484656 |
|
Fkbp8 |
|
6133 |
4463 |
975 |
0 |
0 |
|
0.22 |
-0.15 |
-0.21 |
n.v. |
n.v. |
|
peptidyl-prolyl cis-trans isomerase FKBP8 isoform b |
| 161484658 |
|
Fkbp8 |
|
6133 |
4463 |
975 |
0 |
0 |
|
0.22 |
-0.15 |
-0.21 |
n.v. |
n.v. |
|
peptidyl-prolyl cis-trans isomerase FKBP8 isoform a |
| 172072617 |
|
Fkbp9 |
|
0 |
1044 |
0 |
0 |
0 |
|
n.v. |
-0.19 |
n.v. |
n.v. |
n.v. |
|
peptidyl-prolyl cis-trans isomerase FKBP9 precursor |
| 89337262 |
|
Flad1 |
|
0 |
134 |
0 |
0 |
5805 |
|
n.v. |
0.1 |
n.v. |
n.v. |
-0.3 |
|
FAD synthase |
| 405778335 |
|
Flcn |
|
0 |
0 |
15 |
0 |
161 |
|
n.v. |
n.v. |
0.1 |
n.v. |
0.19 |
|
folliculin |
| 84370015 |
|
Flg2 |
|
0 |
0 |
10 |
0 |
0 |
|
n.v. |
n.v. |
0.22 |
n.v. |
n.v. |
|
filaggrin-2 |
| 11528490 |
|
Flii |
|
4943 |
499 |
23134 |
73973 |
45655 |
|
0.12 |
-0.08 |
0.06 |
-0.01 |
-0.14 |
|
protein flightless-1 homolog |
| 125347376 |
|
Flna |
|
31358 |
10544 |
27676 |
98595 |
604626 |
|
0.04 |
0.34 |
0.34 |
0.27 |
0.19 |
|
filamin-A |
| 145966915 |
|
Flnb |
|
129094 |
32747 |
66376 |
190691 |
1203159 |
|
0.07 |
0.25 |
0.17 |
0.09 |
-0.06 |
|
filamin-B |
| 124487139 |
|
Flnc |
|
34873 |
3373 |
6812 |
21945 |
181258 |
|
0.04 |
0.2 |
0.19 |
0.09 |
0.15 |
|
filamin-C |
| 6679809 |
|
Flot1 |
|
1355 |
6058 |
8193 |
0 |
0 |
|
0.23 |
-0.11 |
-0.12 |
n.v. |
n.v. |
|
flotillin-1 |
| 6679811 |
|
Flot2 |
|
0 |
1004 |
3963 |
0 |
0 |
|
n.v. |
0.17 |
-0.05 |
n.v. |
n.v. |
|
flotillin-2 isoform 2 |
| 94536791 |
|
Flot2 |
|
0 |
1004 |
4109 |
0 |
0 |
|
n.v. |
0.17 |
-0.05 |
n.v. |
n.v. |
|
flotillin-2 isoform 1 |
| 34328180 |
|
Flt1 |
|
0 |
202 |
6785 |
36254 |
73039 |
|
n.v. |
0.05 |
-0.02 |
0.01 |
-0.01 |
|
vascular endothelial growth factor receptor 1
precursor |
| 122937353 |
|
Flt3 |
|
0 |
202 |
6785 |
36254 |
73039 |
|
n.v. |
0.05 |
-0.02 |
0.01 |
-0.01 |
|
receptor-type tyrosine-protein kinase FLT3 |
| 6679813 |
|
Flt4 |
|
0 |
202 |
6785 |
36254 |
73039 |
|
n.v. |
0.05 |
-0.02 |
0.01 |
-0.01 |
|
vascular endothelial growth factor receptor 3
precursor |
| 21553307 |
|
Flywch2 |
|
0 |
0 |
0 |
0 |
4584 |
|
n.v. |
n.v. |
n.v. |
n.v. |
-0.92 |
|
FLYWCH family member 2 |
| 112807205 |
|
Fmn1 |
|
0 |
0 |
0 |
557 |
6843 |
|
n.v. |
n.v. |
n.v. |
0.05 |
0.12 |
|
formin-1 isoform 1 |
| 112807211 |
|
Fmn1 |
|
0 |
0 |
0 |
557 |
6843 |
|
n.v. |
n.v. |
n.v. |
0.05 |
0.12 |
|
formin-1 isoform 2 |
| 118136288 |
|
Fmnl1 |
|
0 |
0 |
2205 |
0 |
0 |
|
n.v. |
n.v. |
-0.14 |
n.v. |
n.v. |
|
formin-like protein 1 isoform 2 |
| 118136290 |
|
Fmnl1 |
|
0 |
0 |
2205 |
0 |
0 |
|
n.v. |
n.v. |
-0.14 |
n.v. |
n.v. |
|
formin-like protein 1 isoform 1 |
| 124378048 |
|
Fmnl2 |
|
1227 |
4250 |
17772 |
26971 |
21 |
|
0.94 |
-0.08 |
-0.06 |
-0.28 |
-0.14 |
|
formin-like protein 2 |
| 38708163 |
|
Fmnl3 |
|
1227 |
1501 |
24533 |
49334 |
21 |
|
0.94 |
0.14 |
-0.02 |
-0.02 |
-0.14 |
|
formin-like protein 3 |
| 31542819 |
|
Fmo2 |
|
0 |
0 |
0 |
0 |
2228 |
|
n.v. |
n.v. |
n.v. |
n.v. |
-0.14 |
|
dimethylaniline monooxygenase [N-oxide-forming] 2 |
| 51036613 |
|
Fmr1 |
|
12778 |
3472 |
26932 |
12303 |
0 |
|
0 |
0.1 |
0.2 |
0.11 |
n.v. |
|
fragile X mental retardation protein 1 homolog |
| 449083336 |
|
Fn1 |
|
0 |
225 |
0 |
0 |
0 |
|
n.v. |
-0.39 |
n.v. |
n.v. |
n.v. |
|
fibronectin isoform b precursor |
| 449083339 |
|
Fn1 |
|
0 |
225 |
0 |
0 |
0 |
|
n.v. |
-0.39 |
n.v. |
n.v. |
n.v. |
|
fibronectin isoform c precursor |
| 449083341 |
|
Fn1 |
|
0 |
225 |
0 |
0 |
0 |
|
n.v. |
-0.39 |
n.v. |
n.v. |
n.v. |
|
fibronectin isoform d precursor |
| 449083343 |
|
Fn1 |
|
0 |
225 |
0 |
0 |
0 |
|
n.v. |
-0.39 |
n.v. |
n.v. |
n.v. |
|
fibronectin isoform e precursor |
| 449083345 |
|
Fn1 |
|
0 |
225 |
0 |
0 |
0 |
|
n.v. |
-0.39 |
n.v. |
n.v. |
n.v. |
|
fibronectin isoform f precursor |
| 449083347 |
|
Fn1 |
|
0 |
225 |
0 |
0 |
0 |
|
n.v. |
-0.39 |
n.v. |
n.v. |
n.v. |
|
fibronectin isoform g precursor |
| 46849812 |
|
Fn1 |
|
0 |
328 |
0 |
0 |
0 |
|
n.v. |
0.1 |
n.v. |
n.v. |
n.v. |
|
fibronectin precursor |
| 11528496 |
|
Fn3k |
|
0 |
0 |
0 |
0 |
54 |
|
n.v. |
n.v. |
n.v. |
n.v. |
-0.46 |
|
fructosamine-3-kinase isoform a |
| 84662727 |
|
Fn3k |
|
0 |
0 |
0 |
0 |
54 |
|
n.v. |
n.v. |
n.v. |
n.v. |
-0.46 |
|
fructosamine-3-kinase isoform b |
| 253970463 |
|
Fn3krp |
|
0 |
21 |
86 |
221 |
1574 |
|
n.v. |
0 |
0.14 |
0.17 |
-0.03 |
|
ketosamine-3-kinase |
| 294997322 |
|
Fnbp1 |
|
0 |
0 |
0 |
745 |
0 |
|
n.v. |
n.v. |
n.v. |
0.26 |
n.v. |
|
formin-binding protein 1 isoform c |
| 294997326 |
|
Fnbp1 |
|
0 |
0 |
0 |
745 |
0 |
|
n.v. |
n.v. |
n.v. |
0.26 |
n.v. |
|
formin-binding protein 1 isoform d |
| 294997328 |
|
Fnbp1 |
|
0 |
0 |
0 |
745 |
0 |
|
n.v. |
n.v. |
n.v. |
0.26 |
n.v. |
|
formin-binding protein 1 isoform e |
| 84662770 |
|
Fnbp1 |
|
0 |
0 |
0 |
745 |
0 |
|
n.v. |
n.v. |
n.v. |
0.26 |
n.v. |
|
formin-binding protein 1 isoform a |
| 167900464 |
|
Fnbp1l |
|
0 |
1215 |
2416 |
11149 |
0 |
|
n.v. |
0.12 |
0.13 |
0.05 |
n.v. |
|
formin-binding protein 1-like isoform 2 |
| 167900466 |
|
Fnbp1l |
|
0 |
1215 |
2416 |
11149 |
0 |
|
n.v. |
0.12 |
0.13 |
0.05 |
n.v. |
|
formin-binding protein 1-like isoform 1 |
| 9055220 |
|
Fnbp4 |
|
0 |
0 |
0 |
0 |
364 |
|
n.v. |
n.v. |
n.v. |
n.v. |
-0.04 |
|
formin-binding protein 4 |
| 170932548 |
|
Fndc3b |
|
0 |
388 |
0 |
0 |
0 |
|
n.v. |
-0.34 |
n.v. |
n.v. |
n.v. |
|
fibronectin type III domain-containing protein 3B |
| 6679821 |
|
Fnta |
|
0 |
814 |
666 |
0 |
14104 |
|
n.v. |
0.16 |
0.12 |
n.v. |
0.02 |
|
protein farnesyltransferase/geranylgeranyltransferase
type-1 subunit alpha |
| 22122343 |
|
Fntb |
|
0 |
449 |
332 |
0 |
20027 |
|
n.v. |
-0.08 |
-0.53 |
n.v. |
-0.07 |
|
protein farnesyltransferase subunit beta |
| 124487123 |
|
Focad |
|
0 |
0 |
2319 |
156 |
0 |
|
n.v. |
n.v. |
0.12 |
-0.81 |
n.v. |
|
focadhesin |
| 21313614 |
|
Fopnl |
|
0 |
0 |
0 |
0 |
461 |
|
n.v. |
n.v. |
n.v. |
n.v. |
0.07 |
|
lisH domain-containing protein FOPNL |
| 34304111 |
|
Foxe1 |
|
3057 |
0 |
0 |
0 |
0 |
|
-1.35 |
n.v. |
n.v. |
n.v. |
n.v. |
|
forkhead box protein E1 |
| 172088163 |
|
Fpgs |
|
0 |
21 |
0 |
0 |
0 |
|
n.v. |
0.12 |
n.v. |
n.v. |
n.v. |
|
folylpolyglutamate synthase, mitochondrial precursor |
| 126157515 |
|
Fras1 |
|
0 |
73 |
6 |
0 |
0 |
|
n.v. |
-0.12 |
-0.09 |
n.v. |
n.v. |
|
extracellular matrix protein FRAS1 precursor |
| 71051607 |
|
Frem2 |
|
0 |
4497 |
945 |
0 |
42281 |
|
n.v. |
-0.26 |
-0.3 |
n.v. |
0.04 |
|
FRAS1-related extracellular matrix protein 2 precursor |
| 225543552 |
|
Frg1 |
|
3716 |
2741 |
2289 |
8341 |
0 |
|
-0.95 |
0.01 |
-0.18 |
-0.29 |
n.v. |
|
protein FRG1 |
| 31542823 |
|
Frk |
|
15304 |
19666 |
68195 |
2873 |
5837 |
|
0.22 |
-0.03 |
-0.2 |
-1.58 |
-0.86 |
|
tyrosine-protein kinase FRK |
| 13385676 |
|
Frmd8 |
|
0 |
390 |
1450 |
9643 |
0 |
|
n.v. |
-0.17 |
-0.08 |
-0.18 |
n.v. |
|
FERM domain-containing protein 8 |
| 124487185 |
|
Frmpd1 |
|
0 |
2046 |
2290 |
0 |
0 |
|
n.v. |
0.12 |
-0.08 |
n.v. |
n.v. |
|
FERM and PDZ domain-containing protein 1 |
| 85362701 |
|
Frmpd4 |
|
0 |
0 |
0 |
0 |
2067 |
|
n.v. |
n.v. |
n.v. |
n.v. |
0.08 |
|
FERM and PDZ domain-containing protein 4 |
| 164698442 |
|
Frrs1 |
|
0 |
2307 |
190 |
0 |
450 |
|
n.v. |
-0.01 |
-0.32 |
n.v. |
0.15 |
|
ferric-chelate reductase 1 precursor |
| 29244340 |
|
Frs2 |
|
0 |
0 |
100 |
0 |
0 |
|
n.v. |
n.v. |
0.28 |
n.v. |
n.v. |
|
fibroblast growth factor receptor substrate 2 |
| 119964716 |
|
Fryl |
|
0 |
21 |
480 |
8 |
0 |
|
n.v. |
0.33 |
0.21 |
0.29 |
n.v. |
|
protein furry homolog-like |
| 309264486 |
|
Fsip2 |
|
0 |
0 |
155 |
1064 |
0 |
|
n.v. |
n.v. |
-0.09 |
0.23 |
n.v. |
|
PREDICTED: fibrous sheath-interacting protein 2 |
| 31560699 |
|
Fstl1 |
|
0 |
0 |
0 |
0 |
90870 |
|
n.v. |
n.v. |
n.v. |
n.v. |
-7.89 |
|
follistatin-related protein 1 precursor |
| 18252784 |
|
Ftcd |
|
0 |
0 |
963 |
2750 |
0 |
|
n.v. |
n.v. |
-0.15 |
0.06 |
n.v. |
|
formimidoyltransferase-cyclodeaminase |
| 6753912 |
|
Fth1 |
|
85361 |
20124 |
10409 |
303447 |
11673 |
|
0.06 |
-0.08 |
-0.21 |
-0.01 |
0.14 |
|
ferritin heavy chain |
| 166851822 |
|
Fto |
|
0 |
79 |
0 |
115 |
34410 |
|
n.v. |
0.07 |
n.v. |
0.8 |
0.15 |
|
alpha-ketoglutarate-dependent dioxygenase FTO |
| 46877062 |
|
Ftsj1 |
|
0 |
0 |
0 |
246 |
0 |
|
n.v. |
n.v. |
n.v. |
0.15 |
n.v. |
|
Ftsj homolog |
| 84662730 |
|
Fubp1 |
|
18965 |
3294 |
22750 |
1514 |
43181 |
|
0.1 |
0.06 |
0 |
-0.38 |
-0.01 |
|
far upstream element-binding protein 1 |
| 224922832 |
|
Fubp3 |
|
0 |
870 |
33580 |
237 |
321 |
|
n.v. |
0.5 |
0.12 |
0.23 |
0.16 |
|
far upstream element (FUSE) binding protein 3 |
| 169808427 |
|
Fuca1 |
|
0 |
1457 |
294 |
0 |
0 |
|
n.v. |
0.07 |
-0.16 |
n.v. |
n.v. |
|
tissue alpha-L-fucosidase precursor |
| 31541791 |
|
Fuca2 |
|
384 |
643 |
234 |
0 |
2206 |
|
0.44 |
-0.15 |
-0.44 |
n.v. |
-0.1 |
|
plasma alpha-L-fucosidase precursor |
| 31981686 |
|
Fuk |
|
0 |
0 |
758 |
50480 |
20669 |
|
n.v. |
n.v. |
-0.03 |
0.14 |
-0.19 |
|
L-fucose kinase |
| 262050556 |
|
Fundc2 |
|
9794 |
4217 |
51 |
0 |
0 |
|
-0.7 |
-0.13 |
-0.22 |
n.v. |
n.v. |
|
FUN14 domain-containing protein 2 |
| 124377998 |
|
Fuom |
|
0 |
0 |
0 |
491 |
0 |
|
n.v. |
n.v. |
n.v. |
0.45 |
n.v. |
|
fucose mutarotase |
| 20982845 |
|
Fus |
|
59238 |
7323 |
28532 |
30745 |
278 |
|
-0.14 |
0.12 |
0.04 |
0.03 |
-0.28 |
|
RNA-binding protein FUS |
| 31560444 |
|
Fut8 |
|
0 |
0 |
124 |
0 |
0 |
|
n.v. |
n.v. |
-0.45 |
n.v. |
n.v. |
|
alpha-(1,6)-fucosyltransferase isoform 1 |
| 6679863 |
|
Fxn |
|
2911 |
1582 |
0 |
0 |
0 |
|
0.04 |
-0.28 |
n.v. |
n.v. |
n.v. |
|
frataxin, mitochondrial precursor |
| 17998694 |
|
Fxr1 |
|
0 |
8409 |
69588 |
32955 |
0 |
|
n.v. |
0.27 |
0.19 |
0.17 |
n.v. |
|
fragile X mental retardation syndrome-related protein 1
isoform 3 |
| 163954941 |
|
Fxr1 |
|
0 |
9087 |
80222 |
42278 |
64 |
|
n.v. |
0.26 |
0.16 |
0.14 |
-1.49 |
|
fragile X mental retardation syndrome-related protein 1
isoform 1 |
| 163954943 |
|
Fxr1 |
|
0 |
8413 |
76240 |
40183 |
64 |
|
n.v. |
0.32 |
0.17 |
0.17 |
-1.49 |
|
fragile X mental retardation syndrome-related protein 1
isoform 2 |
| 83921589 |
|
Fxr2 |
|
0 |
889 |
49030 |
8808 |
0 |
|
n.v. |
0.52 |
0.16 |
0.19 |
n.v. |
|
fragile X mental retardation syndrome-related protein
2 |
| 16554570 |
|
Fxyd2 |
|
2563 |
601 |
1055 |
98 |
0 |
|
0.54 |
0.35 |
0.4 |
0.57 |
n.v. |
|
sodium/potassium-transporting ATPase subunit gamma
isoform a |
| 16554572 |
|
Fxyd2 |
|
2563 |
601 |
1055 |
98 |
0 |
|
0.54 |
0.35 |
0.4 |
0.57 |
n.v. |
|
sodium/potassium-transporting ATPase subunit gamma
isoform b |
| 16258807 |
|
Fxyd4 |
|
641 |
0 |
0 |
0 |
0 |
|
0.04 |
n.v. |
n.v. |
n.v. |
n.v. |
|
FXYD domain-containing ion transport regulator 4
precursor |
| 159131876 |
|
Fyco1 |
|
0 |
58 |
8716 |
1498 |
31229 |
|
n.v. |
-0.15 |
-0.15 |
0.2 |
-0.01 |
|
FYVE and coiled-coil domain-containing protein 1 |
| 171543837 |
|
Fyn |
|
2691 |
5068 |
10157 |
10936 |
44016 |
|
0.15 |
0.22 |
-0.11 |
-0.1 |
0.06 |
|
tyrosine-protein kinase Fyn isoform b |
| 171543841 |
|
Fyn |
|
2691 |
5068 |
10157 |
10936 |
44016 |
|
0.15 |
0.22 |
-0.11 |
-0.1 |
0.06 |
|
tyrosine-protein kinase Fyn isoform a |
| 226823218 |
|
Fyttd1 |
|
421 |
0 |
0 |
0 |
0 |
|
-0.22 |
n.v. |
n.v. |
n.v. |
n.v. |
|
UAP56-interacting factor isoform 2 |
| 31541947 |
|
Fyttd1 |
|
421 |
0 |
0 |
0 |
0 |
|
-0.22 |
n.v. |
n.v. |
n.v. |
n.v. |
|
UAP56-interacting factor isoform 1 |
| 7305075 |
|
G3bp1 |
|
28411 |
3591 |
132053 |
116014 |
0 |
|
-0.02 |
0.21 |
0.12 |
0.02 |
n.v. |
|
ras GTPase-activating protein-binding protein 1 |
| 124248570 |
|
G3bp2 |
|
11148 |
764 |
52270 |
44497 |
0 |
|
-0.18 |
0.28 |
0.16 |
0.1 |
n.v. |
|
ras GTPase-activating protein-binding protein 2 isoform
b |
| 31982757 |
|
G3bp2 |
|
11148 |
764 |
59313 |
44497 |
0 |
|
-0.18 |
0.28 |
0.16 |
0.1 |
n.v. |
|
ras GTPase-activating protein-binding protein 2 isoform
a |
| 227330582 |
|
G6pd2 |
|
0 |
152 |
2508 |
8570 |
55004 |
|
n.v. |
0.55 |
-0.06 |
0.15 |
-0.03 |
|
glucose-6-phosphate 1-dehydrogenase 2 |
| 6996917 |
|
G6pdx |
|
1062 |
390 |
9924 |
24115 |
156648 |
|
-0.14 |
0.38 |
0.03 |
0.15 |
0.04 |
|
glucose-6-phosphate 1-dehydrogenase X |
| 226693367 |
|
Gaa |
|
9922 |
2085 |
963 |
98 |
6811 |
|
0 |
-0.03 |
-0.08 |
-0.13 |
0.04 |
|
lysosomal alpha-glucosidase precursor |
| 31542871 |
|
Gab1 |
|
0 |
0 |
0 |
0 |
3352 |
|
n.v. |
n.v. |
n.v. |
n.v. |
-0.36 |
|
GRB2-associated-binding protein 1 |
| 9789961 |
|
Gabarap |
|
0 |
0 |
0 |
0 |
5719 |
|
n.v. |
n.v. |
n.v. |
n.v. |
0.18 |
|
gamma-aminobutyric acid receptor-associated protein |
| 10181206 |
|
Gabarapl1 |
|
0 |
0 |
9 |
0 |
5719 |
|
n.v. |
n.v. |
0.34 |
n.v. |
0.18 |
|
gamma-aminobutyric acid receptor-associated protein-like
1 |
| 31542873 |
|
Gabarapl2 |
|
0 |
369 |
278 |
0 |
10024 |
|
n.v. |
-1.07 |
-0.97 |
n.v. |
0.27 |
|
gamma-aminobutyric acid receptor-associated protein-like
2 |
| 34328119 |
|
Gabpa |
|
0 |
0 |
335 |
426 |
23036 |
|
n.v. |
n.v. |
-0.02 |
0.15 |
0.06 |
|
GA-binding protein alpha chain |
| 407728605 |
|
Gabpb1 |
|
0 |
0 |
0 |
0 |
942 |
|
n.v. |
n.v. |
n.v. |
n.v. |
0.14 |
|
GA-binding protein subunit beta-1 isoform d |
| 46575942 |
|
Gabpb1 |
|
0 |
0 |
0 |
0 |
942 |
|
n.v. |
n.v. |
n.v. |
n.v. |
0.14 |
|
GA-binding protein subunit beta-1 isoform a |
| 6678980 |
|
Gadd45b |
|
0 |
0 |
179 |
0 |
0 |
|
n.v. |
n.v. |
0.21 |
n.v. |
n.v. |
|
growth arrest and DNA damage-inducible protein GADD45
beta |
| 269315840 |
|
Gadd45gip1 |
|
696 |
1503 |
0 |
0 |
0 |
|
-0.19 |
-0.01 |
n.v. |
n.v. |
n.v. |
|
growth arrest and DNA damage-inducible
proteins-interacting protein 1 |
| 51317387 |
|
Gak |
|
0 |
0 |
2008 |
0 |
3491 |
|
n.v. |
n.v. |
0.23 |
n.v. |
-0.11 |
|
cyclin-G-associated kinase |
| 93102411 |
|
Galc |
|
0 |
15533 |
11222 |
2865 |
1274 |
|
n.v. |
-0.07 |
-0.29 |
-3.8 |
0.29 |
|
galactocerebrosidase precursor |
| 30409988 |
|
Gale |
|
0 |
0 |
0 |
0 |
15229 |
|
n.v. |
n.v. |
n.v. |
n.v. |
0.13 |
|
UDP-glucose 4-epimerase |
| 93102413 |
|
Galk1 |
|
0 |
255 |
15761 |
4109 |
241178 |
|
n.v. |
-0.07 |
-0.11 |
0.03 |
-0.02 |
|
galactokinase |
| 30424748 |
|
Galk2 |
|
0 |
541 |
1128 |
0 |
8107 |
|
n.v. |
0.23 |
0.04 |
n.v. |
0.01 |
|
N-acetylgalactosamine kinase |
| 28892785 |
|
Galm |
|
0 |
0 |
344 |
0 |
20926 |
|
n.v. |
n.v. |
0.18 |
n.v. |
0.06 |
|
aldose 1-epimerase |
| 302370951 |
|
Galns |
|
0 |
2004 |
1 |
0 |
0 |
|
n.v. |
-0.11 |
-0.33 |
n.v. |
n.v. |
|
N-acetylgalactosamine-6-sulfatase isoform 2 precursor |
| 171184398 |
|
Galns |
|
494 |
3945 |
319 |
0 |
610 |
|
-0.23 |
-0.26 |
-0.32 |
n.v. |
-0.24 |
|
N-acetylgalactosamine-6-sulfatase isoform 1 precursor |
| 237874259 |
|
Galnt1 |
|
0 |
1597 |
23 |
0 |
0 |
|
n.v. |
-0.03 |
-0.86 |
n.v. |
n.v. |
|
polypeptide N-acetylgalactosaminyltransferase 1 |
| 76677928 |
|
Galnt13 |
|
0 |
1597 |
0 |
0 |
0 |
|
n.v. |
-0.03 |
n.v. |
n.v. |
n.v. |
|
polypeptide N-acetylgalactosaminyltransferase 13 |
| 46877109 |
|
Galnt2 |
|
0 |
3380 |
3228 |
0 |
0 |
|
n.v. |
-0.02 |
-0.35 |
n.v. |
n.v. |
|
polypeptide N-acetylgalactosaminyltransferase 2 precursor |
| 162951828 |
|
Galnt3 |
|
15890 |
24246 |
5875 |
589 |
0 |
|
-0.02 |
-0.05 |
-0.24 |
0.3 |
n.v. |
|
polypeptide N-acetylgalactosaminyltransferase 3 |
| 7657112 |
|
Galnt4 |
|
0 |
0 |
132 |
0 |
0 |
|
n.v. |
n.v. |
0.01 |
n.v. |
n.v. |
|
polypeptide N-acetylgalactosaminyltransferase 4 |
| 269784707 |
|
Galnt7 |
|
0 |
324 |
0 |
0 |
0 |
|
n.v. |
-1.12 |
n.v. |
n.v. |
n.v. |
|
N-acetylgalactosaminyltransferase 7 isoform 1 |
| 269784709 |
|
Galnt7 |
|
0 |
324 |
0 |
0 |
0 |
|
n.v. |
-1.12 |
n.v. |
n.v. |
n.v. |
|
N-acetylgalactosaminyltransferase 7 isoform 2 |
| 6753944 |
|
Gamt |
|
0 |
0 |
23 |
0 |
1874 |
|
n.v. |
n.v. |
-0.35 |
n.v. |
-0.4 |
|
guanidinoacetate N-methyltransferase |
| 6679891 |
|
Ganab |
|
440498 |
63809 |
42414 |
8071 |
72289 |
|
0.08 |
-0.25 |
-0.2 |
-0.34 |
-0.39 |
|
neutral alpha-glucosidase AB |
| 6679939 |
|
Gapdhs |
|
96216 |
51608 |
168747 |
242219 |
273531 |
|
-0.06 |
0.05 |
-0.08 |
0.13 |
0.01 |
|
glyceraldehyde-3-phosphate dehydrogenase,
testis-specific |
| 40254514 |
|
Gapvd1 |
|
0 |
0 |
0 |
1989 |
2474 |
|
n.v. |
n.v. |
n.v. |
0.1 |
0.55 |
|
GTPase-activating protein and VPS9 domain-containing
protein 1 |
| 13384710 |
|
Gar1 |
|
0 |
0 |
0 |
1130 |
0 |
|
n.v. |
n.v. |
n.v. |
0.15 |
n.v. |
|
H/ACA ribonucleoprotein complex subunit 1 |
| 93102417 |
|
Gars |
|
1007 |
5083 |
7283 |
40388 |
67695 |
|
-0.2 |
0.04 |
0.08 |
0.22 |
0.12 |
|
glycine--tRNA ligase |
| 93102415 |
|
Gart |
|
1702 |
1607 |
6974 |
38767 |
179084 |
|
0.63 |
0.21 |
-0.03 |
0.21 |
0.01 |
|
trifunctional purine biosynthetic protein
adenosine-3 |
| 6679943 |
|
Gas2 |
|
0 |
0 |
0 |
24082 |
0 |
|
n.v. |
n.v. |
n.v. |
-0.07 |
n.v. |
|
growth arrest-specific protein 2 |
| 120407058 |
|
Gas2l3 |
|
0 |
0 |
0 |
24082 |
0 |
|
n.v. |
n.v. |
n.v. |
-0.07 |
n.v. |
|
GAS2-like protein 3 |
| 21314854 |
|
Gatad2b |
|
4503 |
524 |
17863 |
499 |
54 |
|
-0.03 |
0.32 |
0.19 |
-0.9 |
-0.71 |
|
transcriptional repressor p66-beta |
| 116734815 |
|
Gba |
|
10654 |
0 |
0 |
0 |
0 |
|
0.16 |
n.v. |
n.v. |
n.v. |
n.v. |
|
glucosylceramidase isoform 2 precursor |
| 116734815;6679955 |
|
Gba |
|
0 |
0 |
20564 |
0 |
0 |
|
n.v. |
n.v. |
-0.22 |
n.v. |
n.v. |
|
glucosylceramidase isoform 2 precursor |
| 6679955;116734815 |
|
Gba |
|
0 |
17719 |
0 |
1252 |
0 |
|
n.v. |
-0.08 |
n.v. |
-0.41 |
n.v. |
|
glucosylceramidase isoform 1 precursor |
| 160298168 |
|
Gbas |
|
4448 |
6584 |
0 |
0 |
0 |
|
0.05 |
-0.13 |
n.v. |
n.v. |
n.v. |
|
protein NipSnap homolog 2 |
| 17975508 |
|
Gbe1 |
|
0 |
1388 |
1816 |
606 |
11780 |
|
n.v. |
0.33 |
0.01 |
1.1 |
0.04 |
|
1,4-alpha-glucan-branching enzyme |
| 52138536 |
|
Gbf1 |
|
0 |
2085 |
1226 |
22952 |
8011 |
|
n.v. |
0.16 |
-0.02 |
-0.04 |
0.03 |
|
Golgi-specific brefeldin A-resistance guanine nucleotide
exchange factor 1 |
| 116812914 |
|
Gbp10 |
|
0 |
0 |
0 |
0 |
2892 |
|
n.v. |
n.v. |
n.v. |
n.v. |
0.28 |
|
guanylate-binding protein 10 |
| 225007564 |
|
Gbp11 |
|
0 |
0 |
0 |
0 |
2270 |
|
n.v. |
n.v. |
n.v. |
n.v. |
0.07 |
|
guanylate binding protein 11 |
| 134053871 |
|
Gbp3 |
|
0 |
0 |
0 |
0 |
96 |
|
n.v. |
n.v. |
n.v. |
n.v. |
0.42 |
|
guanylate-binding protein 4 |
| 126157521 |
|
Gbp4 |
|
0 |
1541 |
0 |
0 |
2185 |
|
n.v. |
-0.07 |
n.v. |
n.v. |
0.07 |
|
macrophage activation 2 isoform 2 |
| 365192570 |
|
Gbp4 |
|
0 |
1541 |
0 |
0 |
2185 |
|
n.v. |
-0.07 |
n.v. |
n.v. |
0.07 |
|
macrophage activation 2 isoform 1 |
| 170650637 |
|
Gbp6 |
|
0 |
0 |
0 |
0 |
2892 |
|
n.v. |
n.v. |
n.v. |
n.v. |
0.28 |
|
guanylate binding protein 6 |
| 134031974 |
|
Gbp7 |
|
0 |
0 |
0 |
0 |
96 |
|
n.v. |
n.v. |
n.v. |
n.v. |
0.42 |
|
guanylate binding protein 7 |
| 83776551 |
|
Gbp8 |
|
0 |
0 |
0 |
0 |
2806 |
|
n.v. |
n.v. |
n.v. |
n.v. |
0.17 |
|
guanylate binding protein 8 |
| 27370144 |
|
Gbp9 |
|
0 |
0 |
0 |
0 |
5216 |
|
n.v. |
n.v. |
n.v. |
n.v. |
0.23 |
|
guanylate binding protein family, member 9 |
| 21704030 |
|
Gca |
|
0 |
234 |
1097 |
393 |
7036 |
|
n.v. |
0.17 |
-0.08 |
-0.07 |
0.29 |
|
grancalcin |
| 240120117 |
|
Gcat |
|
9556 |
9108 |
22 |
0 |
343 |
|
0.05 |
-0.11 |
-0.46 |
n.v. |
-0.13 |
|
2-amino-3-ketobutyrate coenzyme A ligase, mitochondrial
isoform a |
| 240120119 |
|
Gcat |
|
8219 |
8120 |
22 |
0 |
343 |
|
-0.03 |
-0.1 |
-0.46 |
n.v. |
-0.13 |
|
2-amino-3-ketobutyrate coenzyme A ligase, mitochondrial
isoform b |
| 268370067 |
|
Gcc1 |
|
0 |
15 |
0 |
90 |
1542 |
|
n.v. |
0.05 |
n.v. |
0.15 |
-0.08 |
|
GRIP and coiled-coil domain-containing protein 1 |
| 61742806 |
|
Gcc2 |
|
10050 |
2257 |
1674 |
2456 |
3213 |
|
0.04 |
-0.27 |
-0.27 |
-0.37 |
0.06 |
|
GRIP and coiled-coil domain-containing protein 2 |
| 390190196 |
|
Gcdh |
|
0 |
1718 |
404 |
0 |
0 |
|
n.v. |
-0.34 |
0.53 |
n.v. |
n.v. |
|
glutaryl-CoA dehydrogenase, mitochondrial |
| 33468897 |
|
Gclc |
|
0 |
787 |
1883 |
0 |
14758 |
|
n.v. |
0.22 |
0.16 |
n.v. |
0.08 |
|
glutamate--cysteine ligase catalytic subunit |
| 6680019 |
|
Gclm |
|
0 |
1647 |
704 |
115 |
40825 |
|
n.v. |
0.17 |
0.1 |
-0.79 |
0.21 |
|
glutamate--cysteine ligase regulatory subunit |
| 112807186 |
|
Gcn1l1 |
|
8000 |
18539 |
131617 |
175425 |
81874 |
|
-0.11 |
0.04 |
0.02 |
-0.01 |
-0.06 |
|
GCN1 general control of amino-acid synthesis 1-like 1 |
| 210147589 |
|
Gcnt1 |
|
0 |
626 |
0 |
0 |
0 |
|
n.v. |
0.01 |
n.v. |
n.v. |
n.v. |
|
beta-1,3-galactosyl-O-glycosyl-glycoprotein
beta-1,6-N-acetylglucosaminyltransferase |
| 459352743 |
|
Gcnt1 |
|
0 |
119 |
0 |
0 |
0 |
|
n.v. |
0.01 |
n.v. |
n.v. |
n.v. |
|
beta-1,3-galactosyl-O-glycosyl-glycoprotein
beta-1,6-N-acetylglucosaminyltransferase |
| 13386066 |
|
Gcsh |
|
1574 |
1647 |
0 |
0 |
0 |
|
1.06 |
0.04 |
n.v. |
n.v. |
n.v. |
|
glycine cleavage system H protein, mitochondrial
precursor |
| 22094097 |
|
Gdap2 |
|
0 |
0 |
398 |
1302 |
0 |
|
n.v. |
n.v. |
0.06 |
-1.18 |
n.v. |
|
ganglioside-induced differentiation-associated protein 2 |
| 9625018 |
|
Gde1 |
|
0 |
223 |
0 |
0 |
0 |
|
n.v. |
-0.27 |
n.v. |
n.v. |
n.v. |
|
glycerophosphodiester phosphodiesterase 1 |
| 75677587 |
|
Gdf3 |
|
0 |
0 |
0 |
24082 |
0 |
|
n.v. |
n.v. |
n.v. |
-0.07 |
n.v. |
|
growth/differentiation factor 3 precursor |
| 33859560 |
|
Gdi1 |
|
17684 |
15861 |
33626 |
72205 |
641660 |
|
0.01 |
0.19 |
0 |
0.18 |
0.03 |
|
rab GDP dissociation inhibitor alpha |
| 116089273 |
|
Gdi2 |
|
63577 |
37179 |
68150 |
235040 |
861173 |
|
0.13 |
0.2 |
0.02 |
0.14 |
0.04 |
|
rab GDP dissociation inhibitor beta |
| 23956140 |
|
Gdpd1 |
|
1757 |
4044 |
1043 |
0 |
0 |
|
-0.31 |
-0.43 |
-0.43 |
n.v. |
n.v. |
|
glycerophosphodiester phosphodiesterase domain-containing
protein 1 |
| 110431346 |
|
Gdpd3 |
|
4851 |
5499 |
1926 |
1531 |
0 |
|
0.23 |
-0.08 |
-0.31 |
-0.56 |
n.v. |
|
glycerophosphodiester phosphodiesterase domain-containing
protein 3 |
| 153792166 |
|
Gemin2 |
|
0 |
0 |
187 |
1072 |
0 |
|
n.v. |
n.v. |
-0.25 |
0.19 |
n.v. |
|
gem-associated protein 2 |
| 262331526 |
|
Gemin4 |
|
0 |
0 |
1168 |
11894 |
0 |
|
n.v. |
n.v. |
0.26 |
0.03 |
n.v. |
|
gemin 4 |
| 262263297 |
|
Gemin5 |
|
0 |
0 |
1952 |
6106 |
0 |
|
n.v. |
n.v. |
-0.08 |
0.53 |
n.v. |
|
gem-associated protein 5 isoform 2 |
| 262263299 |
|
Gemin5 |
|
0 |
0 |
1952 |
6106 |
0 |
|
n.v. |
n.v. |
-0.08 |
0.53 |
n.v. |
|
gem-associated protein 5 isoform 1 |
| 262263301 |
|
Gemin5 |
|
0 |
0 |
1952 |
6106 |
0 |
|
n.v. |
n.v. |
-0.08 |
0.53 |
n.v. |
|
gem-associated protein 5 isoform 3 |
| 262263303 |
|
Gemin5 |
|
0 |
0 |
1596 |
6106 |
0 |
|
n.v. |
n.v. |
-0.01 |
0.53 |
n.v. |
|
gem-associated protein 5 isoform 4 |
| 21313050 |
|
Gemin6 |
|
0 |
17 |
138 |
180 |
86 |
|
n.v. |
0.64 |
0 |
0.17 |
-0.24 |
|
gem-associated protein 6 |
| 21312380 |
|
Gemin7 |
|
0 |
0 |
0 |
1072 |
0 |
|
n.v. |
n.v. |
n.v. |
0.04 |
n.v. |
|
gem-associated protein 7 |
| 254281178 |
|
Get4 |
|
934 |
1221 |
778 |
17403 |
9296 |
|
0.03 |
0.1 |
0.14 |
0.19 |
-0.06 |
|
Golgi to ER traffic protein 4 homolog isoform 2 |
| 27229052 |
|
Get4 |
|
934 |
1221 |
778 |
18769 |
9478 |
|
0.03 |
0.1 |
0.14 |
0.22 |
-0.02 |
|
Golgi to ER traffic protein 4 homolog isoform 1 |
| 196115327 |
|
Gfap |
|
1886 |
0 |
0 |
0 |
0 |
|
-0.38 |
n.v. |
n.v. |
n.v. |
n.v. |
|
glial fibrillary acidic protein isoform 1 |
| 84000448 |
|
Gfap |
|
1886 |
0 |
0 |
0 |
0 |
|
-0.38 |
n.v. |
n.v. |
n.v. |
n.v. |
|
glial fibrillary acidic protein isoform 2 |
| 46909575 |
|
Gfer |
|
0 |
73 |
0 |
0 |
0 |
|
n.v. |
-0.29 |
n.v. |
n.v. |
n.v. |
|
FAD-linked sulfhydryl oxidase ALR |
| 170650599 |
|
Gfm1 |
|
2764 |
10688 |
0 |
0 |
0 |
|
0.1 |
-0.12 |
n.v. |
n.v. |
n.v. |
|
elongation factor G, mitochondrial |
| 225690549 |
|
Gfm2 |
|
0 |
280 |
0 |
0 |
0 |
|
n.v. |
-0.08 |
n.v. |
n.v. |
n.v. |
|
ribosome-releasing factor 2, mitochondrial isoform 1 |
| 225690556 |
|
Gfm2 |
|
0 |
280 |
0 |
0 |
0 |
|
n.v. |
-0.08 |
n.v. |
n.v. |
n.v. |
|
ribosome-releasing factor 2, mitochondrial isoform 2 |
| 407228375 |
|
Gfm2 |
|
0 |
280 |
0 |
0 |
0 |
|
n.v. |
-0.08 |
n.v. |
n.v. |
n.v. |
|
ribosome-releasing factor 2, mitochondrial isoform 3 |
| 407228398 |
|
Gfm2 |
|
0 |
280 |
0 |
0 |
0 |
|
n.v. |
-0.08 |
n.v. |
n.v. |
n.v. |
|
ribosome-releasing factor 2, mitochondrial isoform 4 |
| 21312610 |
|
Gfod2 |
|
0 |
0 |
361 |
2366 |
0 |
|
n.v. |
n.v. |
0.09 |
0.03 |
n.v. |
|
glucose-fructose oxidoreductase domain-containing protein
2 precursor |
| 7305085 |
|
Gfpt1 |
|
3661 |
795 |
5201 |
70183 |
22083 |
|
-0.03 |
0.4 |
-0.04 |
0.17 |
0.1 |
|
glutamine--fructose-6-phosphate aminotransferase
[isomerizing] 1 |
| 7305087 |
|
Gfpt2 |
|
0 |
0 |
0 |
8873 |
1831 |
|
n.v. |
n.v. |
n.v. |
0.13 |
-0.04 |
|
glucosamine--fructose-6-phosphate aminotransferase
[isomerizing] 2 |
| 22122347 |
|
Gga1 |
|
0 |
276 |
1602 |
0 |
3534 |
|
n.v. |
0.26 |
0.17 |
n.v. |
0.26 |
|
ADP-ribosylation factor-binding protein GGA1 |
| 21703924 |
|
Ggact |
|
0 |
0 |
42 |
0 |
1071 |
|
n.v. |
n.v. |
0.19 |
n.v. |
0.3 |
|
gamma-glutamylaminecyclotransferase |
| 21311849 |
|
Ggct |
|
0 |
0 |
78 |
0 |
7068 |
|
n.v. |
n.v. |
0.57 |
n.v. |
0.21 |
|
gamma-glutamylcyclotransferase |
| 9790009 |
|
Ggcx |
|
0 |
19 |
0 |
0 |
0 |
|
n.v. |
-0.82 |
n.v. |
n.v. |
n.v. |
|
vitamin K-dependent gamma-carboxylase |
| 6806915 |
|
Ggps1 |
|
0 |
0 |
0 |
868 |
5601 |
|
n.v. |
n.v. |
n.v. |
0.27 |
0.02 |
|
geranylgeranyl pyrophosphate synthase |
| 6679995 |
|
Ggt1 |
|
0 |
0 |
114 |
0 |
0 |
|
n.v. |
n.v. |
-0.05 |
n.v. |
n.v. |
|
gamma-glutamyltranspeptidase 1 precursor |
| 6679997 |
|
Gh |
|
2416 |
0 |
0 |
0 |
0 |
|
-0.11 |
n.v. |
n.v. |
n.v. |
n.v. |
|
somatotropin precursor |
| 17505218 |
|
Ghitm |
|
0 |
1073 |
237 |
0 |
0 |
|
n.v. |
-0.25 |
-0.09 |
n.v. |
n.v. |
|
growth hormone-inducible transmembrane protein |
| 254939696 |
|
Gid4 |
|
0 |
0 |
0 |
524 |
0 |
|
n.v. |
n.v. |
n.v. |
-0.07 |
n.v. |
|
glucose-induced degradation protein 4 homolog |
| 58037443 |
|
Gid8 |
|
0 |
0 |
6 |
2816 |
43 |
|
n.v. |
n.v. |
0.05 |
-0.16 |
0.14 |
|
glucose-induced degradation protein 8 homolog |
| 159032014 |
|
Gigyf2 |
|
0 |
58 |
17228 |
0 |
0 |
|
n.v. |
0.68 |
0.35 |
n.v. |
n.v. |
|
PERQ amino acid-rich with GYF domain-containing protein 2
isoform a |
| 159032016 |
|
Gigyf2 |
|
0 |
58 |
17228 |
0 |
0 |
|
n.v. |
0.68 |
0.35 |
n.v. |
n.v. |
|
PERQ amino acid-rich with GYF domain-containing protein 2
isoform b |
| 254553278 |
|
Gins1 |
|
0 |
21 |
138 |
769 |
3973 |
|
n.v. |
0.52 |
0.06 |
0.24 |
0.03 |
|
DNA replication complex GINS protein PSF1 isoform 1 |
| 254553280 |
|
Gins1 |
|
0 |
21 |
138 |
769 |
3973 |
|
n.v. |
0.52 |
0.06 |
0.24 |
0.03 |
|
DNA replication complex GINS protein PSF1 isoform 2 |
| 124249060 |
|
Gins2 |
|
0 |
0 |
25 |
0 |
75 |
|
n.v. |
n.v. |
0.02 |
n.v. |
0.65 |
|
DNA replication complex GINS protein PSF2 |
| 21313504 |
|
Gins3 |
|
0 |
0 |
28 |
0 |
14115 |
|
n.v. |
n.v. |
0.54 |
n.v. |
0.15 |
|
DNA replication complex GINS protein PSF3 |
| 13195660 |
|
Gins4 |
|
0 |
121 |
54 |
0 |
11727 |
|
n.v. |
-1.16 |
-0.63 |
n.v. |
-0.06 |
|
DNA replication complex GINS protein SLD5 |
| 9055336 |
|
Gipc1 |
|
0 |
150 |
4928 |
12598 |
57146 |
|
n.v. |
0.02 |
-0.1 |
0.36 |
-0.1 |
|
PDZ domain-containing protein GIPC1 |
| 8394258 |
|
Gipc2 |
|
6737 |
7016 |
9772 |
29755 |
26367 |
|
0.17 |
0.24 |
0.09 |
0.28 |
0.12 |
|
PDZ domain-containing protein GIPC2 |
| 22507363 |
|
Gipc3 |
|
0 |
0 |
0 |
0 |
6137 |
|
n.v. |
n.v. |
n.v. |
n.v. |
0.27 |
|
PDZ domain-containing protein GIPC3 |
| 51921285 |
|
Git1 |
|
0 |
0 |
985 |
9250 |
675 |
|
n.v. |
n.v. |
0.08 |
-0.43 |
-0.51 |
|
ARF GTPase-activating protein GIT1 |
| 116517290 |
|
Git2 |
|
0 |
0 |
20 |
606 |
0 |
|
n.v. |
n.v. |
0.73 |
0.29 |
n.v. |
|
ARF GTPase-activating protein GIT2 isoform 2 |
| 116517295 |
|
Git2 |
|
0 |
0 |
20 |
606 |
0 |
|
n.v. |
n.v. |
0.73 |
0.29 |
n.v. |
|
ARF GTPase-activating protein GIT2 isoform 3 |
| 116517297 |
|
Git2 |
|
0 |
0 |
20 |
606 |
0 |
|
n.v. |
n.v. |
0.73 |
0.29 |
n.v. |
|
ARF GTPase-activating protein GIT2 isoform 1 |
| 6754000 |
|
Gk2 |
|
0 |
0 |
0 |
0 |
1157 |
|
n.v. |
n.v. |
n.v. |
n.v. |
0.09 |
|
glycerol kinase 2 |
| 9789999 |
|
Gkap1 |
|
0 |
0 |
142 |
0 |
1531 |
|
n.v. |
n.v. |
-0.25 |
n.v. |
-0.04 |
|
G kinase-anchoring protein 1 |
| 133778924 |
|
Gla |
|
0 |
1935 |
13 |
0 |
643 |
|
n.v. |
-0.51 |
-0.49 |
n.v. |
-0.11 |
|
alpha-galactosidase A |
| 6753190 |
|
Glb1 |
|
5290 |
6081 |
2305 |
3020 |
0 |
|
0.12 |
-0.19 |
-0.36 |
-0.34 |
n.v. |
|
beta-galactosidase precursor |
| 65301488 |
|
Glce |
|
0 |
447 |
0 |
0 |
0 |
|
n.v. |
-0.8 |
n.v. |
n.v. |
n.v. |
|
D-glucuronyl C5-epimerase |
| 58037369 |
|
Gle1 |
|
0 |
0 |
80 |
4035 |
0 |
|
n.v. |
n.v. |
0.21 |
0.19 |
n.v. |
|
nucleoporin GLE1 |
| 6677905 |
|
Glg1 |
|
45619 |
6338 |
15100 |
0 |
0 |
|
-0.05 |
-0.31 |
-0.38 |
n.v. |
n.v. |
|
Golgi apparatus protein 1 precursor |
| 47059151 |
|
Glipr2 |
|
0 |
539 |
417 |
0 |
0 |
|
n.v. |
0.15 |
0.1 |
n.v. |
n.v. |
|
Golgi-associated plant pathogenesis-related protein
1 |
| 239985596 |
|
Glmn |
|
0 |
0 |
3 |
0 |
107 |
|
n.v. |
n.v. |
1.32 |
n.v. |
0.03 |
|
glomulin isoform a |
| 239985605 |
|
Glmn |
|
0 |
0 |
3 |
0 |
107 |
|
n.v. |
n.v. |
1.32 |
n.v. |
0.03 |
|
glomulin isoform b |
| 165932331 |
|
Glo1 |
|
0 |
1728 |
2299 |
1735 |
90431 |
|
n.v. |
0.41 |
0.06 |
0.11 |
0.12 |
|
lactoylglutathione lyase |
| 255003777 |
|
Glod4 |
|
4082 |
6843 |
9987 |
1187 |
91673 |
|
-0.11 |
0.12 |
0.02 |
-0.39 |
0.12 |
|
glyoxalase domain-containing protein 4 |
| 31981458 |
|
Glrx |
|
55 |
534 |
420 |
0 |
1060 |
|
-0.18 |
0.2 |
0.04 |
n.v. |
0.36 |
|
glutaredoxin-1 |
| 31981269 |
|
Glrx3 |
|
0 |
75 |
915 |
2005 |
33146 |
|
n.v. |
0.15 |
-0.03 |
-0.16 |
0.1 |
|
glutaredoxin-3 |
| 21312153 |
|
Glrx5 |
|
14645 |
996 |
0 |
0 |
278 |
|
0.01 |
-0.28 |
n.v. |
n.v. |
-0.26 |
|
glutaredoxin-related protein 5, mitochondrial |
| 124487313 |
|
Gls |
|
12338 |
14141 |
424 |
90 |
675 |
|
0.24 |
-0.13 |
0.34 |
-1.73 |
-0.1 |
|
glutaminase kidney isoform, mitochondrial isoform 1 |
| 164607135 |
|
Gls |
|
12979 |
12611 |
424 |
90 |
675 |
|
0.23 |
-0.13 |
0.34 |
-1.73 |
-0.1 |
|
glutaminase kidney isoform, mitochondrial isoform 2 |
| 170784829 |
|
Glt25d1 |
|
0 |
2586 |
183 |
0 |
0 |
|
n.v. |
-0.33 |
-0.18 |
n.v. |
n.v. |
|
procollagen galactosyltransferase 1 precursor |
| 31560404 |
|
Gltp |
|
0 |
4313 |
8078 |
10101 |
18570 |
|
n.v. |
0.12 |
0.02 |
0.13 |
0.02 |
|
glycolipid transfer protein |
| 228480230 |
|
Gltscr2 |
|
0 |
0 |
0 |
205 |
0 |
|
n.v. |
n.v. |
n.v. |
-0.43 |
n.v. |
|
glioma tumor suppressor candidate region gene 2 |
| 6680027 |
|
Glud1 |
|
278050 |
104075 |
2338 |
22592 |
10752 |
|
0.01 |
-0.19 |
-0.44 |
-0.24 |
-0.4 |
|
glutamate dehydrogenase 1, mitochondrial precursor |
| 119392066 |
|
Glyr1 |
|
13730 |
0 |
0 |
0 |
0 |
|
-0.7 |
n.v. |
n.v. |
n.v. |
n.v. |
|
putative oxidoreductase GLYR1 isoform 2 |
| 119392074 |
|
Glyr1 |
|
13730 |
0 |
0 |
0 |
0 |
|
-0.7 |
n.v. |
n.v. |
n.v. |
n.v. |
|
putative oxidoreductase GLYR1 isoform 1 |
| 309269122 |
|
Gm10015 |
|
348 |
3810 |
5856 |
7318 |
35063 |
|
0.19 |
0.16 |
0.1 |
-0.02 |
0.06 |
|
PREDICTED: ubiquitin-conjugating enzyme E2 L3-like |
| 407261621 |
|
Gm10015 |
|
348 |
3810 |
5856 |
7318 |
35063 |
|
0.19 |
0.16 |
0.1 |
-0.02 |
0.06 |
|
PREDICTED: ubiquitin-conjugating enzyme E2 L3-like |
| 309262801 |
|
Gm10029 |
|
5345 |
8183 |
80667 |
186402 |
139 |
|
-0.72 |
0.16 |
0.26 |
-0.08 |
-0.49 |
|
PREDICTED: 60S ribosomal protein L35a-like |
| 309266791 |
|
Gm10045 |
|
73096 |
26511 |
63568 |
89272 |
0 |
|
-0.01 |
0.21 |
0.2 |
-0.15 |
n.v. |
|
PREDICTED: 60S ribosomal protein L21-like |
| 309270949 |
|
Gm10045 |
|
71979 |
39254 |
102103 |
320776 |
0 |
|
-0.01 |
0.11 |
0.2 |
-0.15 |
n.v. |
|
PREDICTED: 60S ribosomal protein L21-like |
| 309265470 |
|
Gm10051 |
|
19295 |
13408 |
73327 |
142715 |
0 |
|
0.03 |
0.13 |
0.22 |
-0.09 |
n.v. |
|
PREDICTED: 60S ribosomal protein L28-like |
| 149258678 |
|
Gm10063 |
|
59916 |
3238 |
53618 |
158972 |
1510 |
|
0 |
0.11 |
0.17 |
-0.12 |
0.09 |
|
PREDICTED: 40S ribosomal protein S12-like |
| 149251177 |
|
Gm10071 |
|
365022 |
43464 |
257487 |
497453 |
0 |
|
0.02 |
0.09 |
0.23 |
-0.22 |
n.v. |
|
PREDICTED: 60S ribosomal protein L13-like |
| 215490077 |
|
Gm10094 |
|
1263 |
0 |
489 |
278 |
0 |
|
0.07 |
n.v. |
0.08 |
-0.15 |
n.v. |
|
Sin3-associated polypeptide 18-like |
| 309262120 |
|
Gm10145 |
|
952 |
3463 |
5542 |
7744 |
34784 |
|
-0.19 |
0.14 |
0.13 |
0.01 |
0.13 |
|
PREDICTED: ubiquitin-conjugating enzyme E2 L3-like |
| 309265879 |
|
Gm10166 |
|
184360 |
21412 |
89361 |
260923 |
0 |
|
0.02 |
0.2 |
0.29 |
-0.14 |
n.v. |
|
PREDICTED: 60S ribosomal protein L17-like |
| 407263363 |
|
Gm10166 |
|
184360 |
21412 |
89361 |
276787 |
0 |
|
0.02 |
0.2 |
0.29 |
-0.14 |
n.v. |
|
PREDICTED: 60S ribosomal protein L17-like isoform 2 |
| 309265700 |
|
Gm10224 |
|
56163 |
31824 |
44099 |
122235 |
0 |
|
0.18 |
0.11 |
0.18 |
0.03 |
n.v. |
|
PREDICTED: 60S ribosomal protein L15-like |
| 407262232 |
|
Gm10237 |
|
5345 |
8183 |
75301 |
186402 |
139 |
|
-0.72 |
0.16 |
0.18 |
-0.08 |
-0.49 |
|
PREDICTED: 60S ribosomal protein L35a-like |
| 407262068 |
|
Gm10257 |
|
3752513 |
39673 |
75553 |
374301 |
19995 |
|
-0.07 |
-0.22 |
-0.42 |
-0.34 |
-0.7 |
|
PREDICTED: histone H3.3-like |
| 309267049 |
|
Gm10294 |
|
190236 |
18715 |
102141 |
235613 |
0 |
|
0.01 |
0.14 |
0.28 |
-0.12 |
n.v. |
|
PREDICTED: 60S ribosomal protein L17-like |
| 407263409 |
|
Gm10294 |
|
112747 |
18161 |
64949 |
140628 |
0 |
|
-0.04 |
0.24 |
0.25 |
-0.15 |
n.v. |
|
PREDICTED: 60S ribosomal protein L17-like |
| 82995559 |
|
Gm10349 |
|
421 |
319 |
669 |
0 |
53601 |
|
0.33 |
-0.08 |
-0.14 |
n.v. |
-0.03 |
|
PREDICTED: nuclear transport factor 2-like |
| 309263288 |
|
Gm10362 |
|
184360 |
21412 |
87960 |
272145 |
0 |
|
0.02 |
0.2 |
0.28 |
-0.15 |
n.v. |
|
PREDICTED: 60S ribosomal protein L17-like |
| 309270584 |
|
Gm10362 |
|
184360 |
21412 |
87960 |
272325 |
0 |
|
0.02 |
0.2 |
0.28 |
-0.16 |
n.v. |
|
PREDICTED: 60S ribosomal protein L17-like |
| 82902507 |
|
Gm10420 |
|
144563 |
44902 |
202304 |
767708 |
0 |
|
0.02 |
0.08 |
0.2 |
-0.17 |
n.v. |
|
PREDICTED: 40S ribosomal protein S2-like isoform 1 |
| 169808401 |
|
Gm10639 |
|
0 |
0 |
0 |
0 |
1788 |
|
n.v. |
n.v. |
n.v. |
n.v. |
0.19 |
|
uncharacterized protein LOC100042314 |
| 149251263 |
|
Gm10705 |
|
348 |
3810 |
5856 |
7318 |
35063 |
|
0.19 |
0.16 |
0.1 |
-0.02 |
0.06 |
|
PREDICTED: ubiquitin-conjugating enzyme E2 L3-like
isoform 2 |
| 377833873 |
|
Gm10705 |
|
952 |
3810 |
5856 |
7432 |
35063 |
|
-0.19 |
0.16 |
0.1 |
0 |
0.06 |
|
PREDICTED: ubiquitin-conjugating enzyme E2 L3-like |
| 309263481 |
|
Gm10913 |
|
21253 |
956 |
12969 |
25441 |
0 |
|
-0.03 |
0.19 |
0.17 |
-0.08 |
n.v. |
|
PREDICTED: 60S ribosomal protein L29-like |
| 407263845 |
|
Gm11397 |
|
0 |
0 |
0 |
0 |
19588 |
|
n.v. |
n.v. |
n.v. |
n.v. |
-0.04 |
|
PREDICTED: serpin B9 |
| 149250406 |
|
Gm11449 |
|
7743 |
2325 |
3484 |
51856 |
0 |
|
0.24 |
0.39 |
0.41 |
0.12 |
n.v. |
|
PREDICTED: 60S ribosomal protein L29-like |
| 309267799 |
|
Gm11686 |
|
0 |
2259 |
44605 |
159684 |
0 |
|
n.v. |
0.16 |
0.18 |
-0.05 |
n.v. |
|
PREDICTED: 60S ribosomal protein L35a-like |
| 309264602 |
|
Gm11686 |
|
5345 |
8183 |
79625 |
186402 |
139 |
|
-0.72 |
0.16 |
0.18 |
-0.08 |
-0.49 |
|
PREDICTED: 60S ribosomal protein L35a-like |
| 309262452 |
|
Gm11703 |
|
73096 |
37454 |
114846 |
267095 |
0 |
|
-0.01 |
0.16 |
0.2 |
-0.15 |
n.v. |
|
PREDICTED: 60S ribosomal protein L21-like |
| 309268070 |
|
Gm11787 |
|
2691 |
1910 |
438 |
1686 |
0 |
|
0.15 |
0.07 |
-0.03 |
-0.1 |
n.v. |
|
PREDICTED: tyrosine-protein kinase Lyn-like |
| 149252067 |
|
Gm11810 |
|
5345 |
5924 |
65160 |
73449 |
139 |
|
-0.72 |
0.29 |
0.26 |
-0.14 |
-0.49 |
|
PREDICTED: 60S ribosomal protein L35a-like |
| 309264937 |
|
Gm11810 |
|
5345 |
5924 |
64120 |
73449 |
139 |
|
-0.72 |
0.29 |
0.19 |
-0.14 |
-0.49 |
|
PREDICTED: 60S ribosomal protein L35a-like |
| 309262489 |
|
Gm11964 |
|
275 |
1672 |
10477 |
2202 |
257 |
|
0.73 |
0.21 |
0.07 |
0.24 |
-0.1 |
|
PREDICTED: endothelial differentiation-related factor
1-like |
| 82934691 |
|
Gm12271 |
|
0 |
810 |
0 |
0 |
0 |
|
n.v. |
-0.18 |
n.v. |
n.v. |
n.v. |
|
PREDICTED: histone H3.3-like |
| 407261175 |
|
Gm12508 |
|
0 |
954 |
7972 |
25015 |
0 |
|
n.v. |
0.24 |
0.2 |
-0.02 |
n.v. |
|
PREDICTED: 60S ribosomal protein L29-like |
| 407263120 |
|
Gm12508 |
|
28997 |
3282 |
16493 |
77296 |
0 |
|
-0.02 |
0.34 |
0.2 |
0.07 |
n.v. |
|
PREDICTED: 60S ribosomal protein L29-like |
| 149252501 |
|
Gm12538 |
|
0 |
0 |
1285 |
0 |
0 |
|
n.v. |
n.v. |
-0.25 |
n.v. |
n.v. |
|
PREDICTED: ORM1-like protein 3-like |
| 124486606 |
|
Gm12657 |
|
3752513 |
39673 |
75553 |
374301 |
19995 |
|
-0.07 |
-0.22 |
-0.42 |
-0.34 |
-0.7 |
|
predicted gene 12657 |
| 407261198 |
|
Gm12666 |
|
805 |
0 |
3041 |
9381 |
15411 |
|
-0.23 |
n.v. |
-0.11 |
-0.02 |
0.14 |
|
PREDICTED: la-related protein 7 |
| 149252780 |
|
Gm12693 |
|
0 |
255 |
1905 |
1408 |
15861 |
|
n.v. |
0.3 |
0.08 |
0.36 |
0.18 |
|
PREDICTED: RWD domain-containing protein 1-like |
| 124486863 |
|
Gm12695 |
|
0 |
0 |
12 |
0 |
0 |
|
n.v. |
n.v. |
2.73 |
n.v. |
n.v. |
|
uncharacterized protein C1orf87 homolog |
| 309265873 |
|
Gm12770 |
|
5455 |
29517 |
79646 |
329493 |
0 |
|
0.04 |
0.18 |
0.26 |
-0.12 |
n.v. |
|
PREDICTED: uncharacterized protein LOC627004 |
| 309266996 |
|
Gm12816 |
|
33683 |
12122 |
151105 |
70306 |
0 |
|
0.02 |
0.16 |
0.21 |
-0.09 |
n.v. |
|
PREDICTED: 60S ribosomal protein L3-like, partial |
| 309268181 |
|
Gm12816 |
|
202721 |
30924 |
246111 |
215706 |
0 |
|
-0.06 |
0.18 |
0.23 |
-0.08 |
n.v. |
|
PREDICTED: 60S ribosomal protein L3-like |
| 309265057 |
|
Gm12854 |
|
44008 |
420 |
17321 |
180 |
13537 |
|
0.18 |
0.25 |
-0.03 |
0.07 |
0.01 |
|
PREDICTED: protein S100-A11-like isoform 1 |
| 150010657 |
|
Gm12942 |
|
238 |
180 |
0 |
0 |
0 |
|
-0.49 |
-0.03 |
n.v. |
n.v. |
n.v. |
|
uncharacterized protein ZMYM6NB precursor |
| 377837161 |
|
Gm13035 |
|
677 |
507 |
18394 |
2890 |
2892 |
|
1.26 |
0.92 |
0.22 |
0.18 |
-0.24 |
|
PREDICTED: 60S acidic ribosomal protein P1-like |
| 309267134 |
|
Gm13149 |
|
677 |
507 |
18394 |
2890 |
2892 |
|
1.26 |
0.92 |
0.22 |
0.18 |
-0.24 |
|
PREDICTED: 60S acidic ribosomal protein P1-like |
| 82896218 |
|
Gm13202 |
|
0 |
2576 |
0 |
0 |
2752 |
|
n.v. |
0.09 |
n.v. |
n.v. |
-0.61 |
|
PREDICTED: coiled-coil-helix-coiled-coil-helix
domain-containing protein 2, mitochondrial-like |
| 377837182 |
|
Gm13202 |
|
256 |
3092 |
0 |
0 |
2752 |
|
0.28 |
0.13 |
n.v. |
n.v. |
-0.61 |
|
PREDICTED: coiled-coil-helix-coiled-coil-helix
domain-containing protein 2, mitochondrial-like |
| 63517178 |
|
Gm13213 |
|
0 |
954 |
7972 |
25015 |
0 |
|
n.v. |
0.24 |
0.2 |
-0.02 |
n.v. |
|
PREDICTED: 60S ribosomal protein L29-like |
| 309265127 |
|
Gm13213 |
|
7743 |
2325 |
3484 |
51856 |
0 |
|
0.24 |
0.39 |
0.41 |
0.12 |
n.v. |
|
PREDICTED: 60S ribosomal protein L29-like |
| 94372927 |
|
Gm13229 |
|
677 |
507 |
18394 |
2890 |
2892 |
|
1.26 |
0.92 |
0.22 |
0.18 |
-0.24 |
|
PREDICTED: 60S acidic ribosomal protein P1-like |
| 309272470 |
|
Gm13249 |
|
677 |
507 |
18394 |
2890 |
2892 |
|
1.26 |
0.92 |
0.22 |
0.18 |
-0.24 |
|
PREDICTED: 60S acidic ribosomal protein P1-like |
| 407262645 |
|
Gm13249 |
|
677 |
507 |
18394 |
2890 |
2892 |
|
1.26 |
0.92 |
0.22 |
0.18 |
-0.24 |
|
PREDICTED: 60S acidic ribosomal protein P1-like |
| 407261047 |
|
Gm13552 |
|
0 |
200 |
0 |
0 |
0 |
|
n.v. |
0.21 |
n.v. |
n.v. |
n.v. |
|
PREDICTED: 28S ribosomal protein S18b, mitochondrial-like |
| 309264473 |
|
Gm13653 |
|
73096 |
37454 |
114846 |
267095 |
0 |
|
-0.01 |
0.16 |
0.2 |
-0.15 |
n.v. |
|
PREDICTED: 60S ribosomal protein L21-like |
| 82885184 |
|
Gm13777 |
|
677 |
507 |
18394 |
2890 |
2892 |
|
1.26 |
0.92 |
0.22 |
0.18 |
-0.24 |
|
PREDICTED: 60S acidic ribosomal protein P1-like isoform 3 |
| 82885753 |
|
Gm13981 |
|
40713 |
1958 |
29831 |
28093 |
0 |
|
-0.03 |
0.22 |
0.21 |
0.01 |
n.v. |
|
PREDICTED: 60S ribosomal protein L27a-like |
| 309264633 |
|
Gm14217 |
|
113314 |
37047 |
108551 |
412503 |
835 |
|
0.01 |
0.15 |
0.23 |
-0.1 |
0.14 |
|
PREDICTED: 60S ribosomal protein L5-like |
| 309267832 |
|
Gm14217 |
|
98761 |
24071 |
120959 |
300230 |
2013 |
|
0.1 |
0.15 |
0.28 |
-0.11 |
0.02 |
|
PREDICTED: 60S ribosomal protein L5-like |
| 309264642 |
|
Gm14277 |
|
989 |
46 |
23 |
6417 |
0 |
|
0.55 |
-0.29 |
-0.4 |
-0.06 |
n.v. |
|
PREDICTED: small nuclear ribonucleoprotein Sm D1-like |
| 149250385 |
|
Gm14279 |
|
5345 |
8183 |
80667 |
325163 |
139 |
|
-0.72 |
0.16 |
0.26 |
-0.1 |
-0.49 |
|
PREDICTED: 60S ribosomal protein L35a-like |
| 309264679 |
|
Gm14407 |
|
0 |
0 |
3083 |
0 |
0 |
|
n.v. |
n.v. |
0.28 |
n.v. |
n.v. |
|
PREDICTED: 60S ribosomal protein L27a-like |
| 82887979 |
|
Gm14439 |
|
0 |
0 |
3083 |
0 |
0 |
|
n.v. |
n.v. |
0.28 |
n.v. |
n.v. |
|
PREDICTED: 60S ribosomal protein L27a-like |
| 160333495 |
|
Gm14446 |
|
0 |
328 |
907 |
417 |
0 |
|
n.v. |
0.62 |
0.18 |
0.64 |
n.v. |
|
uncharacterized protein LOC667373 isoform 2 |
| 160333500 |
|
Gm14446 |
|
0 |
328 |
907 |
417 |
0 |
|
n.v. |
0.62 |
0.18 |
0.64 |
n.v. |
|
uncharacterized protein LOC667373 isoform 1 |
| 407262426 |
|
Gm14517 |
|
0 |
0 |
13 |
3520 |
3352 |
|
n.v. |
n.v. |
0.06 |
0.16 |
0.12 |
|
PREDICTED: transcription elongation factor B polypeptide
1-like |
| 309266821 |
|
Gm14535 |
|
0 |
0 |
0 |
638 |
0 |
|
n.v. |
n.v. |
n.v. |
-0.21 |
n.v. |
|
PREDICTED: protein LLP homolog |
| 149271597 |
|
Gm14680 |
|
0 |
0 |
0 |
0 |
5655 |
|
n.v. |
n.v. |
n.v. |
n.v. |
0.13 |
|
PREDICTED: spermine synthase-like |
| 309266900 |
|
Gm14925 |
|
0 |
63 |
0 |
0 |
0 |
|
n.v. |
-0.34 |
n.v. |
n.v. |
n.v. |
|
PREDICTED: HIG1 domain family member 1A-like |
| 149272225 |
|
Gm14958 |
|
98377 |
17431 |
104320 |
190044 |
1788 |
|
0.02 |
0.18 |
0.23 |
-0.11 |
0.09 |
|
PREDICTED: 40S ribosomal protein S12-like isoform 2 |
| 309266944 |
|
Gm15032 |
|
24237 |
12076 |
25427 |
76175 |
1649 |
|
-0.02 |
0.08 |
0.3 |
-0.2 |
-0.77 |
|
PREDICTED: 60S ribosomal protein L23-like |
| 377835587 |
|
Gm15210 |
|
0 |
1424 |
1010 |
156590 |
16118 |
|
n.v. |
-0.01 |
-0.08 |
0.18 |
-0.06 |
|
PREDICTED: inosine-5'-monophosphate dehydrogenase 2-like |
| 407262829 |
|
Gm15453 |
|
3368 |
159 |
7053 |
2341 |
1167 |
|
0.28 |
0.96 |
0.04 |
0.37 |
-0.09 |
|
PREDICTED: putative RNA-binding protein 3-like |
| 309264693 |
|
Gm15466 |
|
88272 |
129 |
7911 |
123 |
1371 |
|
0.15 |
0.12 |
0.02 |
0.04 |
0.04 |
|
PREDICTED: prothymosin alpha-like |
| 309266131 |
|
Gm15483 |
|
146613 |
51449 |
109948 |
268241 |
0 |
|
0 |
0.12 |
0.23 |
-0.15 |
n.v. |
|
PREDICTED: 40S ribosomal protein S13-like |
| 149257598 |
|
Gm15501 |
|
360848 |
65523 |
246648 |
542916 |
0 |
|
-0.02 |
0.12 |
0.21 |
-0.18 |
n.v. |
|
PREDICTED: 40S ribosomal protein S8 isoform 1 |
| 309265983 |
|
Gm15501 |
|
360848 |
65396 |
233123 |
539257 |
0 |
|
-0.02 |
0.11 |
0.2 |
-0.18 |
n.v. |
|
PREDICTED: 40S ribosomal protein S8, partial |
| 149234328 |
|
Gm15583 |
|
0 |
0 |
111 |
3233 |
0 |
|
n.v. |
n.v. |
-0.07 |
-0.19 |
n.v. |
|
PREDICTED: zinc finger BED domain-containing protein
4-like |
| 309265319 |
|
Gm15682 |
|
73096 |
26511 |
75005 |
88666 |
0 |
|
-0.01 |
0.21 |
0.2 |
-0.16 |
n.v. |
|
PREDICTED: 60S ribosomal protein L21-like |
| 359718915 |
|
Gm15800 |
|
0 |
92 |
966 |
1449 |
0 |
|
n.v. |
0.04 |
0.39 |
0.47 |
n.v. |
|
probable E3 ubiquitin-protein ligase C12orf51 homolog |
| 309264895 |
|
Gm16500 |
|
0 |
0 |
6 |
0 |
96 |
|
n.v. |
n.v. |
0.07 |
n.v. |
0.15 |
|
PREDICTED: short coiled-coil protein-like |
| 13384646 |
|
Gm16515 |
|
0 |
0 |
0 |
270 |
1863 |
|
n.v. |
n.v. |
n.v. |
0.14 |
0.23 |
|
protein GTLF3B |
| 309271517 |
|
Gm17267 |
|
0 |
0 |
0 |
0 |
2677 |
|
n.v. |
n.v. |
n.v. |
n.v. |
0.09 |
|
PREDICTED: uncharacterized protein LOC100502716 |
| 309270883 |
|
Gm17748 |
|
1849 |
946 |
822 |
8693 |
4059 |
|
0.13 |
0.16 |
0.05 |
0.05 |
0.08 |
|
PREDICTED: peptidyl-prolyl cis-trans isomerase
H-like |
| 407262256 |
|
Gm17748 |
|
1849 |
946 |
822 |
9282 |
4059 |
|
0.13 |
0.16 |
0.05 |
0.05 |
0.08 |
|
PREDICTED: peptidyl-prolyl cis-trans isomerase
H-like |
| 467087326 |
|
Gm1966 |
|
3661 |
0 |
0 |
0 |
0 |
|
-0.03 |
n.v. |
n.v. |
n.v. |
n.v. |
|
predicted gene 1966 |
| 377834355 |
|
Gm1966 |
|
0 |
0 |
31 |
0 |
0 |
|
n.v. |
n.v. |
0.63 |
n.v. |
n.v. |
|
PREDICTED: LOW QUALITY PROTEIN: interferon-induced very
large GTPase 1 |
| 467087326;309268933 |
|
Gm1966 |
|
0 |
0 |
5201 |
0 |
0 |
|
n.v. |
n.v. |
-0.04 |
n.v. |
n.v. |
|
predicted gene 1966 |
| 309268933 |
|
Gm1966 |
|
0 |
668 |
0 |
6917 |
17360 |
|
n.v. |
0.19 |
n.v. |
0.08 |
0.1 |
|
PREDICTED: interferon-induced very large GTPase 1 |
| 407262653 |
|
Gm19843 |
|
86569 |
31233 |
111695 |
266023 |
0 |
|
-0.01 |
0.13 |
0.24 |
-0.24 |
n.v. |
|
PREDICTED: 60S ribosomal protein L7a-like |
| 407263827 |
|
Gm19843 |
|
130577 |
35006 |
127110 |
305837 |
0 |
|
0.11 |
0.14 |
0.24 |
-0.17 |
n.v. |
|
PREDICTED: 60S ribosomal protein L7a-like |
| 407263802 |
|
Gm2001 |
|
3496 |
63 |
1294 |
1531 |
1917 |
|
0.11 |
0.38 |
0.05 |
0.2 |
-0.08 |
|
PREDICTED: ubiquitin-like protein 5-like |
| 309263466 |
|
Gm20056 |
|
0 |
816 |
2394 |
139 |
0 |
|
n.v. |
0.08 |
-0.08 |
-0.54 |
n.v. |
|
PREDICTED: calcium-binding protein p22-like, partial |
| 309270749 |
|
Gm20056 |
|
13437 |
2075 |
5708 |
237 |
0 |
|
-0.06 |
0.08 |
-0.08 |
-0.82 |
n.v. |
|
PREDICTED: calcium-binding protein p22-like, partial |
| 169808420 |
|
Gm2016 |
|
494 |
2202 |
15977 |
12778 |
1971 |
|
-0.22 |
0.28 |
0.14 |
0.06 |
-0.07 |
|
uncharacterized protein LOC100039042 |
| 407262742 |
|
Gm2016 |
|
494 |
1950 |
11249 |
13514 |
1221 |
|
-0.22 |
0.26 |
0.16 |
0.1 |
-0.07 |
|
PREDICTED: eukaryotic translation initiation factor 1A |
| 294832030 |
|
Gm2022 |
|
494 |
315 |
10349 |
9209 |
750 |
|
-0.22 |
0.45 |
0.2 |
0.02 |
0.08 |
|
Eif1a-like |
| 407262565 |
|
Gm2022 |
|
494 |
1950 |
11249 |
13514 |
1221 |
|
-0.22 |
0.26 |
0.16 |
0.1 |
-0.07 |
|
PREDICTED: eukaryotic translation initiation factor 1A |
| 309264649 |
|
Gm20267 |
|
146 |
432 |
0 |
0 |
0 |
|
0.38 |
-0.1 |
n.v. |
n.v. |
n.v. |
|
PREDICTED: CDGSH iron-sulfur domain-containing protein 3,
mitochondrial-like |
| 149263427 |
|
Gm2046 |
|
0 |
253 |
4886 |
6090 |
750 |
|
n.v. |
0.35 |
0.12 |
0.02 |
0.08 |
|
PREDICTED: eukaryotic translation initiation factor
1A-like |
| 219283246 |
|
Gm20604 |
|
0 |
0 |
0 |
319 |
107 |
|
n.v. |
n.v. |
n.v. |
0.52 |
-0.19 |
|
AK010878-Moap1 protein |
| 407263654 |
|
Gm20746 |
|
174255 |
6670 |
4879 |
240492 |
0 |
|
-0.1 |
-0.17 |
-0.38 |
-0.16 |
n.v. |
|
PREDICTED: ferritin light chain 1-like |
| 149273202 |
|
Gm20899 |
|
2242469 |
208025 |
506486 |
1402727 |
2875448 |
|
0.03 |
0.01 |
-0.04 |
0.14 |
0.02 |
|
PREDICTED: glyceraldehyde-3-phosphate dehydrogenase-like
isoform 2 |
| 398303830 |
|
Gm21319 |
|
494 |
1887 |
5774 |
7285 |
1221 |
|
-0.22 |
0.23 |
0.12 |
0.19 |
-0.07 |
|
eukaryotic translation initiation factor 1A-like |
| 407263560 |
|
Gm21540 |
|
35715 |
2474 |
11191 |
6409 |
0 |
|
-0.01 |
-0.04 |
-0.07 |
0.2 |
n.v. |
|
PREDICTED: transmembrane emp24 domain-containing protein
2-like |
| 407262920 |
|
Gm21596 |
|
135245 |
17341 |
28577 |
114475 |
266945 |
|
0.16 |
0.25 |
0.01 |
0.18 |
0.12 |
|
PREDICTED: high mobility group protein B1-like |
| 309272927 |
|
Gm2260 |
|
6169 |
43781 |
134860 |
222467 |
75352 |
|
0.25 |
0.14 |
-0.03 |
0.18 |
-0.02 |
|
PREDICTED: annexin A11-like |
| 309269866 |
|
Gm2423 |
|
528037 |
63287 |
155604 |
329084 |
567893 |
|
0.04 |
0.01 |
-0.07 |
0.01 |
0 |
|
PREDICTED: 14-3-3 protein theta-like |
| 149264832 |
|
Gm2904 |
|
0 |
0 |
3477 |
0 |
81467 |
|
n.v. |
n.v. |
0.01 |
n.v. |
0.01 |
|
PREDICTED: S-formylglutathione hydrolase-like |
| 6806917 |
|
Gm2a |
|
0 |
276 |
1374 |
0 |
19470 |
|
n.v. |
-0.01 |
-0.76 |
n.v. |
-0.22 |
|
ganglioside GM2 activator precursor |
| 309267022 |
|
Gm3141 |
|
0 |
61 |
383 |
9250 |
1906 |
|
n.v. |
-0.15 |
0.27 |
0.08 |
0.08 |
|
PREDICTED: protein CDV3-like |
| 309270370 |
|
Gm3141 |
|
0 |
61 |
383 |
9250 |
1906 |
|
n.v. |
-0.15 |
0.27 |
0.08 |
0.08 |
|
PREDICTED: uncharacterized protein LOC100041106 |
| 309262094 |
|
Gm3213 |
|
2123 |
96 |
2450 |
16977 |
2934 |
|
0.04 |
-0.18 |
-0.01 |
0.31 |
0.05 |
|
PREDICTED: ubiquitin-conjugating enzyme E2 N-like |
| 149266669 |
|
Gm3244 |
|
9922 |
10573 |
306 |
221 |
0 |
|
-0.1 |
-0.14 |
-0.74 |
0.25 |
n.v. |
|
PREDICTED: NADH dehydrogenase [ubiquinone] 1 beta
subcomplex subunit 4-like |
| 7949148 |
|
Gm3258 |
|
0 |
276 |
0 |
393 |
2324 |
|
n.v. |
0.33 |
n.v. |
-0.26 |
0.26 |
|
transcription elongation factor SPT4 2 |
| 309263233 |
|
Gm3362 |
|
150274 |
57056 |
182479 |
559508 |
1810 |
|
0.09 |
0.15 |
0.27 |
-0.1 |
-0.72 |
|
PREDICTED: 60S ribosomal protein L23a-like |
| 309263978 |
|
Gm340 |
|
0 |
0 |
0 |
0 |
6458 |
|
n.v. |
n.v. |
n.v. |
n.v. |
0.16 |
|
PREDICTED: uncharacterized protein C10orf12 |
| 309271277 |
|
Gm340 |
|
0 |
0 |
0 |
0 |
6458 |
|
n.v. |
n.v. |
n.v. |
n.v. |
0.16 |
|
PREDICTED: uncharacterized protein C10orf12 |
| 377833368 |
|
Gm3552 |
|
51110 |
17 |
22436 |
499 |
0 |
|
-1.43 |
0.08 |
0.22 |
-0.05 |
n.v. |
|
PREDICTED: 60S ribosomal protein L11-like |
| 377836168 |
|
Gm3552 |
|
51110 |
17 |
22436 |
499 |
0 |
|
-1.43 |
0.08 |
0.22 |
-0.05 |
n.v. |
|
PREDICTED: 60S ribosomal protein L11-like |
| 340545553 |
|
Gm3776 |
|
2911 |
299 |
1441 |
2808 |
44037 |
|
0.3 |
0.22 |
0.03 |
-0.96 |
-0.08 |
|
predicted gene 3776 |
| 309264292 |
|
Gm3837 |
|
18 |
94 |
247 |
7825 |
1531 |
|
0.86 |
-0.03 |
-0.11 |
-0.04 |
0.19 |
|
PREDICTED: programmed cell death protein 5-like |
| 309264301 |
|
Gm3934 |
|
42745 |
8444 |
6463 |
9962 |
97928 |
|
0.29 |
0.23 |
0.01 |
0.28 |
0.13 |
|
PREDICTED: glutathione S-transferase P 2-like |
| 309262833 |
|
Gm4024 |
|
142659 |
21324 |
15066 |
18499 |
0 |
|
-0.06 |
0.08 |
-0.08 |
0.2 |
n.v. |
|
PREDICTED: transmembrane emp24 domain-containing protein
10-like |
| 294774578;294774603 |
|
Gm4027 |
|
0 |
0 |
4886 |
0 |
0 |
|
n.v. |
n.v. |
0.12 |
n.v. |
n.v. |
|
eukaryotic translation initiation factor 1A-like 1 |
| 339895904 |
|
Gm4070 |
|
0 |
0 |
31 |
0 |
0 |
|
n.v. |
n.v. |
0.63 |
n.v. |
n.v. |
|
interferon-induced very large GTPase 1 |
| 149267527 |
|
Gm4581 |
|
101251 |
53910 |
109052 |
122153 |
0 |
|
-0.03 |
0.19 |
0.23 |
0.03 |
n.v. |
|
PREDICTED: 60S ribosomal protein L15-like |
| 309265658 |
|
Gm4604 |
|
24750 |
26735 |
83525 |
408468 |
0 |
|
0.14 |
0.16 |
0.23 |
-0.09 |
n.v. |
|
PREDICTED: 60S ribosomal protein L36-like |
| 168229231 |
|
Gm4794 |
|
0 |
0 |
0 |
0 |
300 |
|
n.v. |
n.v. |
n.v. |
n.v. |
0.27 |
|
uncharacterized protein LOC215895 |
| 298493250 |
|
Gm4832 |
|
0 |
0 |
88 |
262 |
0 |
|
n.v. |
n.v. |
0.26 |
0.04 |
n.v. |
|
40S ribosomal protein S24-like |
| 256221758 |
|
Gm4846 |
|
0 |
0 |
45 |
0 |
0 |
|
n.v. |
n.v. |
-0.05 |
n.v. |
n.v. |
|
flavin-containing monooxygenase 13 |
| 256221898 |
|
Gm4847 |
|
0 |
0 |
45 |
0 |
0 |
|
n.v. |
n.v. |
-0.05 |
n.v. |
n.v. |
|
flavin-containing monooxygenase 12 |
| 82904428 |
|
Gm4883 |
|
0 |
309 |
32076 |
178871 |
0 |
|
n.v. |
0.09 |
0.22 |
-0.08 |
n.v. |
|
PREDICTED: 60S ribosomal protein L18a-like |
| 407261549 |
|
Gm4887 |
|
3680 |
749 |
522 |
81913 |
30169 |
|
0.16 |
0.15 |
0.18 |
0.05 |
0.24 |
|
PREDICTED: LOW QUALITY PROTEIN: twinfilin-1 |
| 149258537 |
|
Gm4889 |
|
0 |
954 |
7933 |
25015 |
0 |
|
n.v. |
0.24 |
0.19 |
-0.02 |
n.v. |
|
PREDICTED: 60S ribosomal protein L29-like |
| 309266241 |
|
Gm4889 |
|
7743 |
3279 |
11417 |
76871 |
0 |
|
0.24 |
0.36 |
0.38 |
0.12 |
n.v. |
|
PREDICTED: 60S ribosomal protein L29-like |
| 309266922 |
|
Gm4916 |
|
76775 |
820 |
17168 |
3544 |
7775 |
|
-0.03 |
-0.01 |
-0.07 |
-0.12 |
-0.06 |
|
PREDICTED: LOW QUALITY PROTEIN: uncharacterized protein
LOC237030 |
| 81230474 |
|
Gm4925 |
|
51129 |
2336 |
29460 |
73171 |
1510 |
|
0 |
0.15 |
0.17 |
-0.18 |
0.09 |
|
ribosomal protein S12-like |
| 149267789 |
|
Gm4943 |
|
2453 |
624 |
116 |
0 |
0 |
|
-0.48 |
-0.15 |
-0.18 |
n.v. |
n.v. |
|
PREDICTED: NADH dehydrogenase [ubiquinone] 1 alpha
subcomplex subunit 11-like |
| 20846986 |
|
Gm4963 |
|
216469 |
55242 |
149142 |
235204 |
4027 |
|
-0.04 |
0.08 |
0.19 |
-0.19 |
-0.52 |
|
PREDICTED: 40S ribosomal protein S25-like |
| 307574641 |
|
Gm4975 |
|
0 |
0 |
342 |
0 |
0 |
|
n.v. |
n.v. |
-0.2 |
n.v. |
n.v. |
|
predicted gene 4975 |
| 25032837 |
|
Gm5058 |
|
5455 |
29517 |
79646 |
329493 |
0 |
|
0.04 |
0.18 |
0.26 |
-0.12 |
n.v. |
|
PREDICTED: 60S ribosomal protein L23a-like |
| 407261991 |
|
Gm5068 |
|
824 |
0 |
1362 |
0 |
139 |
|
0.22 |
n.v. |
0 |
n.v. |
-0.42 |
|
PREDICTED: protein S100-A11-like |
| 149263303 |
|
Gm5068 |
|
23011 |
142 |
11796 |
180 |
7936 |
|
0.03 |
-0.01 |
-0.05 |
0.07 |
-0.1 |
|
PREDICTED: uncharacterized protein LOC277089 |
| 82994207 |
|
Gm5093 |
|
205467 |
6450 |
32230 |
163785 |
2356 |
|
-0.07 |
0.09 |
0.21 |
-0.29 |
-0.21 |
|
PREDICTED: 60S ribosomal protein L11-like |
| 407262170 |
|
Gm5215 |
|
78807 |
18516 |
165624 |
453259 |
268 |
|
0.11 |
0.19 |
0.24 |
-0.14 |
-0.77 |
|
PREDICTED: 40S ribosomal protein S17-like |
| 407264077 |
|
Gm5215 |
|
78807 |
18516 |
165550 |
443535 |
268 |
|
0.11 |
0.19 |
0.23 |
-0.14 |
-0.77 |
|
PREDICTED: 40S ribosomal protein S17-like |
| 309263329 |
|
Gm5218 |
|
21253 |
956 |
12969 |
25441 |
0 |
|
-0.03 |
0.19 |
0.17 |
-0.08 |
n.v. |
|
PREDICTED: 60S ribosomal protein L29-like |
| 94380332 |
|
Gm5331 |
|
0 |
785 |
726 |
0 |
0 |
|
n.v. |
-0.05 |
-0.01 |
n.v. |
n.v. |
|
PREDICTED: interferon-induced transmembrane protein
2-like |
| 407264363 |
|
Gm5396 |
|
38022 |
7747 |
1333 |
2971 |
131727 |
|
0.05 |
0.23 |
-0.03 |
0.26 |
-0.01 |
|
PREDICTED: high mobility group protein B1-like |
| 83004259 |
|
Gm5396 |
|
38022 |
7747 |
1333 |
2971 |
131727 |
|
0.05 |
0.23 |
-0.03 |
0.26 |
-0.01 |
|
PREDICTED: high mobility group protein B1-like |
| 256017236 |
|
Gm5415 |
|
0 |
0 |
31 |
0 |
0 |
|
n.v. |
n.v. |
0.63 |
n.v. |
n.v. |
|
sentrin 14 |
| 407261829 |
|
Gm5428 |
|
231004 |
98069 |
190950 |
980639 |
0 |
|
0.01 |
0.13 |
0.2 |
-0.15 |
n.v. |
|
PREDICTED: 60S ribosomal protein L6-like |
| 82949522 |
|
Gm5445 |
|
73096 |
26511 |
75005 |
88756 |
0 |
|
-0.01 |
0.21 |
0.2 |
-0.15 |
n.v. |
|
PREDICTED: 60S ribosomal protein L21-like isoform 3 |
| 407262054 |
|
Gm5451 |
|
272723 |
13648 |
56071 |
64019 |
0 |
|
-0.06 |
-0.14 |
0.15 |
-0.23 |
n.v. |
|
PREDICTED: 60S ribosomal protein L9-like, partial |
| 51767763 |
|
Gm5451 |
|
310470 |
24601 |
122369 |
105430 |
0 |
|
-0.04 |
-0.11 |
0.18 |
-0.16 |
n.v. |
|
PREDICTED: 60S ribosomal protein L9-like |
| 82951993 |
|
Gm5453 |
|
90194 |
2762 |
16003 |
260407 |
0 |
|
-0.02 |
0.06 |
0.23 |
-0.16 |
n.v. |
|
PREDICTED: 60S ribosomal protein L27a-like |
| 82957080 |
|
Gm5471 |
|
0 |
0 |
0 |
33 |
0 |
|
n.v. |
n.v. |
n.v. |
-1.04 |
n.v. |
|
PREDICTED: eukaryotic translation initiation factor
1-like |
| 82964986 |
|
Gm5481 |
|
0 |
0 |
3105 |
65 |
0 |
|
n.v. |
n.v. |
0.17 |
-0.22 |
n.v. |
|
PREDICTED: 60S ribosomal protein L30-like |
| 70794816 |
|
Gm5506 |
|
907850 |
191909 |
0 |
802725 |
2825135 |
|
0.14 |
0.01 |
n.v. |
0.08 |
0.03 |
|
uncharacterized protein LOC433182 |
| 82879797 |
|
Gm5528 |
|
71979 |
39254 |
113540 |
260235 |
0 |
|
-0.01 |
0.11 |
0.2 |
-0.15 |
n.v. |
|
PREDICTED: 60S ribosomal protein L21-like |
| 82896822 |
|
Gm5553 |
|
0 |
0 |
1285 |
0 |
0 |
|
n.v. |
n.v. |
-0.25 |
n.v. |
n.v. |
|
PREDICTED: ORM1-like protein 2-like |
| 94375800 |
|
Gm5566 |
|
42031 |
51622 |
77518 |
184650 |
648032 |
|
0.32 |
0.14 |
0.07 |
0.24 |
0.06 |
|
PREDICTED: nucleoside diphosphate kinase B-like |
| 82902181 |
|
Gm5576 |
|
192396 |
38924 |
79117 |
74243 |
49649 |
|
0.02 |
0.22 |
0.16 |
-0.09 |
-0.02 |
|
PREDICTED: eukaryotic initiation factor 4A-III-like |
| 85701806 |
|
Gm561 |
|
0 |
102 |
20 |
0 |
0 |
|
n.v. |
-0.17 |
-0.39 |
n.v. |
n.v. |
|
uncharacterized protein LOC228715 |
| 82930689 |
|
Gm5620 |
|
493622 |
100299 |
170726 |
881037 |
584161 |
|
0.07 |
-0.1 |
-0.06 |
-0.01 |
0.1 |
|
PREDICTED: tubulin alpha-1C chain isoform 4 |
| 309266590 |
|
Gm5621 |
|
50360 |
4160 |
57036 |
85768 |
0 |
|
-0.06 |
0.21 |
0.3 |
-0.09 |
n.v. |
|
PREDICTED: 60S ribosomal protein L10-like |
| 82931053 |
|
Gm5621 |
|
27917 |
2912 |
41077 |
54000 |
0 |
|
0.09 |
0.25 |
0.27 |
-0.05 |
n.v. |
|
PREDICTED: 60S ribosomal protein L10-like isoform 2 |
| 149262895 |
|
Gm5633 |
|
494 |
142 |
571 |
9397 |
0 |
|
0.16 |
0.37 |
-0.02 |
0.02 |
n.v. |
|
PREDICTED: mRNA turnover protein 4 homolog isoform 2 |
| 83001127 |
|
Gm5637 |
|
13418 |
238 |
8121 |
66180 |
24021 |
|
0.2 |
0.33 |
0.1 |
0.04 |
0.01 |
|
PREDICTED: actin-related protein 41673 complex subunit
1B-like |
| 85701506 |
|
Gm5662 |
|
0 |
2140 |
10515 |
13375 |
1971 |
|
n.v. |
0.25 |
0.12 |
0.02 |
-0.07 |
|
Eif1a-like |
| 407262667 |
|
Gm5662 |
|
494 |
2202 |
15977 |
12778 |
1971 |
|
-0.22 |
0.28 |
0.14 |
0.06 |
-0.07 |
|
PREDICTED: eukaryotic translation initiation factor 1A |
| 82950935 |
|
Gm5792 |
|
118293 |
2549 |
1826 |
5231 |
13622 |
|
-0.02 |
0.01 |
0.07 |
-0.4 |
-0.01 |
|
PREDICTED: chromobox protein homolog 3-like |
| 260304980 |
|
Gm5803 |
|
547643 |
12151 |
21426 |
40265 |
493 |
|
-0.07 |
-0.2 |
-0.1 |
-0.19 |
0.29 |
|
predicted gene 5803 |
| 309270629 |
|
Gm5806 |
|
0 |
0 |
290 |
0 |
0 |
|
n.v. |
n.v. |
0.01 |
n.v. |
n.v. |
|
PREDICTED: G/T mismatch-specific thymine DNA
glycosylase-like isoform 5 |
| 309264759 |
|
Gm5848 |
|
67824 |
1870 |
10564 |
45332 |
6415 |
|
-0.04 |
0.05 |
-0.01 |
-0.11 |
-0.11 |
|
PREDICTED: small nuclear ribonucleoprotein Sm D2-like |
| 63501063 |
|
Gm5848 |
|
67824 |
1870 |
10564 |
45332 |
6415 |
|
-0.04 |
0.05 |
-0.01 |
-0.11 |
-0.11 |
|
PREDICTED: small nuclear ribonucleoprotein Sm D2-like |
| 82891539 |
|
Gm5858 |
|
0 |
1286 |
5101 |
2546 |
33799 |
|
n.v. |
0.03 |
0.11 |
0 |
0.1 |
|
PREDICTED: ubiquitin-conjugating enzyme E2 L3-like
isoform 3 |
| 309266232 |
|
Gm5908 |
|
155766 |
5837 |
63125 |
77706 |
0 |
|
0 |
0.16 |
0.23 |
-0.09 |
n.v. |
|
PREDICTED: 60S ribosomal protein L27a-like |
| 82965725 |
|
Gm5963 |
|
17189 |
599 |
10499 |
794 |
1424 |
|
0.01 |
0.72 |
0.26 |
-0.35 |
-0.34 |
|
PREDICTED: 40S ribosomal protein S21-like |
| 82952096 |
|
Gm6109 |
|
50122 |
403 |
5441 |
31523 |
11 |
|
0.31 |
0.2 |
0.29 |
0.06 |
-1.11 |
|
PREDICTED: 60S ribosomal protein L30-like |
| 407262070 |
|
Gm6115 |
|
123090 |
12218 |
24767 |
85744 |
191871 |
|
0.13 |
0.22 |
0 |
0.15 |
-0.01 |
|
PREDICTED: high mobility group protein B1-like |
| 407263905 |
|
Gm6115 |
|
123090 |
12218 |
24767 |
85744 |
191871 |
|
0.13 |
0.22 |
0 |
0.15 |
-0.01 |
|
PREDICTED: high mobility group protein B1-like isoform 1 |
| 407261316 |
|
Gm6139 |
|
194630 |
51497 |
240782 |
571614 |
0 |
|
0.02 |
0.11 |
0.28 |
-0.17 |
n.v. |
|
PREDICTED: 40S ribosomal protein S2-like |
| 85701852 |
|
Gm614 |
|
0 |
0 |
79 |
0 |
0 |
|
n.v. |
n.v. |
-0.05 |
n.v. |
n.v. |
|
uncharacterized protein CXorf65 homolog |
| 309265975 |
|
Gm6155 |
|
3625 |
2597 |
2750 |
3372 |
2967 |
|
0 |
0.12 |
0.12 |
0.11 |
-0.2 |
|
PREDICTED: eukaryotic translation initiation factor
1-like |
| 309268860 |
|
Gm6155 |
|
3625 |
2597 |
2750 |
3372 |
2967 |
|
0 |
0.12 |
0.12 |
0.11 |
-0.2 |
|
PREDICTED: eukaryotic translation initiation factor
1-like |
| 407262102 |
|
Gm6158 |
|
0 |
2691 |
11382 |
2218 |
889 |
|
n.v. |
0.17 |
0.08 |
0.13 |
0.35 |
|
PREDICTED: CCR4-NOT transcription complex subunit 1-like |
| 377833664 |
|
Gm6177 |
|
77013 |
2799 |
23641 |
12106 |
0 |
|
0.16 |
0.16 |
0.25 |
-0.1 |
n.v. |
|
PREDICTED: 60S ribosomal protein L23a |
| 82883044 |
|
Gm6177 |
|
77013 |
2799 |
23641 |
12106 |
0 |
|
0.16 |
0.16 |
0.25 |
-0.1 |
n.v. |
|
PREDICTED: 60S ribosomal protein L23a |
| 82795390 |
|
Gm6195 |
|
0 |
167 |
29 |
319 |
13462 |
|
n.v. |
0.12 |
0.48 |
0.24 |
-0.09 |
|
PREDICTED: replication protein A 14 kDa subunit-like |
| 82795935 |
|
Gm6195 |
|
0 |
167 |
29 |
319 |
13462 |
|
n.v. |
0.12 |
0.48 |
0.24 |
-0.09 |
|
PREDICTED: replication protein A 14 kDa subunit-like |
| 283945554 |
|
Gm6251 |
|
19844 |
4578 |
26180 |
33864 |
0 |
|
0.24 |
0.1 |
0.19 |
-0.23 |
n.v. |
|
ribosomal protein L32-like |
| 309265684 |
|
Gm6253 |
|
0 |
0 |
0 |
180 |
86 |
|
n.v. |
n.v. |
n.v. |
0.17 |
-0.24 |
|
PREDICTED: gem-associated protein 6-like |
| 82914650 |
|
Gm6314 |
|
1318 |
0 |
20 |
0 |
0 |
|
0.06 |
n.v. |
0 |
n.v. |
n.v. |
|
PREDICTED: costars family protein ABRACL-like |
| 407264048 |
|
Gm6330 |
|
0 |
0 |
275 |
0 |
0 |
|
n.v. |
n.v. |
-0.29 |
n.v. |
n.v. |
|
PREDICTED: gem-associated protein 4-like |
| 407263925 |
|
Gm6404 |
|
18324 |
0 |
11819 |
62063 |
0 |
|
0.05 |
n.v. |
0.17 |
-0.1 |
n.v. |
|
PREDICTED: 60S ribosomal protein L34-like |
| 309265963 |
|
Gm6415 |
|
8384 |
1081 |
10 |
0 |
0 |
|
-0.03 |
-0.19 |
-0.17 |
n.v. |
n.v. |
|
PREDICTED: NADH dehydrogenase [ubiquinone] iron-sulfur
protein 6, mitochondrial-like |
| 82906344 |
|
Gm6415 |
|
8384 |
1081 |
10 |
0 |
0 |
|
-0.03 |
-0.19 |
-0.17 |
n.v. |
n.v. |
|
PREDICTED: NADH dehydrogenase [ubiquinone] iron-sulfur
protein 6, mitochondrial-like |
| 348041355 |
|
Gm6432 |
|
0 |
0 |
19 |
442 |
193 |
|
n.v. |
n.v. |
-0.67 |
0 |
-0.43 |
|
fas apoptotic inhibitory molecule 1-like |
| 82952669 |
|
Gm6436 |
|
210775 |
6415 |
188942 |
289613 |
975 |
|
-0.1 |
0.07 |
0.23 |
-0.13 |
-2.27 |
|
PREDICTED: 40S ribosomal protein S18-like |
| 407262458 |
|
Gm6500 |
|
0 |
109 |
16 |
1973 |
0 |
|
n.v. |
0.64 |
-0.24 |
0 |
n.v. |
|
PREDICTED: actin-related protein 41673 complex subunit
5-like, partial |
| 407264342 |
|
Gm6500 |
|
0 |
109 |
16 |
1973 |
0 |
|
n.v. |
0.64 |
-0.24 |
0 |
n.v. |
|
PREDICTED: actin-related protein 41673 complex subunit
5-like, partial |
| 85702318 |
|
Gm6531 |
|
0 |
0 |
0 |
0 |
525 |
|
n.v. |
n.v. |
n.v. |
n.v. |
-0.1 |
|
predicted gene 6531 |
| 149251558 |
|
Gm6570 |
|
156846 |
6866 |
59077 |
61171 |
793 |
|
0 |
0.05 |
0.22 |
-0.01 |
-0.66 |
|
PREDICTED: 60S ribosomal protein L30-like |
| 82890078 |
|
Gm6570 |
|
156846 |
6866 |
62182 |
95632 |
793 |
|
0 |
0.05 |
0.22 |
-0.06 |
-0.66 |
|
PREDICTED: 60S ribosomal protein L30-like |
| 309262251 |
|
Gm6613 |
|
68336 |
8546 |
31482 |
94862 |
0 |
|
-0.07 |
0.25 |
0.22 |
-0.15 |
n.v. |
|
PREDICTED: 60S ribosomal protein L17-like |
| 309271811 |
|
Gm6625 |
|
87796 |
129 |
7911 |
123 |
1371 |
|
0.15 |
0.12 |
0.02 |
0.04 |
0.04 |
|
PREDICTED: prothymosin alpha-like |
| 407264254 |
|
Gm6747 |
|
0 |
0 |
186 |
33 |
21 |
|
n.v. |
n.v. |
0.06 |
-0.38 |
0.47 |
|
PREDICTED: predicted gene 6747 |
| 82998543 |
|
Gm6747 |
|
0 |
0 |
186 |
33 |
21 |
|
n.v. |
n.v. |
0.06 |
-0.38 |
0.47 |
|
PREDICTED: predicted gene 6747 isoform 2 |
| 149255259 |
|
Gm6749 |
|
3410996 |
14692 |
75553 |
360983 |
19995 |
|
-0.07 |
-0.23 |
-0.42 |
-0.34 |
-0.7 |
|
PREDICTED: histone H3.3-like |
| 309265661 |
|
Gm6749 |
|
3410996 |
14692 |
75553 |
360983 |
19995 |
|
-0.07 |
-0.23 |
-0.42 |
-0.34 |
-0.7 |
|
PREDICTED: histone H3.3-like |
| 309266388 |
|
Gm6834 |
|
146613 |
51449 |
111820 |
268200 |
0 |
|
0 |
0.12 |
0.23 |
-0.16 |
n.v. |
|
PREDICTED: 40S ribosomal protein S13-like |
| 82905251 |
|
Gm6851 |
|
165 |
353 |
1266 |
3061 |
1778 |
|
0.24 |
0.32 |
0.15 |
0.1 |
0.03 |
|
PREDICTED: peptidyl-prolyl cis-trans isomerase
NIMA-interacting 4-like |
| 82950919 |
|
Gm6901 |
|
118293 |
2549 |
1826 |
5231 |
13622 |
|
-0.02 |
0.01 |
0.07 |
-0.4 |
-0.01 |
|
PREDICTED: chromobox protein homolog 3-like |
| 407263864 |
|
Gm6910 |
|
0 |
0 |
0 |
25 |
0 |
|
n.v. |
0.93 |
n.v. |
-0.5 |
n.v. |
|
PREDICTED: RING1 and YY1-binding protein-like |
| 309267035 |
|
Gm6917 |
|
118293 |
2549 |
2022 |
5435 |
16439 |
|
-0.02 |
0.01 |
-0.01 |
-0.4 |
-0.06 |
|
PREDICTED: chromobox protein homolog 3-like |
| 309269987 |
|
Gm6917 |
|
118293 |
2549 |
1826 |
5231 |
13622 |
|
-0.02 |
0.01 |
0.07 |
-0.4 |
-0.01 |
|
PREDICTED: chromobox protein homolog 3-like |
| 309266416 |
|
Gm6921 |
|
0 |
2042 |
10313 |
53280 |
0 |
|
n.v. |
0.31 |
0.35 |
0.08 |
n.v. |
|
PREDICTED: 40S ribosomal protein S15-like isoform 1 |
| 82918545 |
|
Gm6921 |
|
0 |
2042 |
10313 |
53280 |
0 |
|
n.v. |
0.31 |
0.35 |
0.08 |
n.v. |
|
PREDICTED: 40S ribosomal protein S15-like isoform 2 |
| 149267906 |
|
Gm6958 |
|
458 |
827 |
2616 |
3389 |
0 |
|
0.28 |
0.31 |
0.4 |
-0.45 |
n.v. |
|
PREDICTED: envelope glycoprotein |
| 83002589 |
|
Gm6987 |
|
83842 |
27724 |
6430 |
5394 |
278 |
|
0.01 |
-0.12 |
0.15 |
-0.19 |
-2.28 |
|
PREDICTED: 40S ribosomal protein S18-like isoform 2 |
| 309262778 |
|
Gm6988 |
|
216469 |
55242 |
149142 |
63790 |
4027 |
|
-0.04 |
0.08 |
0.19 |
-0.19 |
-0.52 |
|
PREDICTED: 40S ribosomal protein S25-like |
| 82943174 |
|
Gm6988 |
|
169624 |
55676 |
125505 |
45201 |
3020 |
|
-0.05 |
0.07 |
0.19 |
-0.12 |
-0.47 |
|
PREDICTED: 40S ribosomal protein S25-like |
| 309266895 |
|
Gm7061 |
|
58103 |
1134 |
524 |
7670 |
0 |
|
0.13 |
0.04 |
-0.23 |
-0.07 |
n.v. |
|
PREDICTED: splicing factor U2AF 65 kDa subunit-like,
partial |
| 309271453 |
|
Gm7061 |
|
64163 |
2616 |
7394 |
164857 |
24985 |
|
0.12 |
-0.28 |
-0.21 |
-0.09 |
-0.37 |
|
PREDICTED: splicing factor U2AF 65 kDa subunit-like |
| 377834609 |
|
Gm7061 |
|
6078 |
1482 |
6812 |
157842 |
24985 |
|
0.09 |
-0.37 |
-0.13 |
-0.1 |
-0.37 |
|
PREDICTED: proteasome subunit beta type-1-like |
| 407262228 |
|
Gm7250 |
|
6682 |
253 |
1330 |
909 |
0 |
|
-0.08 |
-0.2 |
-0.26 |
-0.67 |
n.v. |
|
PREDICTED: mitochondrial import receptor subunit TOM22
homolog |
| 94408110 |
|
Gm7429 |
|
192817 |
15212 |
93033 |
331302 |
793 |
|
0 |
0.11 |
0.24 |
-0.07 |
-0.66 |
|
PREDICTED: 60S ribosomal protein L30-like |
| 309265940 |
|
Gm7546 |
|
0 |
0 |
0 |
1138 |
0 |
|
n.v. |
n.v. |
n.v. |
0.07 |
n.v. |
|
PREDICTED: uncharacterized protein LOC665234 |
| 312176359 |
|
Gm7694 |
|
0 |
0 |
6 |
0 |
0 |
|
n.v. |
n.v. |
0.62 |
n.v. |
n.v. |
|
uncharacterized protein LOC665574 |
| 407264240 |
|
Gm7810 |
|
86569 |
33342 |
117897 |
276074 |
0 |
|
-0.01 |
0.15 |
0.26 |
-0.21 |
n.v. |
|
PREDICTED: uncharacterized protein LOC665826 |
| 149260017 |
|
Gm7866 |
|
1577210 |
13087 |
42062 |
108843 |
91491 |
|
0.01 |
0.05 |
-0.05 |
0.03 |
0.01 |
|
PREDICTED: ubiquitin-60S ribosomal protein L40-like |
| 309266537 |
|
Gm7866 |
|
1577210 |
13087 |
42062 |
108418 |
91491 |
|
0.01 |
0.05 |
-0.05 |
0.03 |
0.01 |
|
PREDICTED: ubiquitin-60S ribosomal protein L40-like |
| 407262833 |
|
Gm7889 |
|
0 |
1096 |
0 |
0 |
0 |
|
n.v. |
-0.69 |
n.v. |
n.v. |
n.v. |
|
PREDICTED: d-2-hydroxyglutarate dehydrogenase,
mitochondrial-like |
| 94374770 |
|
Gm8069 |
|
2984 |
1052 |
0 |
0 |
0 |
|
-0.02 |
-0.22 |
n.v. |
n.v. |
n.v. |
|
PREDICTED: mitochondrial import receptor subunit TOM5
homolog |
| 94388464 |
|
Gm8112 |
|
73261 |
54257 |
158838 |
513366 |
1810 |
|
0.03 |
0.14 |
0.31 |
-0.11 |
-0.72 |
|
PREDICTED: 60S ribosomal protein L23a-like |
| 94388474 |
|
Gm8137 |
|
73261 |
54257 |
158838 |
512482 |
1810 |
|
0.03 |
0.14 |
0.31 |
-0.11 |
-0.72 |
|
PREDICTED: 60S ribosomal protein L23a-like |
| 94363330 |
|
Gm8210 |
|
28997 |
3282 |
16493 |
77296 |
0 |
|
-0.02 |
0.34 |
0.2 |
0.07 |
n.v. |
|
PREDICTED: 60S ribosomal protein L29-like |
| 309265674 |
|
Gm8213 |
|
79576 |
3075 |
50205 |
55318 |
0 |
|
0.03 |
0.2 |
0.23 |
-0.09 |
n.v. |
|
PREDICTED: 60S ribosomal protein L27a-like |
| 94388507 |
|
Gm8290 |
|
97791 |
54593 |
159127 |
473608 |
0 |
|
0.11 |
0.17 |
0.26 |
-0.1 |
n.v. |
|
PREDICTED: 60S ribosomal protein L23a-like |
| 309265697 |
|
Gm8430 |
|
1589273 |
33640 |
82742 |
196175 |
91491 |
|
0.02 |
0.08 |
0.17 |
0.05 |
0.01 |
|
PREDICTED: ubiquitin-40S ribosomal protein S27a-like |
| 94378076 |
|
Gm8430 |
|
1589273 |
33640 |
82742 |
196175 |
91491 |
|
0.02 |
0.08 |
0.17 |
0.05 |
0.01 |
|
PREDICTED: ubiquitin-40S ribosomal protein S27a-like |
| 377833325 |
|
Gm8526 |
|
0 |
0 |
11437 |
47705 |
0 |
|
n.v. |
n.v. |
0.2 |
-0.1 |
n.v. |
|
PREDICTED: 60S ribosomal protein L21-like |
| 309265232 |
|
Gm8539 |
|
0 |
121 |
290 |
0 |
664 |
|
n.v. |
0.08 |
0.14 |
n.v. |
-0.28 |
|
PREDICTED: protein archease-like |
| 309265997 |
|
Gm8556 |
|
38022 |
7747 |
1333 |
2971 |
131727 |
|
0.05 |
0.23 |
-0.03 |
0.26 |
-0.01 |
|
PREDICTED: uncharacterized protein LOC667284 |
| 407263446 |
|
Gm8556 |
|
124371 |
17341 |
28577 |
113542 |
282260 |
|
0.13 |
0.25 |
0.01 |
0.18 |
0.13 |
|
PREDICTED: uncharacterized protein LOC667284 |
| 149263421 |
|
Gm8587 |
|
0 |
0 |
0 |
1023 |
0 |
|
n.v. |
n.v. |
n.v. |
0.83 |
n.v. |
|
PREDICTED: U1 small nuclear ribonucleoprotein A-like |
| 149240882 |
|
Gm8618 |
|
58048 |
2221 |
17354 |
39937 |
0 |
|
-0.03 |
-0.02 |
0.16 |
-0.16 |
n.v. |
|
PREDICTED: 40S ribosomal protein S23-like |
| 309266362 |
|
Gm8841 |
|
187142 |
52612 |
251507 |
572768 |
0 |
|
0.02 |
0.11 |
0.27 |
-0.17 |
n.v. |
|
PREDICTED: 40S ribosomal protein S2-like |
| 94383782 |
|
Gm8841 |
|
187142 |
52612 |
251507 |
530236 |
0 |
|
0.02 |
0.11 |
0.27 |
-0.17 |
n.v. |
|
PREDICTED: 40S ribosomal protein S2-like |
| 94384306 |
|
Gm8842 |
|
110605 |
41984 |
182896 |
519186 |
0 |
|
0.03 |
0.05 |
0.2 |
-0.18 |
n.v. |
|
PREDICTED: 40S ribosomal protein S2-like isoform 2 |
| 309270419 |
|
Gm8894 |
|
52410 |
32167 |
45391 |
186934 |
201210 |
|
0.16 |
0.29 |
0.16 |
0.16 |
-0.03 |
|
PREDICTED: myosin light polypeptide 6, partial |
| 377833377 |
|
Gm8894 |
|
50012 |
18024 |
37127 |
156901 |
170185 |
|
0.16 |
0.32 |
0.17 |
0.18 |
-0.01 |
|
PREDICTED: LOW QUALITY PROTEIN: myosin light polypeptide
6, partial |
| 326320033 |
|
Gm8909 |
|
0 |
0 |
234 |
0 |
0 |
|
n.v. |
n.v. |
-0.31 |
n.v. |
n.v. |
|
uncharacterized protein LOC667977 precursor |
| 218505708 |
|
Gm8994 |
|
193641 |
38091 |
75722 |
52330 |
47475 |
|
0.01 |
0.23 |
0.16 |
-0.09 |
0.04 |
|
predicted gene, EG668137 |
| 94392404 |
|
Gm9178 |
|
494 |
142 |
351 |
6974 |
0 |
|
0.16 |
0.37 |
0.12 |
0 |
n.v. |
|
PREDICTED: mRNA turnover protein 4 homolog |
| 407261558 |
|
Gm9234 |
|
813409 |
123535 |
168771 |
400225 |
523609 |
|
0.03 |
0.12 |
0.03 |
0.05 |
0.06 |
|
PREDICTED: peptidyl-prolyl cis-trans isomerase
A-like |
| 94370353 |
|
Gm9372 |
|
0 |
0 |
275 |
0 |
0 |
|
n.v. |
n.v. |
0.13 |
n.v. |
n.v. |
|
PREDICTED: 40S ribosomal protein S23-like |
| 407263600 |
|
Gm9385 |
|
93690 |
35534 |
151562 |
249103 |
535 |
|
-0.05 |
0.09 |
0.19 |
-0.21 |
-0.53 |
|
PREDICTED: 60S ribosomal protein L24-like |
| 94403170 |
|
Gm9386 |
|
0 |
0 |
107 |
0 |
53076 |
|
n.v. |
n.v. |
-0.11 |
n.v. |
-0.16 |
|
PREDICTED: nuclear transport factor 2-like |
| 309266196 |
|
Gm9457 |
|
14389 |
3530 |
19349 |
11157 |
2442 |
|
0.07 |
-0.02 |
0.18 |
-0.04 |
-0.07 |
|
PREDICTED: 60S ribosomal protein L22-like |
| 377834619 |
|
Gm9670 |
|
23871 |
8423 |
41605 |
205081 |
0 |
|
0.01 |
0.13 |
0.19 |
-0.13 |
n.v. |
|
PREDICTED: 60S ribosomal protein L13-like isoform 2 |
| 309268396 |
|
Gm9835 |
|
0 |
0 |
0 |
41 |
0 |
|
n.v. |
n.v. |
n.v. |
0.43 |
n.v. |
|
PREDICTED: glia maturation factor gamma-like |
| 309265531 |
|
Gm9835 |
|
0 |
0 |
1291 |
4142 |
8054 |
|
n.v. |
n.v. |
-0.02 |
0.34 |
0.15 |
|
PREDICTED: glia maturation factor gamma-like |
| 316659416 |
|
Gm9839 |
|
0 |
0 |
31 |
0 |
0 |
|
n.v. |
n.v. |
0.63 |
n.v. |
n.v. |
|
sentrin 15 |
| 22122523 |
|
Gmds |
|
0 |
610 |
12573 |
49162 |
183936 |
|
n.v. |
0.4 |
-0.01 |
0.22 |
0.07 |
|
GDP-mannose 4,6 dehydratase |
| 188528613 |
|
Gmfb |
|
238 |
706 |
1703 |
4297 |
8482 |
|
-0.25 |
0.23 |
0.04 |
0.39 |
0.28 |
|
glia maturation factor beta |
| 11993950 |
|
Gmfg |
|
0 |
0 |
1291 |
4142 |
8054 |
|
n.v. |
n.v. |
-0.02 |
0.34 |
0.15 |
|
glia maturation factor gamma isoform 1 |
| 37674214 |
|
Gmip |
|
0 |
0 |
0 |
0 |
32 |
|
n.v. |
n.v. |
n.v. |
n.v. |
1.95 |
|
GEM-interacting protein |
| 19526884 |
|
Gmppa |
|
0 |
119 |
255 |
14177 |
7347 |
|
n.v. |
0.11 |
0.02 |
0.27 |
0.31 |
|
mannose-1-phosphate guanyltransferase alpha |
| 29244556 |
|
Gmppb |
|
0 |
13 |
664 |
32488 |
25596 |
|
n.v. |
-0.33 |
-0.03 |
0.32 |
-0.09 |
|
mannose-1-phosphate guanyltransferase beta |
| 17975500 |
|
Gmpr |
|
110 |
0 |
129 |
5010 |
75 |
|
-0.23 |
n.v. |
0.35 |
-0.08 |
0.22 |
|
GMP reductase 1 |
| 29568082 |
|
Gmpr2 |
|
110 |
0 |
15 |
15954 |
19491 |
|
-0.23 |
n.v. |
-0.61 |
0.21 |
0.07 |
|
GMP reductase 2 |
| 85861218 |
|
Gmps |
|
2874 |
10041 |
16317 |
54090 |
88193 |
|
0.21 |
0.23 |
0.05 |
0.08 |
0.02 |
|
GMP synthase [glutamine-hydrolyzing] |
| 6754004 |
|
Gna11 |
|
15999 |
998 |
39017 |
3880 |
696 |
|
0.02 |
-0.06 |
-0.15 |
-0.49 |
-2.44 |
|
guanine nucleotide-binding protein subunit alpha-11 |
| 6754006 |
|
Gna12 |
|
28667 |
5361 |
36841 |
41 |
17028 |
|
0.32 |
0.04 |
0.04 |
0.34 |
0.03 |
|
guanine nucleotide-binding protein subunit alpha-12 |
| 89001109 |
|
Gna13 |
|
29070 |
5622 |
45953 |
41 |
17028 |
|
0.28 |
0.05 |
-0.07 |
0.34 |
0.03 |
|
guanine nucleotide-binding protein subunit alpha-13 |
| 160298199 |
|
Gna14 |
|
0 |
0 |
10013 |
0 |
0 |
|
n.v. |
n.v. |
-0.18 |
n.v. |
n.v. |
|
guanine nucleotide-binding protein subunit alpha-14 |
| 74271899 |
|
Gnai1 |
|
66030 |
7344 |
85815 |
14104 |
52937 |
|
0.01 |
0.01 |
-0.05 |
-0.16 |
-0.1 |
|
guanine nucleotide-binding protein G(i) subunit alpha-1 |
| 41054806 |
|
Gnai2 |
|
158823 |
11803 |
135318 |
55588 |
125290 |
|
-0.02 |
-0.04 |
-0.1 |
-0.19 |
-0.15 |
|
guanine nucleotide-binding protein G(i) subunit alpha-2 |
| 33563256 |
|
Gnai3 |
|
89937 |
8576 |
122578 |
37040 |
76112 |
|
0.03 |
0.03 |
-0.05 |
-0.16 |
-0.04 |
|
guanine nucleotide-binding protein G(k) subunit alpha |
| 47271350 |
|
Gnal |
|
28667 |
10772 |
39631 |
41 |
17028 |
|
0.32 |
0.01 |
-0.02 |
0.34 |
0.03 |
|
guanine nucleotide-binding protein G(olf) subunit alpha
isoform 1 |
| 84000001 |
|
Gnal |
|
28667 |
10772 |
39631 |
41 |
17028 |
|
0.32 |
0.01 |
-0.02 |
0.34 |
0.03 |
|
guanine nucleotide-binding protein G(olf) subunit alpha
isoform 2 |
| 164607137 |
|
Gnao1 |
|
44575 |
6250 |
64111 |
3880 |
39797 |
|
0.03 |
0.01 |
-0.03 |
0.08 |
0.03 |
|
guanine nucleotide-binding protein G(o) subunit alpha
isoform B |
| 6754012 |
|
Gnao1 |
|
37912 |
5828 |
41746 |
3880 |
20787 |
|
0.06 |
0.04 |
0.01 |
0.08 |
0.11 |
|
guanine nucleotide-binding protein G(o) subunit alpha
isoform A |
| 84662745 |
|
Gnaq |
|
1281 |
756 |
31292 |
1735 |
0 |
|
-0.28 |
-0.01 |
-0.11 |
-0.16 |
n.v. |
|
guanine nucleotide-binding protein G(q) subunit alpha |
| 117959921 |
|
Gnas |
|
35788 |
26263 |
79286 |
2202 |
17681 |
|
0.02 |
-0.02 |
-0.1 |
-0.52 |
0.08 |
|
protein GNAS isoform f |
| 117959928 |
|
Gnas |
|
35788 |
26263 |
79286 |
2202 |
17681 |
|
0.02 |
-0.02 |
-0.1 |
-0.52 |
0.08 |
|
protein GNAS isoform GNASS |
| 117959930 |
|
Gnas |
|
35788 |
30624 |
89652 |
2202 |
17681 |
|
0.02 |
-0.05 |
-0.11 |
-0.52 |
0.08 |
|
protein GNAS isoform GNASL |
| 47271396 |
|
Gnas |
|
35788 |
30624 |
89652 |
2202 |
17681 |
|
0.02 |
-0.05 |
-0.11 |
-0.52 |
0.08 |
|
protein GNAS isoform XLas |
| 6680041 |
|
Gnat1 |
|
28667 |
5828 |
37632 |
5083 |
17028 |
|
0.32 |
0.04 |
0.03 |
0.11 |
0.03 |
|
guanine nucleotide-binding protein G(t) subunit alpha-1 |
| 6680043 |
|
Gnat2 |
|
28667 |
5828 |
37632 |
5083 |
17028 |
|
0.32 |
0.04 |
0.03 |
0.11 |
0.03 |
|
guanine nucleotide-binding protein G(t) subunit alpha-2 |
| 124487259 |
|
Gnat3 |
|
28667 |
5828 |
37632 |
5083 |
17028 |
|
0.32 |
0.04 |
0.03 |
0.11 |
0.03 |
|
guanine nucleotide-binding protein G(t) subunit alpha-3 |
| 27532946 |
|
Gnaz |
|
0 |
0 |
1809 |
0 |
0 |
|
n.v. |
n.v. |
-0.18 |
n.v. |
n.v. |
|
guanine nucleotide-binding protein G(z) subunit alpha |
| 6680045 |
|
Gnb1 |
|
207114 |
50599 |
116136 |
19563 |
3084 |
|
0.03 |
0.05 |
-0.11 |
-0.13 |
-0.54 |
|
guanine nucleotide-binding protein G(I)/G(S)/G(T) subunit
beta-1 |
| 13937391 |
|
Gnb2 |
|
229612 |
56985 |
109856 |
29288 |
6372 |
|
0 |
0.04 |
-0.11 |
-0.17 |
-0.53 |
|
guanine nucleotide-binding protein G(I)/G(S)/G(T) subunit
beta-2 |
| 6680047 |
|
Gnb2l1 |
|
595074 |
140250 |
225597 |
901738 |
3930 |
|
0 |
0.18 |
0.24 |
-0.09 |
0.45 |
|
guanine nucleotide-binding protein subunit beta-2-like 1 |
| 20502976 |
|
Gnb3 |
|
87960 |
4112 |
45375 |
1956 |
3084 |
|
-0.02 |
-0.05 |
-0.13 |
-0.46 |
-0.54 |
|
guanine nucleotide-binding protein G(I)/G(S)/G(T) subunit
beta-3 |
| 31542899 |
|
Gnb4 |
|
175152 |
8951 |
69572 |
8104 |
3084 |
|
0.03 |
0.11 |
-0.11 |
-0.28 |
-0.54 |
|
guanine nucleotide-binding protein subunit beta-4 |
| 13384616 |
|
Gng10 |
|
0 |
0 |
139 |
0 |
0 |
|
n.v. |
n.v. |
-0.21 |
n.v. |
n.v. |
|
guanine nucleotide-binding protein G(I)/G(S)/G(O) subunit
gamma-10 precursor |
| 294774560 |
|
Gng12 |
|
28246 |
3741 |
30295 |
115 |
0 |
|
0.04 |
-0.06 |
-0.12 |
-0.08 |
n.v. |
|
guanine nucleotide-binding protein G(I)/G(S)/G(O) subunit
gamma-12 |
| 84579919 |
|
Gng7 |
|
0 |
4 |
148 |
0 |
0 |
|
n.v. |
-0.65 |
-0.08 |
n.v. |
n.v. |
|
guanine nucleotide-binding protein G(I)/G(S)/G(O) subunit
gamma-7 |
| 122937361 |
|
Gnl1 |
|
0 |
344 |
467 |
17525 |
1649 |
|
n.v. |
0.23 |
0.33 |
0.25 |
-0.1 |
|
guanine nucleotide-binding protein-like 1 |
| 240120093 |
|
Gnl2 |
|
0 |
0 |
18 |
0 |
0 |
|
n.v. |
n.v. |
-0.18 |
n.v. |
n.v. |
|
nucleolar GTP-binding protein 2 |
| 30524920 |
|
Gnl3 |
|
165 |
0 |
3 |
393 |
0 |
|
-1.12 |
n.v. |
-0.61 |
0.17 |
n.v. |
|
guanine nucleotide-binding protein-like 3 long isoform |
| 160298207 |
|
Gnpat |
|
0 |
1194 |
1844 |
0 |
0 |
|
n.v. |
0.15 |
-0.29 |
n.v. |
n.v. |
|
dihydroxyacetone phosphate acyltransferase |
| 188219582 |
|
Gnpda1 |
|
0 |
144 |
402 |
13089 |
15036 |
|
n.v. |
0.32 |
0.05 |
0.13 |
-0.18 |
|
glucosamine-6-phosphate isomerase 1 |
| 83999999 |
|
Gnpda2 |
|
0 |
0 |
86 |
2914 |
4434 |
|
n.v. |
n.v. |
-0.76 |
0.16 |
-0.29 |
|
glucosamine-6-phosphate isomerase 2 |
| 9506761 |
|
Gnpnat1 |
|
0 |
52 |
266 |
237 |
8760 |
|
n.v. |
0.52 |
0.29 |
0.55 |
0.31 |
|
glucosamine 6-phosphate N-acetyltransferase |
| 29789239 |
|
Gns |
|
14022 |
16297 |
7840 |
0 |
53183 |
|
0.02 |
-0.13 |
-0.44 |
n.v. |
-0.24 |
|
N-acetylglucosamine-6-sulfatase precursor |
| 30794192 |
|
Golga1 |
|
0 |
1115 |
871 |
0 |
0 |
|
n.v. |
-0.24 |
-0.11 |
n.v. |
n.v. |
|
Golgin subfamily A member 1 |
| 124378030 |
|
Golga2 |
|
7743 |
4467 |
495 |
0 |
0 |
|
-0.01 |
-0.1 |
-0.31 |
n.v. |
n.v. |
|
Golgin subfamily A member 2 isoform b |
| 124378042 |
|
Golga2 |
|
7743 |
4467 |
495 |
0 |
0 |
|
-0.01 |
-0.1 |
-0.31 |
n.v. |
n.v. |
|
Golgin subfamily A member 2 isoform a |
| 31982330 |
|
Golga3 |
|
0 |
0 |
0 |
0 |
718 |
|
n.v. |
n.v. |
n.v. |
n.v. |
1.44 |
|
Golgin subfamily A member 3 |
| 20127150 |
|
Golga4 |
|
860 |
4064 |
1127 |
0 |
1906 |
|
0.37 |
-0.34 |
-0.05 |
n.v. |
-0.08 |
|
Golgin subfamily A member 4 |
| 7305095 |
|
Golga5 |
|
1098 |
0 |
0 |
0 |
0 |
|
-0.54 |
n.v. |
n.v. |
n.v. |
n.v. |
|
Golgin subfamily A member 5 |
| 312222675;7305095 |
|
Golga5 |
|
0 |
2010 |
2008 |
0 |
107 |
|
n.v. |
-0.21 |
-0.01 |
n.v. |
-0.39 |
|
Golgin subfamily A member 5 |
| 109809743 |
|
Golga7 |
|
439 |
198 |
2180 |
196 |
0 |
|
-0.42 |
-1.06 |
-0.08 |
-0.01 |
n.v. |
|
Golgin subfamily A member 7 |
| 226958601 |
|
Golgb1 |
|
0 |
8724 |
56 |
0 |
0 |
|
n.v. |
-0.14 |
-0.11 |
n.v. |
n.v. |
|
golgi autoantigen, golgin subfamily b, macrogolgin 1 |
| 30424814 |
|
Golim4 |
|
0 |
0 |
13 |
0 |
0 |
|
n.v. |
n.v. |
-0.13 |
n.v. |
n.v. |
|
Golgi integral membrane protein 4 |
| 78190502 |
|
Golm1 |
|
2874 |
4317 |
2100 |
0 |
0 |
|
0.15 |
-0.39 |
-0.47 |
n.v. |
n.v. |
|
Golgi membrane protein 1 |
| 14140240 |
|
Golph3 |
|
5620 |
6467 |
459 |
0 |
0 |
|
-0.64 |
-0.43 |
-0.24 |
n.v. |
n.v. |
|
Golgi phosphoprotein 3 |
| 295054274 |
|
Golph3l |
|
0 |
4985 |
236 |
0 |
3052 |
|
n.v. |
-0.14 |
-0.1 |
n.v. |
-0.5 |
|
Golgi phosphoprotein 3-like isoform 1 |
| 295054280 |
|
Golph3l |
|
0 |
5242 |
189 |
0 |
3052 |
|
n.v. |
-0.12 |
-0.1 |
n.v. |
-0.5 |
|
Golgi phosphoprotein 3-like isoform 2 |
| 295054284 |
|
Golph3l |
|
0 |
2386 |
236 |
0 |
1124 |
|
n.v. |
-0.12 |
-0.1 |
n.v. |
0.06 |
|
Golgi phosphoprotein 3-like isoform 3 |
| 13385354 |
|
Golt1b |
|
10855 |
29 |
0 |
106 |
0 |
|
0.01 |
-0.1 |
n.v. |
-0.04 |
n.v. |
|
vesicle transport protein GOT1B |
| 313151170 |
|
Gopc |
|
0 |
0 |
675 |
0 |
15946 |
|
n.v. |
n.v. |
-0.34 |
n.v. |
0.09 |
|
Golgi-associated PDZ and coiled-coil motif-containing
protein isoform a |
| 31543485 |
|
Gopc |
|
0 |
0 |
675 |
0 |
15946 |
|
n.v. |
n.v. |
-0.34 |
n.v. |
0.09 |
|
Golgi-associated PDZ and coiled-coil motif-containing
protein isoform b |
| 30350202 |
|
Gorasp1 |
|
0 |
2 |
0 |
0 |
0 |
|
n.v. |
-0.99 |
n.v. |
n.v. |
n.v. |
|
Golgi reassembly-stacking protein 1 |
| 224967109 |
|
Gorasp2 |
|
0 |
6227 |
2425 |
0 |
16557 |
|
n.v. |
0.18 |
-0.05 |
n.v. |
-0.15 |
|
Golgi reassembly-stacking protein 2 |
| 31542904 |
|
Gosr1 |
|
0 |
4474 |
0 |
16 |
0 |
|
n.v. |
-0.16 |
n.v. |
-0.26 |
n.v. |
|
Golgi SNAP receptor complex member 1 |
| 24528553 |
|
Gosr2 |
|
0 |
217 |
53 |
0 |
0 |
|
n.v. |
-0.12 |
-0.03 |
n.v. |
n.v. |
|
Golgi SNAP receptor complex member 2 |
| 160298209 |
|
Got1 |
|
5986 |
1705 |
21255 |
26448 |
388776 |
|
0.35 |
0.12 |
-0.05 |
0.21 |
0.11 |
|
aspartate aminotransferase, cytoplasmic |
| 6754036 |
|
Got2 |
|
1867342 |
55125 |
24715 |
12671 |
159100 |
|
-0.05 |
-0.09 |
-0.32 |
-0.25 |
-0.29 |
|
aspartate aminotransferase, mitochondrial |
| 6754046 |
|
Gpaa1 |
|
0 |
1042 |
184 |
0 |
0 |
|
n.v. |
-0.67 |
-0.16 |
n.v. |
n.v. |
|
glycosylphosphatidylinositol anchor attachment 1
protein |
| 27754089 |
|
Gpalpp1 |
|
0 |
0 |
0 |
0 |
814 |
|
n.v. |
n.v. |
n.v. |
n.v. |
0.15 |
|
uncharacterized protein KIAA1704 |
| 194473718 |
|
Gpatch11 |
|
0 |
0 |
0 |
0 |
1060 |
|
n.v. |
n.v. |
n.v. |
n.v. |
0.51 |
|
coiled-coil domain-containing protein 75 |
| 27370332 |
|
Gpatch3 |
|
0 |
0 |
95 |
360 |
0 |
|
n.v. |
n.v. |
0.07 |
-0.04 |
n.v. |
|
G patch domain-containing protein 3 |
| 160948594 |
|
Gpatch4 |
|
0 |
0 |
4 |
0 |
0 |
|
n.v. |
n.v. |
0.21 |
n.v. |
n.v. |
|
G patch domain-containing protein 4 |
| 226958329 |
|
Gpatch8 |
|
0 |
509 |
351 |
1130 |
54 |
|
n.v. |
0.12 |
-0.02 |
0.34 |
-0.39 |
|
G patch domain-containing protein 8 |
| 238624186 |
|
Gpc4 |
|
0 |
10 |
0 |
0 |
0 |
|
n.v. |
-0.06 |
n.v. |
n.v. |
n.v. |
|
glypican-4 precursor |
| 119943145 |
|
Gpc6 |
|
0 |
10 |
0 |
0 |
0 |
|
n.v. |
-0.06 |
n.v. |
n.v. |
n.v. |
|
glypican-6 isoform 1 precursor |
| 7106325 |
|
Gpc6 |
|
0 |
10 |
0 |
0 |
0 |
|
n.v. |
-0.06 |
n.v. |
n.v. |
n.v. |
|
glypican-6 isoform 2 precursor |
| 111185942 |
|
Gpcpd1 |
|
0 |
0 |
0 |
0 |
621 |
|
n.v. |
n.v. |
n.v. |
n.v. |
0.3 |
|
glycerophosphocholine phosphodiesterase GPCPD1 isoform
2 |
| 111185947 |
|
Gpcpd1 |
|
0 |
0 |
0 |
0 |
621 |
|
n.v. |
n.v. |
n.v. |
n.v. |
0.3 |
|
glycerophosphocholine phosphodiesterase GPCPD1 isoform
3 |
| 6753966 |
|
Gpd1 |
|
13125 |
26157 |
18890 |
23231 |
260155 |
|
-0.2 |
0.06 |
-0.11 |
0.16 |
0.02 |
|
glycerol-3-phosphate dehydrogenase [NAD(+)], cytoplasmic |
| 257467604 |
|
Gpd1l |
|
0 |
3555 |
2631 |
1915 |
33456 |
|
n.v. |
0.08 |
-0.15 |
0.1 |
0.07 |
|
glycerol-3-phosphate dehydrogenase 1-like protein |
| 224922803 |
|
Gpd2 |
|
195197 |
88252 |
12012 |
0 |
0 |
|
-0.06 |
-0.16 |
-0.45 |
n.v. |
n.v. |
|
glycerol-3-phosphate dehydrogenase, mitochondrial
precursor |
| 269973915 |
|
Gphn |
|
0 |
244 |
2381 |
52396 |
32246 |
|
n.v. |
0.32 |
-0.01 |
0.12 |
-0.07 |
|
gephyrin isoform 2 |
| 269973917 |
|
Gphn |
|
0 |
244 |
2381 |
52396 |
32246 |
|
n.v. |
0.32 |
-0.01 |
0.12 |
-0.07 |
|
gephyrin isoform 1 |
| 254553458 |
|
Gpi1 |
|
97919 |
33406 |
111610 |
253826 |
738035 |
|
0.18 |
0.06 |
-0.02 |
0.17 |
-0.03 |
|
glucose-6-phosphate isomerase |
| 377834554 |
|
Gpi1 |
|
19533 |
10444 |
25971 |
119583 |
31861 |
|
0.17 |
0.1 |
-0.03 |
0.18 |
0.05 |
|
PREDICTED: glucose-6-phosphate isomerase |
| 19526970 |
|
Gpn1 |
|
0 |
0 |
618 |
0 |
1414 |
|
n.v. |
n.v. |
0.3 |
n.v. |
0.07 |
|
GPN-loop GTPase 1 |
| 21312642 |
|
Gpn3 |
|
0 |
0 |
0 |
0 |
1810 |
|
n.v. |
n.v. |
n.v. |
n.v. |
0.02 |
|
GPN-loop GTPase 3 |
| 254692915 |
|
Gpr107 |
|
0 |
0 |
22 |
0 |
0 |
|
n.v. |
n.v. |
-0.54 |
n.v. |
n.v. |
|
protein GPR107 precursor |
| 50428577 |
|
Gpr126 |
|
0 |
0 |
129 |
0 |
0 |
|
n.v. |
n.v. |
-0.65 |
n.v. |
n.v. |
|
G-protein coupled receptor 126 precursor |
| 226442795 |
|
Gpr39 |
|
0 |
0 |
129 |
0 |
0 |
|
n.v. |
n.v. |
0.08 |
n.v. |
n.v. |
|
G-protein coupled receptor 39 |
| 31982718 |
|
Gpr56 |
|
2252 |
8697 |
10695 |
516 |
0 |
|
-0.1 |
-0.05 |
-0.06 |
-0.61 |
n.v. |
|
G-protein coupled receptor 56 precursor |
| 21312914 |
|
Gpr89 |
|
0 |
0 |
89 |
0 |
0 |
|
n.v. |
n.v. |
0.05 |
n.v. |
n.v. |
|
Golgi pH regulator |
| 153791474 |
|
Gpr98 |
|
0 |
0 |
852 |
0 |
0 |
|
n.v. |
n.v. |
0.06 |
n.v. |
n.v. |
|
G-protein coupled receptor 98 precursor |
| 225543465 |
|
Gprc5a |
|
5876 |
11258 |
41716 |
3029 |
3309 |
|
0.46 |
-0.02 |
-0.46 |
-1.8 |
-1.33 |
|
retinoic acid-induced protein 3 |
| 160333231 |
|
Gprc5c |
|
10361 |
10876 |
97110 |
467 |
236 |
|
0.41 |
-0.09 |
-0.34 |
-0.37 |
-1.81 |
|
G-protein coupled receptor family C group 5 member C
isoform a precursor |
| 160333233 |
|
Gprc5c |
|
10361 |
10876 |
96395 |
467 |
236 |
|
-1.27 |
-0.09 |
-0.36 |
-0.37 |
-1.81 |
|
G-protein coupled receptor family C group 5 member C
isoform b precursor |
| 295424137 |
|
Gps1 |
|
0 |
1626 |
3345 |
97678 |
10602 |
|
n.v. |
0.22 |
-0.05 |
0.12 |
0.03 |
|
COP9 signalosome complex subunit 1 isoform 1 |
| 295424139 |
|
Gps1 |
|
0 |
1626 |
3345 |
97130 |
8171 |
|
n.v. |
0.22 |
-0.05 |
0.13 |
0.02 |
|
COP9 signalosome complex subunit 1 isoform 2 |
| 33413404 |
|
Gpt |
|
0 |
0 |
0 |
0 |
11663 |
|
n.v. |
n.v. |
n.v. |
n.v. |
-0.19 |
|
alanine aminotransferase 1 |
| 84871986 |
|
Gpx1 |
|
714 |
19120 |
7864 |
11222 |
145853 |
|
0.14 |
-0.06 |
-0.04 |
0.03 |
-0.01 |
|
glutathione peroxidase 1 |
| 90903233 |
|
Gpx4 |
|
146 |
7548 |
9937 |
65967 |
15411 |
|
0.13 |
0.15 |
0.03 |
0.19 |
0.08 |
|
phospholipid hydroperoxide glutathione peroxidase,
nuclear isoform 1 |
| 90903235 |
|
Gpx4 |
|
146 |
7548 |
9937 |
65967 |
15411 |
|
0.13 |
0.15 |
0.03 |
0.19 |
0.08 |
|
phospholipid hydroperoxide glutathione peroxidase,
nuclear isoform 2 precursor |
| 27369870 |
|
Gramd4 |
|
348 |
0 |
29 |
0 |
0 |
|
0.43 |
n.v. |
-0.57 |
n.v. |
n.v. |
|
GRAM domain-containing protein 4 isoform 1 |
| 329663552 |
|
Gramd4 |
|
348 |
0 |
29 |
0 |
0 |
|
0.43 |
n.v. |
-0.57 |
n.v. |
n.v. |
|
GRAM domain-containing protein 4 isoform 2 |
| 6680083 |
|
Grb2 |
|
0 |
3016 |
3557 |
1023 |
15368 |
|
n.v. |
0.01 |
-0.05 |
0.06 |
0.03 |
|
growth factor receptor-bound protein 2 |
| 6754066 |
|
Grb7 |
|
0 |
962 |
1471 |
7981 |
546 |
|
n.v. |
0.02 |
-0.07 |
0.01 |
0.41 |
|
growth factor receptor-bound protein 7 |
| 7305107 |
|
Grcc10 |
|
0 |
564 |
757 |
0 |
4112 |
|
n.v. |
0.18 |
0.15 |
n.v. |
-0.05 |
|
protein C10 |
| 46810275 |
|
Grhl2 |
|
0 |
0 |
0 |
98 |
0 |
|
n.v. |
n.v. |
n.v. |
-0.79 |
n.v. |
|
grainyhead-like protein 2 homolog |
| 17933768 |
|
Grhpr |
|
0 |
11774 |
3152 |
6221 |
98988 |
|
n.v. |
0.03 |
-0.05 |
0.17 |
0.08 |
|
glyoxylate reductase/hydroxypyruvate reductase |
| 6680091 |
|
Grid2 |
|
0 |
0 |
133 |
0 |
0 |
|
n.v. |
n.v. |
0.01 |
n.v. |
n.v. |
|
glutamate receptor delta-2 subunit precursor |
| 144922606 |
|
Grin2d |
|
0 |
0 |
76 |
0 |
0 |
|
n.v. |
n.v. |
-2.13 |
n.v. |
n.v. |
|
glutamate receptor ionotropic, NMDA 2D precursor |
| 46592839 |
|
Gripap1 |
|
0 |
0 |
0 |
0 |
7743 |
|
n.v. |
n.v. |
n.v. |
n.v. |
-0.01 |
|
GRIP1-associated protein 1 |
| 75677442 |
|
Grlf1 |
|
0 |
0 |
0 |
0 |
2452 |
|
n.v. |
n.v. |
n.v. |
n.v. |
0.05 |
|
rho GTPase-activating protein 35 |
| 224967126 |
|
Grn |
|
2801 |
4860 |
5804 |
1596 |
6908 |
|
0.07 |
-0.13 |
-0.28 |
-0.22 |
-0.19 |
|
granulins precursor |
| 13277394 |
|
Grpel1 |
|
23432 |
19892 |
82 |
0 |
0 |
|
-0.07 |
-0.14 |
-0.18 |
n.v. |
n.v. |
|
grpE protein homolog 1, mitochondrial precursor |
| 29789124 |
|
Grpel2 |
|
0 |
111 |
0 |
0 |
0 |
|
n.v. |
-0.49 |
n.v. |
n.v. |
n.v. |
|
grpE protein homolog 2, mitochondrial precursor |
| 148596934 |
|
Grsf1 |
|
0 |
1645 |
0 |
0 |
0 |
|
n.v. |
-0.33 |
n.v. |
n.v. |
n.v. |
|
G-rich sequence factor 1 isoform 1 |
| 148596982 |
|
Grsf1 |
|
0 |
1645 |
0 |
0 |
0 |
|
n.v. |
-0.33 |
n.v. |
n.v. |
n.v. |
|
G-rich sequence factor 1 isoform 2 |
| 163937861 |
|
Grwd1 |
|
0 |
954 |
1386 |
4682 |
0 |
|
n.v. |
-0.03 |
0.12 |
0.15 |
n.v. |
|
glutamate-rich WD repeat-containing protein 1 |
| 13878199 |
|
Gsdmc |
|
0 |
553 |
0 |
0 |
0 |
|
n.v. |
0.49 |
n.v. |
n.v. |
n.v. |
|
gasdermin-C |
| 269954726;269954702 |
|
Gsdmc2 |
|
199078 |
0 |
61440 |
0 |
0 |
|
0.58 |
n.v. |
0.34 |
n.v. |
n.v. |
|
gasdermin-C2 |
| 269954702 |
|
Gsdmc2 |
|
0 |
55695 |
0 |
285308 |
81521 |
|
n.v. |
0.38 |
n.v. |
0.39 |
0.45 |
|
gasdermin-C2 |
| 226053537 |
|
Gsdmc3 |
|
151757 |
44681 |
47284 |
201348 |
68005 |
|
0.61 |
0.38 |
0.34 |
0.42 |
0.47 |
|
gasdermin-C3 |
| 254675345 |
|
Gsdmc4 |
|
122449 |
29849 |
33495 |
178789 |
39315 |
|
0.62 |
0.38 |
0.35 |
0.44 |
0.47 |
|
gasdermin-C4 |
| 72384361 |
|
Gsk3a |
|
0 |
543 |
25 |
139 |
4541 |
|
n.v. |
0.44 |
-0.07 |
0.67 |
0.5 |
|
glycogen synthase kinase-3 alpha |
| 9790077 |
|
Gsk3b |
|
0 |
2173 |
3805 |
6573 |
35352 |
|
n.v. |
0.09 |
0 |
0.1 |
0.14 |
|
glycogen synthase kinase-3 beta |
| 115292450 |
|
Gskip |
|
0 |
0 |
0 |
0 |
1092 |
|
n.v. |
n.v. |
n.v. |
n.v. |
0.15 |
|
GSK3-beta interaction protein |
| 329755243;329755239 |
|
Gsn |
|
48914 |
0 |
66034 |
0 |
0 |
|
-0.01 |
n.v. |
-0.03 |
n.v. |
n.v. |
|
gelsolin isoform 2 |
| 329755239 |
|
Gsn |
|
0 |
8166 |
0 |
117381 |
351047 |
|
n.v. |
0.26 |
n.v. |
-0.03 |
0.14 |
|
gelsolin isoform 2 |
| 28916693 |
|
Gsn |
|
48914 |
8166 |
65779 |
112069 |
280289 |
|
-0.01 |
0.26 |
-0.03 |
-0.04 |
0.14 |
|
gelsolin isoform 1 precursor |
| 194018529 |
|
Gspt1 |
|
275 |
81 |
11783 |
13138 |
88375 |
|
0.14 |
0.23 |
0.07 |
0.02 |
0.02 |
|
eukaryotic peptide chain release factor GTP-binding
subunit ERF3A isoform 1 |
| 194018533 |
|
Gspt1 |
|
275 |
81 |
11783 |
13138 |
88375 |
|
0.14 |
0.23 |
0.07 |
0.02 |
0.02 |
|
eukaryotic peptide chain release factor GTP-binding
subunit ERF3A isoform 2 |
| 58331156 |
|
Gspt2 |
|
0 |
81 |
6588 |
0 |
49232 |
|
n.v. |
0.23 |
0.09 |
n.v. |
0.01 |
|
eukaryotic peptide chain release factor GTP-binding
subunit ERF3B |
| 160298213 |
|
Gsr |
|
30498 |
18161 |
37959 |
33995 |
459866 |
|
0.12 |
0.05 |
-0.05 |
0.29 |
-0.07 |
|
glutathione reductase, mitochondrial precursor |
| 6680117 |
|
Gss |
|
0 |
184 |
1570 |
655 |
44262 |
|
n.v. |
-0.11 |
-0.04 |
0.3 |
0.11 |
|
glutathione synthetase |
| 154350202 |
|
Gsta1 |
|
2911 |
299 |
1441 |
2808 |
44037 |
|
0.3 |
0.22 |
0.03 |
-0.96 |
-0.08 |
|
glutathione S-transferase A1 |
| 50263046 |
|
Gsta2 |
|
2911 |
299 |
1441 |
2808 |
4477 |
|
0.3 |
0.22 |
0.03 |
-0.96 |
-0.17 |
|
glutathione S-transferase A2 |
| 31981724 |
|
Gsta3 |
|
2911 |
501 |
6183 |
3503 |
85151 |
|
0.3 |
0.26 |
0.05 |
-0.38 |
-0.08 |
|
glutathione S-transferase A3 |
| 160298217 |
|
Gsta4 |
|
5748 |
22011 |
16676 |
15397 |
395149 |
|
0.32 |
0.04 |
0.15 |
0.12 |
0.04 |
|
glutathione S-transferase A4 |
| 21313138 |
|
Gstk1 |
|
1556 |
8154 |
2341 |
0 |
0 |
|
-0.25 |
-0.23 |
-0.27 |
n.v. |
n.v. |
|
glutathione S-transferase kappa 1 |
| 6754084 |
|
Gstm1 |
|
627841 |
69679 |
239660 |
221673 |
1949387 |
|
0.01 |
0.02 |
-0.09 |
0.04 |
-0.05 |
|
glutathione S-transferase Mu 1 |
| 6680121 |
|
Gstm2 |
|
592474 |
55687 |
155280 |
152571 |
1155952 |
|
0.14 |
0.12 |
0 |
0.16 |
0.08 |
|
glutathione S-transferase Mu 2 |
| 33468899 |
|
Gstm3 |
|
119502 |
26536 |
51794 |
104538 |
696332 |
|
0.18 |
0.04 |
-0.03 |
0.04 |
-0.03 |
|
glutathione S-transferase Mu 3 |
| 238018082 |
|
Gstm4 |
|
395410 |
3714 |
49457 |
8611 |
54147 |
|
0.01 |
0.05 |
-0.06 |
-0.01 |
-0.06 |
|
glutathione S-transferase mu 4 isoform 2 |
| 28076911 |
|
Gstm4 |
|
396783 |
16496 |
93275 |
23182 |
135711 |
|
0.01 |
0.06 |
-0.04 |
0.12 |
0.01 |
|
glutathione S-transferase mu 4 isoform 1 |
| 6754086 |
|
Gstm5 |
|
272119 |
2954 |
68748 |
3618 |
71839 |
|
0.02 |
0.05 |
-0.05 |
0.25 |
-0.02 |
|
glutathione S-transferase Mu 5 |
| 113680506 |
|
Gstm6 |
|
62076 |
16704 |
9970 |
62087 |
414811 |
|
0.19 |
0.12 |
0.02 |
0.1 |
0.22 |
|
glutathione S-transferase Mu 6 |
| 113679874 |
|
Gstm7 |
|
484121 |
29897 |
95963 |
88969 |
919186 |
|
0.12 |
0.06 |
-0.03 |
0.08 |
0.03 |
|
glutathione S-transferase Mu 7 |
| 6754090 |
|
Gsto1 |
|
19990 |
6390 |
14583 |
12810 |
509644 |
|
0.09 |
0.27 |
0.11 |
0.14 |
0.12 |
|
glutathione S-transferase omega-1 |
| 313151238;225007547 |
|
Gsto2 |
|
0 |
0 |
0 |
0 |
43202 |
|
n.v. |
n.v. |
n.v. |
n.v. |
0.08 |
|
glutathione S-transferase omega-2 |
| 10092608 |
|
Gstp1 |
|
81169 |
33780 |
58730 |
47411 |
184396 |
|
0.28 |
0.1 |
-0.04 |
0.15 |
0.09 |
|
glutathione S-transferase P 1 |
| 32401425 |
|
Gstp2 |
|
74286 |
17855 |
24238 |
37351 |
107074 |
|
0.22 |
0.17 |
-0.02 |
0.14 |
0.12 |
|
glutathione S-transferase P 2 |
| 160298219 |
|
Gstt1 |
|
0 |
3793 |
1130 |
9659 |
47218 |
|
n.v. |
0.37 |
0.08 |
0.3 |
0.17 |
|
glutathione S-transferase theta-1 |
| 158081796 |
|
Gstt2 |
|
3643 |
4624 |
3928 |
5730 |
84262 |
|
0.38 |
0.01 |
-0.07 |
0 |
-0.02 |
|
glutathione S-transferase theta-2 |
| 21536248 |
|
Gstt3 |
|
6865 |
12700 |
5458 |
5108 |
133323 |
|
0.12 |
0.14 |
-0.01 |
0.07 |
0.11 |
|
glutathione S-transferase, theta 3 |
| 357527382 |
|
Gstz1 |
|
238 |
1662 |
1160 |
925 |
9017 |
|
-0.19 |
-0.11 |
-0.05 |
-0.25 |
0 |
|
maleylacetoacetate isomerase isoform 2 |
| 6754092 |
|
Gstz1 |
|
1556 |
2321 |
1356 |
925 |
17821 |
|
0.01 |
-0.1 |
-0.02 |
-0.25 |
0.02 |
|
maleylacetoacetate isomerase isoform 1 |
| 226958572 |
|
Gtf2a1 |
|
0 |
0 |
0 |
0 |
2806 |
|
n.v. |
n.v. |
n.v. |
n.v. |
0.15 |
|
transcription initiation factor IIA subunit 1 isoform 1 |
| 30141908 |
|
Gtf2a1 |
|
0 |
0 |
0 |
0 |
2485 |
|
n.v. |
n.v. |
n.v. |
n.v. |
0.03 |
|
transcription initiation factor IIA subunit 1 isoform 2 |
| 530719548 |
|
Gtf2a2 |
|
1043 |
0 |
0 |
0 |
0 |
|
-0.01 |
n.v. |
n.v. |
n.v. |
n.v. |
|
transcription initiation factor IIA subunit 2 isoform 2 |
| 87299617 |
|
Gtf2a2 |
|
1043 |
159 |
657 |
753 |
450 |
|
-0.01 |
0.05 |
-0.04 |
0.08 |
0.33 |
|
transcription initiation factor IIA subunit 2 isoform 1 |
| 21704076 |
|
Gtf2b |
|
0 |
1399 |
1361 |
15815 |
10249 |
|
n.v. |
0.1 |
0.04 |
0.05 |
-0.02 |
|
transcription initiation factor IIB |
| 21312660 |
|
Gtf2e1 |
|
0 |
127 |
59 |
2816 |
996 |
|
n.v. |
-0.29 |
-0.36 |
0.17 |
-0.36 |
|
general transcription factor IIE subunit 1 |
| 268838606 |
|
Gtf2e2 |
|
0 |
63 |
12 |
237 |
0 |
|
n.v. |
-0.05 |
1.85 |
-0.18 |
n.v. |
|
general transcription factor IIE subunit 2 |
| 20270031 |
|
Gtf2f1 |
|
55 |
3002 |
4820 |
2096 |
3684 |
|
-0.23 |
0.14 |
0.1 |
0.19 |
0.07 |
|
general transcription factor IIF subunit 1 |
| 39930425 |
|
Gtf2f2 |
|
714 |
2925 |
1860 |
4068 |
0 |
|
0.01 |
0.39 |
0.16 |
0.16 |
n.v. |
|
general transcription factor IIF subunit 2 |
| 6754094 |
|
Gtf2h4 |
|
0 |
0 |
69 |
0 |
0 |
|
n.v. |
n.v. |
-0.44 |
n.v. |
n.v. |
|
general transcription factor IIH subunit 4 |
| 124001570 |
|
Gtf2i |
|
5657 |
480 |
1589 |
7654 |
18238 |
|
-0.02 |
0.02 |
-0.15 |
-0.27 |
-0.14 |
|
general transcription factor II-I isoform 4 |
| 124001572 |
|
Gtf2i |
|
5657 |
480 |
1589 |
7654 |
18238 |
|
-0.02 |
0.02 |
-0.15 |
-0.27 |
-0.14 |
|
general transcription factor II-I isoform 2 |
| 124001574 |
|
Gtf2i |
|
5657 |
480 |
1589 |
7654 |
18238 |
|
-0.02 |
0.02 |
-0.15 |
-0.27 |
-0.14 |
|
general transcription factor II-I isoform 1 |
| 124001576 |
|
Gtf2i |
|
5657 |
480 |
1589 |
7654 |
18238 |
|
-0.02 |
0.02 |
-0.15 |
-0.27 |
-0.14 |
|
general transcription factor II-I isoform 3 |
| 124001578 |
|
Gtf2i |
|
5657 |
480 |
1589 |
7654 |
18238 |
|
-0.02 |
0.02 |
-0.15 |
-0.27 |
-0.14 |
|
general transcription factor II-I isoform 5 |
| 75677510 |
|
Gtf3c3 |
|
110 |
0 |
4 |
0 |
0 |
|
0.32 |
n.v. |
0.05 |
n.v. |
n.v. |
|
general transcription factor 3C polypeptide 3 |
| 260436918 |
|
Gtf3c4 |
|
0 |
167 |
0 |
0 |
0 |
|
n.v. |
-3.09 |
n.v. |
n.v. |
n.v. |
|
general transcription factor 3C polypeptide 4 isoform 1 |
| 260447060 |
|
Gtf3c4 |
|
0 |
167 |
0 |
0 |
0 |
|
n.v. |
-3.09 |
n.v. |
n.v. |
n.v. |
|
general transcription factor 3C polypeptide 4 isoform 2 |
| 225543576 |
|
Gtl3 |
|
1959 |
1008 |
1253 |
458 |
7968 |
|
0.35 |
0.34 |
0.16 |
0.24 |
0.02 |
|
UPF0468 protein C16orf80 homolog |
| 70778897 |
|
Gtpbp1 |
|
0 |
1703 |
5168 |
32857 |
2688 |
|
n.v. |
0.13 |
0.14 |
0.23 |
0.13 |
|
GTP-binding protein 1 |
| 225543388 |
|
Gtpbp2 |
|
0 |
0 |
149 |
0 |
0 |
|
n.v. |
n.v. |
-0.11 |
n.v. |
n.v. |
|
GTP-binding protein 2 isoform 1 |
| 225543394 |
|
Gtpbp2 |
|
0 |
0 |
149 |
0 |
0 |
|
n.v. |
n.v. |
-0.11 |
n.v. |
n.v. |
|
GTP-binding protein 2 isoform 2 |
| 33414589 |
|
Gtpbp3 |
|
0 |
138 |
0 |
0 |
0 |
|
n.v. |
0.62 |
n.v. |
n.v. |
n.v. |
|
tRNA modification GTPase GTPBP3, mitochondrial precursor |
| 31560110 |
|
Gtpbp4 |
|
0 |
0 |
461 |
9675 |
0 |
|
n.v. |
n.v. |
-0.06 |
-0.2 |
n.v. |
|
nucleolar GTP-binding protein 1 |
| 165972313 |
|
Gtpbp6 |
|
0 |
11398 |
0 |
0 |
0 |
|
n.v. |
-0.21 |
n.v. |
n.v. |
n.v. |
|
putative GTP-binding protein 6 |
| 21313623 |
|
Gtpbp8 |
|
0 |
190 |
0 |
0 |
0 |
|
n.v. |
0.05 |
n.v. |
n.v. |
n.v. |
|
GTP-binding protein 8 isoform 1 |
| 7305119 |
|
Gtse1 |
|
0 |
0 |
0 |
98 |
0 |
|
n.v. |
n.v. |
n.v. |
0.68 |
n.v. |
|
G2 and S phase-expressed protein 1 |
| 194688157 |
|
Gucy2d |
|
0 |
0 |
28 |
0 |
0 |
|
n.v. |
n.v. |
-0.18 |
n.v. |
n.v. |
|
olfactory guanylyl cyclase GC-D |
| 56119098 |
|
Gucy2f |
|
3661 |
668 |
5201 |
6917 |
17360 |
|
-0.03 |
0.19 |
-0.04 |
0.08 |
0.1 |
|
retinal guanylyl cyclase 2 precursor |
| 226874887 |
|
Guk1 |
|
0 |
0 |
35 |
0 |
461 |
|
n.v. |
n.v. |
0.2 |
n.v. |
0.36 |
|
guanylate kinase isoform 1 |
| 226874891 |
|
Guk1 |
|
0 |
0 |
35 |
0 |
461 |
|
n.v. |
n.v. |
0.2 |
n.v. |
0.36 |
|
guanylate kinase isoform 2 |
| 6754098 |
|
Gusb |
|
33116 |
38692 |
5988 |
57422 |
353 |
|
0.04 |
-0.06 |
-0.15 |
-0.17 |
-0.41 |
|
beta-glucuronidase precursor |
| 115270958 |
|
Gvin1 |
|
0 |
0 |
31 |
0 |
0 |
|
n.v. |
n.v. |
0.63 |
n.v. |
n.v. |
|
interferon-induced very large GTPase 1 |
| 85701786 |
|
Gxylt1 |
|
0 |
307 |
25 |
0 |
0 |
|
n.v. |
-0.15 |
-0.37 |
n.v. |
n.v. |
|
glucoside xylosyltransferase 1 |
| 46909579 |
|
Gyk |
|
0 |
0 |
0 |
0 |
2849 |
|
n.v. |
n.v. |
n.v. |
n.v. |
0.08 |
|
glycerol kinase isoform 2 |
| 6680139 |
|
Gyk |
|
0 |
0 |
0 |
0 |
2849 |
|
n.v. |
n.v. |
n.v. |
n.v. |
0.08 |
|
glycerol kinase isoform 1 |
| 49355801 |
|
Gykl1 |
|
0 |
0 |
0 |
0 |
1157 |
|
n.v. |
n.v. |
n.v. |
n.v. |
0.09 |
|
glycerol kinase-like 1 |
| 262231828 |
|
Gyltl1b |
|
0 |
177 |
0 |
0 |
0 |
|
n.v. |
-0.48 |
n.v. |
n.v. |
n.v. |
|
glycosyltransferase-like protein LARGE2 isoform 1
precursor |
| 262231830 |
|
Gyltl1b |
|
0 |
177 |
0 |
0 |
0 |
|
n.v. |
-0.48 |
n.v. |
n.v. |
n.v. |
|
glycosyltransferase-like protein LARGE2 isoform 2
precursor |
| 31560022 |
|
Gys1 |
|
0 |
0 |
0 |
43596 |
2442 |
|
n.v. |
n.v. |
n.v. |
-0.05 |
-0.78 |
|
glycogen [starch] synthase, muscle |
| 37674207 |
|
Gzf1 |
|
0 |
0 |
1 |
0 |
0 |
|
n.v. |
n.v. |
-0.44 |
n.v. |
n.v. |
|
GDNF-inducible zinc finger protein 1 |
| 227116335 |
|
H13 |
|
0 |
0 |
1007 |
0 |
0 |
|
n.v. |
n.v. |
-0.36 |
n.v. |
n.v. |
|
minor histocompatibility antigen H13 isoform 1 |
| 227116337 |
|
H13 |
|
0 |
0 |
1007 |
0 |
0 |
|
n.v. |
n.v. |
-0.36 |
n.v. |
n.v. |
|
minor histocompatibility antigen H13 isoform 3 |
| 227116339 |
|
H13 |
|
0 |
0 |
1007 |
0 |
0 |
|
n.v. |
n.v. |
-0.36 |
n.v. |
n.v. |
|
minor histocompatibility antigen H13 isoform 4 |
| 18034682 |
|
H13 |
|
0 |
138 |
1086 |
49 |
0 |
|
n.v. |
-0.39 |
-0.48 |
0.08 |
n.v. |
|
minor histocompatibility antigen H13 isoform 2 |
| 31560697 |
|
H1f0 |
|
384353 |
647 |
2246 |
630 |
0 |
|
-0.07 |
-0.06 |
-0.41 |
-0.4 |
n.v. |
|
histone H1.0 |
| 257196238 |
|
H1fnt |
|
0 |
555 |
0 |
0 |
0 |
|
n.v. |
-0.12 |
n.v. |
n.v. |
n.v. |
|
testis-specific H1 histone |
| 29244126 |
|
H2afj |
|
11324321 |
115502 |
91304 |
353641 |
16096 |
|
-0.08 |
-0.17 |
-0.35 |
-0.54 |
-0.52 |
|
histone H2A.J |
| 256773209 |
|
H2afv |
|
11342187 |
125234 |
94469 |
438263 |
16096 |
|
-0.1 |
-0.12 |
-0.36 |
-0.35 |
-0.52 |
|
histone H2A.V |
| 7106331 |
|
H2afx |
|
10798370 |
115258 |
91061 |
399349 |
16096 |
|
-0.09 |
-0.17 |
-0.36 |
-0.4 |
-0.52 |
|
histone H2A.x |
| 283945572 |
|
H2afy |
|
258170 |
0 |
0 |
2865 |
0 |
|
-0.06 |
n.v. |
n.v. |
-0.43 |
n.v. |
|
core histone macro-H2A.1 isoform 2 |
| 283945575 |
|
H2afy |
|
258170 |
0 |
0 |
2865 |
0 |
|
-0.06 |
n.v. |
n.v. |
-0.43 |
n.v. |
|
core histone macro-H2A.1 isoform 3 |
| 283945579 |
|
H2afy |
|
258170 |
0 |
0 |
2865 |
0 |
|
-0.06 |
n.v. |
n.v. |
-0.43 |
n.v. |
|
core histone macro-H2A.1 isoform 4 |
| 41152517 |
|
H2afy |
|
258170 |
0 |
0 |
2865 |
0 |
|
-0.06 |
n.v. |
n.v. |
-0.43 |
n.v. |
|
core histone macro-H2A.1 isoform 1 |
| 46250738 |
|
H2afy2 |
|
92281 |
0 |
0 |
2726 |
0 |
|
-0.1 |
n.v. |
n.v. |
-0.42 |
n.v. |
|
core histone macro-H2A.2 |
| 7949045 |
|
H2afz |
|
11342187 |
125234 |
94469 |
434244 |
16096 |
|
-0.1 |
-0.12 |
-0.36 |
-0.35 |
-0.52 |
|
histone H2A.Z |
| 133778955 |
|
H2-D1 |
|
2233 |
797 |
623 |
0 |
0 |
|
-0.1 |
-0.19 |
-0.13 |
n.v. |
n.v. |
|
H-2 class I histocompatibility antigen, D-B alpha chain
precursor |
| 133922588 |
|
H2-K1 |
|
4302 |
2545 |
1479 |
0 |
0 |
|
0.01 |
-0.42 |
-0.25 |
n.v. |
n.v. |
|
H-2 class I histocompatibility antigen, K-W28 alpha chain
isoform 1 precursor |
| 6754128;297747288 |
|
H2-Ke2 |
|
0 |
0 |
440 |
0 |
0 |
|
n.v. |
n.v. |
0.39 |
n.v. |
n.v. |
|
prefoldin subunit 6 |
| 297747288 |
|
H2-Ke2 |
|
0 |
0 |
0 |
0 |
3909 |
|
n.v. |
n.v. |
n.v. |
n.v. |
0.2 |
|
prefoldin subunit 6 |
| 157951743 |
|
H2-Ke6 |
|
13089 |
11709 |
7 |
647 |
0 |
|
-0.27 |
-0.12 |
-0.22 |
-0.51 |
n.v. |
|
estradiol 17-beta-dehydrogenase 8 |
| 392357527 |
|
H2-L |
|
2233 |
349 |
623 |
0 |
0 |
|
-0.1 |
-0.34 |
-0.13 |
n.v. |
n.v. |
|
histocompatibility 2, D region locus L |
| 160333390 |
|
H2-Q1 |
|
0 |
0 |
234 |
0 |
0 |
|
n.v. |
n.v. |
-0.31 |
n.v. |
n.v. |
|
histocompatibility 2, Q region locus 1 precursor |
| 6754132 |
|
H2-Q10 |
|
0 |
0 |
234 |
0 |
0 |
|
n.v. |
n.v. |
-0.31 |
n.v. |
n.v. |
|
H-2 class I histocompatibility antigen, Q10 alpha chain
precursor |
| 72535146 |
|
H2-Q2 |
|
2233 |
0 |
389 |
0 |
0 |
|
-0.1 |
n.v. |
0 |
n.v. |
n.v. |
|
histocompatibility 2, Q region locus 2 precursor |
| 219521935 |
|
H2-Q4 |
|
3167 |
349 |
623 |
0 |
0 |
|
0.18 |
-0.34 |
-0.13 |
n.v. |
n.v. |
|
histocompatibility 2, Q region locus 4 precursor |
| 46559400 |
|
H2-Q6 |
|
2233 |
0 |
623 |
0 |
0 |
|
-0.1 |
n.v. |
-0.13 |
n.v. |
n.v. |
|
histocompatibility 2, Q region locus 6 precursor |
| 310616733 |
|
H2-Q7 |
|
2233 |
0 |
623 |
0 |
0 |
|
-0.1 |
n.v. |
-0.13 |
n.v. |
n.v. |
|
H-2 class I histocompatibility antigen, Q7 alpha chain
isoform 1 precursor |
| 310616735 |
|
H2-Q7 |
|
2233 |
0 |
623 |
0 |
0 |
|
-0.1 |
n.v. |
-0.13 |
n.v. |
n.v. |
|
H-2 class I histocompatibility antigen, Q7 alpha chain
isoform 2 precursor |
| 310616737 |
|
H2-Q7 |
|
2233 |
0 |
389 |
0 |
0 |
|
-0.1 |
n.v. |
0 |
n.v. |
n.v. |
|
H-2 class I histocompatibility antigen, Q7 alpha chain
isoform 3 precursor |
| 389595436 |
|
H2-Q8 |
|
2233 |
0 |
623 |
0 |
0 |
|
-0.1 |
n.v. |
-0.13 |
n.v. |
n.v. |
|
H-2 class I histocompatibility antigen, Q8 alpha chain
precursor |
| 319803125 |
|
H2-Q9 |
|
2233 |
0 |
623 |
0 |
0 |
|
-0.1 |
n.v. |
-0.13 |
n.v. |
n.v. |
|
H-2 class I histocompatibility antigen, Q9 alpha chain
precursor |
| 407260856 |
|
H2-T23 |
|
0 |
0 |
234 |
0 |
0 |
|
n.v. |
n.v. |
-0.31 |
n.v. |
n.v. |
|
PREDICTED: h-2 class I histocompatibility antigen, D-37
alpha chain |
| 6754148 |
|
H2-T23 |
|
2233 |
0 |
389 |
0 |
0 |
|
-0.1 |
n.v. |
0 |
n.v. |
n.v. |
|
H-2 class I histocompatibility antigen, D-37 alpha chain
precursor |
| 6680159 |
|
H3f3a |
|
0 |
39673 |
75553 |
374301 |
19995 |
|
n.v. |
-0.22 |
-0.42 |
-0.34 |
-0.7 |
|
histone H3.3 |
| 6680161 |
|
H3f3b |
|
3752513 |
0 |
0 |
0 |
0 |
|
-0.07 |
n.v. |
n.v. |
n.v. |
n.v. |
|
histone H3.3 |
| 82886797 |
|
H3f3c |
|
3752513 |
39673 |
75553 |
374301 |
19995 |
|
-0.07 |
-0.22 |
-0.42 |
-0.34 |
-0.7 |
|
PREDICTED: histone H3.3C-like |
| 31982147 |
|
H6pd |
|
43568 |
17107 |
12270 |
23239 |
54651 |
|
0 |
-0.31 |
-0.19 |
0.17 |
-0.17 |
|
GDH/6PGL endoplasmic bifunctional protein precursor |
| 283436216 |
|
Hace1 |
|
0 |
0 |
0 |
0 |
32 |
|
n.v. |
n.v. |
n.v. |
n.v. |
0.39 |
|
E3 ubiquitin-protein ligase HACE1 |
| 31560355 |
|
Hacl1 |
|
0 |
0 |
274 |
0 |
0 |
|
n.v. |
n.v. |
-0.33 |
n.v. |
n.v. |
|
2-hydroxyacyl-CoA lyase 1 |
| 111038118 |
|
Hadh |
|
22187 |
17700 |
634 |
0 |
1135 |
|
0.01 |
-0.1 |
-0.28 |
n.v. |
-0.77 |
|
hydroxyacyl-coenzyme A dehydrogenase, mitochondrial
precursor |
| 33859811 |
|
Hadha |
|
457101 |
33281 |
10603 |
17353 |
1103 |
|
0.02 |
-0.12 |
-0.22 |
-0.3 |
-1.35 |
|
trifunctional enzyme subunit alpha, mitochondrial
precursor |
| 21704100 |
|
Hadhb |
|
182786 |
82315 |
7991 |
0 |
932 |
|
0.03 |
-0.04 |
-0.18 |
n.v. |
-1.03 |
|
trifunctional enzyme subunit beta, mitochondrial
precursor |
| 227499238 |
|
Hagh |
|
3789 |
2747 |
1642 |
1604 |
39764 |
|
-0.16 |
0.09 |
-0.06 |
0.02 |
0.07 |
|
hydroxyacylglutathione hydrolase, mitochondrial isoform 1
precursor |
| 227499240 |
|
Hagh |
|
3789 |
2747 |
1642 |
1604 |
39764 |
|
-0.16 |
0.09 |
-0.06 |
0.02 |
0.07 |
|
hydroxyacylglutathione hydrolase, mitochondrial isoform
2 |
| 406855413 |
|
Haghl |
|
0 |
0 |
59 |
0 |
0 |
|
n.v. |
n.v. |
-0.2 |
n.v. |
n.v. |
|
hydroxyacylglutathione hydrolase-like protein isoform
b |
| 251823891 |
|
Hars |
|
0 |
3561 |
3259 |
14652 |
110158 |
|
n.v. |
0.07 |
0.23 |
0.19 |
0.01 |
|
histidine--tRNA ligase, cytoplasmic |
| 18079343 |
|
Hars2 |
|
0 |
438 |
0 |
0 |
4959 |
|
n.v. |
-0.38 |
n.v. |
n.v. |
-0.05 |
|
probable histidine--tRNA ligase, mitochondrial
precursor |
| 6680169 |
|
Has1 |
|
0 |
0 |
0 |
32210 |
0 |
|
n.v. |
n.v. |
n.v. |
-0.45 |
n.v. |
|
hyaluronan synthase 1 |
| 28076885 |
|
Hat1 |
|
0 |
3027 |
2919 |
10387 |
80825 |
|
n.v. |
0.55 |
0.08 |
0.05 |
0.14 |
|
histone acetyltransferase type B catalytic subunit |
| 22122693 |
|
Haus3 |
|
0 |
0 |
3 |
0 |
0 |
|
n.v. |
n.v. |
0.34 |
n.v. |
n.v. |
|
HAUS augmin-like complex subunit 3 |
| 226442837 |
|
Haus5 |
|
0 |
0 |
50 |
0 |
0 |
|
n.v. |
n.v. |
0.24 |
n.v. |
n.v. |
|
HAUS augmin-like complex subunit 5 |
| 498752597 |
|
Hbb-b1 |
|
20851 |
0 |
0 |
0 |
0 |
|
-1.99 |
n.v. |
n.v. |
n.v. |
n.v. |
|
hemoglobin subunit beta-1 |
| 31982300;319402143 |
|
Hbb-bt |
|
567 |
0 |
0 |
0 |
0 |
|
-3.57 |
n.v. |
n.v. |
n.v. |
n.v. |
|
hemoglobin, beta adult t chain |
| 6754178 |
|
Hbegf |
|
0 |
0 |
891 |
0 |
0 |
|
n.v. |
n.v. |
0.01 |
n.v. |
n.v. |
|
proheparin-binding EGF-like growth factor precursor |
| 223634002 |
|
Hbs1l |
|
0 |
0 |
0 |
352 |
0 |
|
n.v. |
n.v. |
n.v. |
0.37 |
n.v. |
|
HBS1-like protein isoform 3 |
| 110611222 |
|
Hbs1l |
|
0 |
0 |
76 |
1023 |
1092 |
|
n.v. |
n.v. |
0.16 |
0.42 |
0.34 |
|
HBS1-like protein isoform 1 |
| 110611224 |
|
Hbs1l |
|
0 |
0 |
76 |
1023 |
1092 |
|
n.v. |
n.v. |
0.16 |
0.42 |
0.34 |
|
HBS1-like protein isoform 2 |
| 225543251 |
|
Hccs |
|
0 |
2008 |
0 |
0 |
0 |
|
n.v. |
-0.05 |
n.v. |
n.v. |
n.v. |
|
cytochrome c-type heme lyase |
| 34328130 |
|
Hcfc1 |
|
0 |
0 |
0 |
278 |
1992 |
|
n.v. |
n.v. |
n.v. |
-0.28 |
-0.2 |
|
host cell factor 1 |
| 287323109 |
|
Hck |
|
2691 |
4643 |
9068 |
10936 |
44016 |
|
0.15 |
0.15 |
-0.08 |
-0.1 |
0.06 |
|
tyrosine-protein kinase HCK isoform p56Hck |
| 34734056 |
|
Hck |
|
2691 |
4643 |
9068 |
10936 |
44016 |
|
0.15 |
0.15 |
-0.08 |
-0.1 |
0.06 |
|
tyrosine-protein kinase HCK isoform p59Hck |
| 6680191 |
|
Hcn3 |
|
0 |
0 |
0 |
8 |
0 |
|
n.v. |
n.v. |
n.v. |
-0.58 |
n.v. |
|
potassium/sodium hyperpolarization-activated cyclic
nucleotide-gated channel 3 |
| 6680193 |
|
Hdac1 |
|
108317 |
194 |
4690 |
43424 |
3009 |
|
0.17 |
0.1 |
-0.05 |
-0.15 |
-0.06 |
|
histone deacetylase 1 |
| 259089444 |
|
Hdac10 |
|
0 |
0 |
0 |
0 |
450 |
|
n.v. |
n.v. |
n.v. |
n.v. |
0.15 |
|
histone deacetylase 10 |
| 87162464 |
|
Hdac2 |
|
22498 |
194 |
3585 |
23370 |
2249 |
|
0 |
0.1 |
-0.06 |
0.02 |
-0.03 |
|
histone deacetylase 2 |
| 89257352 |
|
Hdac3 |
|
0 |
4 |
0 |
2947 |
0 |
|
n.v. |
-1.02 |
n.v. |
0.11 |
n.v. |
|
histone deacetylase 3 |
| 46402201 |
|
Hdac4 |
|
0 |
0 |
0 |
0 |
685 |
|
n.v. |
n.v. |
n.v. |
n.v. |
-0.7 |
|
histone deacetylase 4 |
| 194353997 |
|
Hdac6 |
|
6370 |
19 |
496 |
90 |
7636 |
|
0 |
0.29 |
0.1 |
0.29 |
0.05 |
|
histone deacetylase 6 |
| 58037203 |
|
Hdac8 |
|
0 |
0 |
0 |
0 |
375 |
|
n.v. |
n.v. |
n.v. |
n.v. |
0.02 |
|
histone deacetylase 8 |
| 75832031 |
|
Hddc2 |
|
0 |
31 |
51 |
180 |
18624 |
|
n.v. |
-0.02 |
-0.15 |
0.24 |
0.1 |
|
HD domain-containing protein 2 |
| 21312092 |
|
Hddc3 |
|
0 |
0 |
0 |
0 |
3920 |
|
n.v. |
n.v. |
n.v. |
n.v. |
0.14 |
|
guanosine-3',5'-bis(diphosphate) 3'-pyrophosphohydrolase
MESH1 |
| 188497724 |
|
Hdgf |
|
18086 |
772 |
3771 |
36033 |
185842 |
|
0.2 |
0.14 |
0.03 |
0.06 |
-0.02 |
|
hepatoma-derived growth factor |
| 6680201 |
|
Hdgfrp2 |
|
0 |
1720 |
2808 |
647 |
407 |
|
n.v. |
0.12 |
-0.03 |
0.25 |
0.05 |
|
hepatoma-derived growth factor-related protein 2 |
| 21313310 |
|
Hdhd2 |
|
0 |
94 |
16 |
0 |
728 |
|
n.v. |
-0.09 |
-0.1 |
n.v. |
-0.01 |
|
haloacid dehalogenase-like hydrolase domain-containing
protein 2 isoform 1 |
| 21312204 |
|
Hdhd3 |
|
1995 |
1480 |
0 |
0 |
0 |
|
-0.27 |
-0.15 |
n.v. |
n.v. |
n.v. |
|
haloacid dehalogenase-like hydrolase domain-containing
protein 3 |
| 19527028 |
|
Hdlbp |
|
38754 |
3776 |
49266 |
48614 |
3266 |
|
-0.04 |
-0.12 |
-0.01 |
-0.15 |
0.08 |
|
vigilin |
| 46519149 |
|
Heatr1 |
|
1446 |
2 |
0 |
0 |
0 |
|
0.75 |
0.23 |
n.v. |
n.v. |
n.v. |
|
BAP28 protein |
| 124486915 |
|
Heatr2 |
|
0 |
0 |
0 |
802 |
1521 |
|
n.v. |
n.v. |
n.v. |
0.24 |
0.2 |
|
HEAT repeat-containing protein 2 |
| 40789301 |
|
Heatr3 |
|
0 |
0 |
1036 |
11722 |
1060 |
|
n.v. |
n.v. |
0.03 |
0.05 |
-0.34 |
|
HEAT repeat-containing protein 3 |
| 38505263 |
|
Heatr5a |
|
0 |
0 |
0 |
82 |
2913 |
|
n.v. |
n.v. |
n.v. |
-1.43 |
-0.72 |
|
HEAT repeat-containing protein 5A |
| 124487157 |
|
Heatr5b |
|
0 |
27 |
399 |
1760 |
8696 |
|
n.v. |
-0.03 |
-0.02 |
-0.11 |
-0.32 |
|
HEAT repeat-containing protein 5B |
| 124249080 |
|
Heatr6 |
|
0 |
0 |
776 |
712 |
386 |
|
n.v. |
n.v. |
-0.11 |
0.08 |
0.04 |
|
HEAT repeat-containing protein 6 |
| 124001580 |
|
Hebp1 |
|
0 |
0 |
0 |
0 |
2463 |
|
n.v. |
n.v. |
n.v. |
n.v. |
-0.33 |
|
heme-binding protein 1 |
| 9507129 |
|
Hebp2 |
|
0 |
0 |
0 |
0 |
7100 |
|
n.v. |
n.v. |
n.v. |
n.v. |
0.09 |
|
heme-binding protein 2 |
| 205277432 |
|
Hectd1 |
|
0 |
0 |
51 |
3446 |
20616 |
|
n.v. |
n.v. |
-0.04 |
0.24 |
0.19 |
|
E3 ubiquitin-protein ligase HECTD1 |
| 30424882 |
|
Hectd3 |
|
0 |
0 |
35 |
13015 |
0 |
|
n.v. |
n.v. |
-0.01 |
0.19 |
n.v. |
|
E3 ubiquitin-protein ligase HECTD3 |
| 163644255 |
|
Hecw1 |
|
0 |
0 |
0 |
0 |
1028 |
|
n.v. |
n.v. |
n.v. |
n.v. |
0.31 |
|
E3 ubiquitin-protein ligase HECW1 |
| 165932362 |
|
Helb |
|
0 |
0 |
382 |
377 |
6029 |
|
n.v. |
n.v. |
-0.02 |
0.89 |
0.01 |
|
DNA helicase B |
| 12232371 |
|
Hells |
|
8531 |
614 |
2041 |
10821 |
5162 |
|
0.11 |
-0.45 |
-0.19 |
-0.19 |
-0.17 |
|
lymphocyte-specific helicase |
| 50355943 |
|
Helz |
|
0 |
0 |
200 |
0 |
0 |
|
n.v. |
n.v. |
0.39 |
n.v. |
n.v. |
|
probable helicase with zinc finger domain |
| 125347767 |
|
Helz2 |
|
0 |
0 |
372 |
0 |
0 |
|
n.v. |
n.v. |
0.28 |
n.v. |
n.v. |
|
PPAR gamma-DNA-binding domain interacting protein1 |
| 257196144 |
|
Herc1 |
|
0 |
0 |
0 |
6000 |
0 |
|
n.v. |
n.v. |
n.v. |
0 |
n.v. |
|
hect domain and RCC1-like domain 1 |
| 134288898 |
|
Herc2 |
|
0 |
0 |
19 |
25 |
0 |
|
n.v. |
n.v. |
0.54 |
-0.38 |
n.v. |
|
E3 ubiquitin-protein ligase HERC2 |
| 312433980 |
|
Herc4 |
|
0 |
0 |
0 |
0 |
31090 |
|
n.v. |
n.v. |
n.v. |
n.v. |
0 |
|
probable E3 ubiquitin-protein ligase HERC4 isoform 1 |
| 32451488 |
|
Herc4 |
|
0 |
0 |
0 |
0 |
31090 |
|
n.v. |
n.v. |
n.v. |
n.v. |
0 |
|
probable E3 ubiquitin-protein ligase HERC4 isoform 2 |
| 11612515 |
|
Herpud1 |
|
0 |
63 |
16 |
0 |
0 |
|
n.v. |
-0.24 |
-0.52 |
n.v. |
n.v. |
|
homocysteine-responsive endoplasmic reticulum-resident
ubiquitin-like domain member 1 protein |
| 67514549 |
|
Hexa |
|
0 |
13538 |
8253 |
1498 |
0 |
|
n.v. |
0 |
-0.21 |
-0.31 |
n.v. |
|
beta-hexosaminidase subunit alpha precursor |
| 6754186 |
|
Hexb |
|
0 |
13757 |
6711 |
7596 |
86 |
|
n.v. |
-0.08 |
-0.22 |
-0.15 |
0.54 |
|
beta-hexosaminidase subunit beta precursor |
| 20270289 |
|
Hexim1 |
|
0 |
0 |
78 |
2521 |
846 |
|
n.v. |
n.v. |
0.05 |
0.1 |
-0.16 |
|
protein HEXIM1 |
| 226693388 |
|
Hgs |
|
0 |
1987 |
7346 |
0 |
18195 |
|
n.v. |
0.3 |
0.01 |
n.v. |
0.03 |
|
hepatocyte growth factor-regulated tyrosine kinase
substrate isoform 1 |
| 226874952 |
|
Hgs |
|
0 |
1987 |
7346 |
0 |
18195 |
|
n.v. |
0.3 |
0.01 |
n.v. |
0.03 |
|
hepatocyte growth factor-regulated tyrosine kinase
substrate isoform 2 |
| 115292433 |
|
Hgsnat |
|
0 |
73 |
1288 |
0 |
0 |
|
n.v. |
0.11 |
-0.19 |
n.v. |
n.v. |
|
heparan-alpha-glucosaminide N-acetyltransferase |
| 160358774 |
|
Hhip |
|
0 |
0 |
645 |
5615 |
0 |
|
n.v. |
n.v. |
-0.43 |
-0.15 |
n.v. |
|
hedgehog-interacting protein precursor |
| 21704140 |
|
Hibadh |
|
33024 |
11319 |
0 |
0 |
5987 |
|
-0.06 |
-0.17 |
n.v. |
n.v. |
-0.38 |
|
3-hydroxyisobutyrate dehydrogenase, mitochondrial
precursor |
| 22122625 |
|
Hibch |
|
2105 |
2753 |
50 |
0 |
1489 |
|
-0.51 |
-0.23 |
-0.2 |
n.v. |
-0.86 |
|
3-hydroxyisobutyryl-CoA hydrolase, mitochondrial
precursor |
| 70887767 |
|
Hic2 |
|
0 |
13801 |
11649 |
491 |
0 |
|
n.v. |
0.07 |
0.12 |
0.09 |
n.v. |
|
hypermethylated in cancer 2 protein |
| 29825825 |
|
Hid1 |
|
0 |
1824 |
111 |
0 |
461 |
|
n.v. |
-0.24 |
-0.18 |
n.v. |
0.65 |
|
protein HID1 |
| 70909332 |
|
Hif1an |
|
0 |
0 |
0 |
0 |
5505 |
|
n.v. |
n.v. |
n.v. |
n.v. |
0.18 |
|
hypoxia-inducible factor 1-alpha inhibitor |
| 9789977 |
|
Higd1a |
|
0 |
63 |
0 |
0 |
0 |
|
n.v. |
-0.34 |
n.v. |
n.v. |
n.v. |
|
HIG1 domain family member 1A, mitochondrial |
| 12963711 |
|
Hilpda |
|
0 |
0 |
57 |
0 |
0 |
|
n.v. |
n.v. |
0.19 |
n.v. |
n.v. |
|
hypoxia-inducible lipid droplet-associated protein
isoform 2 |
| 299758486 |
|
Hilpda |
|
0 |
0 |
57 |
0 |
0 |
|
n.v. |
n.v. |
0.19 |
n.v. |
n.v. |
|
hypoxia-inducible lipid droplet-associated protein
isoform 1 |
| 33468857 |
|
Hint1 |
|
18874 |
1468 |
6633 |
4117 |
107245 |
|
0.02 |
0.14 |
0.03 |
0.17 |
0.04 |
|
histidine triad nucleotide-binding protein 1 |
| 110625719 |
|
Hint2 |
|
1025 |
1902 |
0 |
0 |
0 |
|
0.1 |
-0.12 |
n.v. |
n.v. |
n.v. |
|
histidine triad nucleotide-binding protein 2,
mitochondrial precursor |
| 13385270 |
|
Hint3 |
|
0 |
1705 |
929 |
925 |
0 |
|
n.v. |
-0.06 |
0.04 |
0.08 |
n.v. |
|
histidine triad nucleotide-binding protein 3 |
| 225007582 |
|
Hip1 |
|
0 |
0 |
199 |
0 |
0 |
|
n.v. |
n.v. |
0.3 |
n.v. |
n.v. |
|
huntingtin-interacting protein 1 |
| 255308928 |
|
Hip1r |
|
183 |
17 |
4887 |
1588 |
782 |
|
0.64 |
0.7 |
0 |
0.02 |
-0.12 |
|
huntingtin-interacting protein 1-related protein |
| 27370102 |
|
Hirip3 |
|
0 |
0 |
0 |
0 |
150 |
|
n.v. |
n.v. |
n.v. |
0.26 |
-0.31 |
|
HIRA-interacting protein 3 |
| 21426823 |
|
Hist1h1a |
|
1165160 |
9279 |
45050 |
50431 |
214 |
|
0 |
-0.15 |
-0.34 |
-0.76 |
-1.16 |
|
histone H1.1 |
| 21426893 |
|
Hist1h1b |
|
1443795 |
5340 |
26925 |
90336 |
0 |
|
-0.04 |
-0.16 |
-0.39 |
-0.47 |
n.v. |
|
histone H1.5 |
| 9845257 |
|
Hist1h1c |
|
4446238 |
34795 |
133505 |
151507 |
364 |
|
-0.06 |
-0.05 |
-0.37 |
-0.81 |
-1.3 |
|
histone H1.2 |
| 254588110 |
|
Hist1h1d |
|
4461487 |
34795 |
133548 |
153479 |
364 |
|
-0.06 |
-0.05 |
-0.37 |
-0.78 |
-1.3 |
|
histone H1.3 |
| 13430890 |
|
Hist1h1e |
|
2865733 |
9813 |
117749 |
102843 |
214 |
|
-0.05 |
-0.05 |
-0.37 |
-0.74 |
-1.16 |
|
histone H1.4 |
| 112807207 |
|
Hist1h1t |
|
819688 |
2622 |
53856 |
49433 |
0 |
|
-0.02 |
-0.03 |
-0.37 |
-0.74 |
n.v. |
|
histone H1t |
| 28316756 |
|
Hist1h2aa |
|
11324321 |
115502 |
91304 |
423865 |
16096 |
|
-0.08 |
-0.17 |
-0.35 |
-0.53 |
-0.52 |
|
histone cluster 1, H2aa |
| 30061379 |
|
Hist1h2af |
|
11323863 |
115502 |
91304 |
419813 |
16096 |
|
-0.08 |
-0.17 |
-0.35 |
-0.53 |
-0.52 |
|
histone H2A type 1-F |
| 30061327 |
|
Hist1h2ah |
|
11324321 |
115502 |
91304 |
475950 |
16096 |
|
-0.08 |
-0.17 |
-0.35 |
-0.53 |
-0.52 |
|
histone H2A type 1-H |
| 30061371 |
|
Hist1h2ak |
|
11324321 |
115502 |
91304 |
485158 |
16096 |
|
-0.08 |
-0.17 |
-0.35 |
-0.52 |
-0.52 |
|
histone H2A type 1-K |
| 407262045 |
|
Hist1h2al |
|
11325034 |
115502 |
91285 |
424528 |
16096 |
|
-0.08 |
-0.17 |
-0.35 |
-0.53 |
-0.52 |
|
PREDICTED: histone H2A type 2-A |
| 294712564;30061365 |
|
Hist1h2ao |
|
0 |
115502 |
0 |
404334 |
16096 |
|
n.v. |
-0.17 |
n.v. |
-0.52 |
-0.52 |
|
histone H2A type 1 |
| 30061375;30061365 |
|
Hist1h2ap |
|
11324321 |
0 |
0 |
0 |
0 |
|
-0.08 |
n.v. |
n.v. |
n.v. |
n.v. |
|
histone H2A type 1 |
| 30061375;294712564;30061365 |
|
Hist1h2ap |
|
0 |
0 |
91304 |
0 |
0 |
|
n.v. |
n.v. |
-0.35 |
n.v. |
n.v. |
|
histone H2A type 1 |
| 28316750 |
|
Hist1h2ba |
|
18690844 |
113728 |
81554 |
770564 |
98827 |
|
-0.09 |
-0.12 |
-0.37 |
-0.35 |
-0.33 |
|
histone H2B type 1-A |
| 28316760 |
|
Hist1h2bb |
|
20160469 |
126810 |
104346 |
902229 |
105435 |
|
-0.06 |
-0.11 |
-0.37 |
-0.42 |
-0.32 |
|
histone H2B type 1-B |
| 30089706;68131547 |
|
Hist1h2be |
|
20160469 |
126810 |
104346 |
902229 |
105435 |
|
-0.06 |
-0.11 |
-0.37 |
-0.42 |
-0.32 |
|
histone H2B type 1-C/E/G |
| 30061383 |
|
Hist1h2bf |
|
20160469 |
126810 |
104346 |
1171354 |
105435 |
|
-0.06 |
-0.11 |
-0.37 |
-0.41 |
-0.32 |
|
histone H2B type 1-F/J/L |
| 30061387 |
|
Hist1h2bh |
|
20160469 |
126810 |
104346 |
902655 |
105435 |
|
-0.06 |
-0.11 |
-0.37 |
-0.41 |
-0.32 |
|
histone H2B type 1-H |
| 30089704 |
|
Hist1h2bk |
|
20160469 |
126810 |
104346 |
901975 |
105435 |
|
-0.06 |
-0.11 |
-0.37 |
-0.41 |
-0.32 |
|
histone H2B type 1-K |
| 30061385 |
|
Hist1h2bm |
|
20160469 |
126810 |
104346 |
902090 |
105435 |
|
-0.06 |
-0.11 |
-0.37 |
-0.42 |
-0.32 |
|
histone H2B type 1-M |
| 160420308 |
|
Hist1h2bp |
|
20160469 |
126810 |
104346 |
902098 |
105435 |
|
-0.06 |
-0.11 |
-0.37 |
-0.42 |
-0.32 |
|
histone H2B type 1-P |
| 160420310;160420312 |
|
Hist1h2bq |
|
20160469 |
0 |
104346 |
0 |
0 |
|
-0.06 |
n.v. |
-0.37 |
n.v. |
n.v. |
|
H2b histone family, member A |
| 160420312 |
|
Hist1h2br |
|
0 |
126810 |
0 |
902655 |
105435 |
|
n.v. |
-0.11 |
n.v. |
-0.41 |
-0.32 |
|
histone cluster 1 H2br |
| 30089712 |
|
Hist1h3c |
|
3752513 |
0 |
0 |
0 |
0 |
|
-0.07 |
n.v. |
n.v. |
n.v. |
n.v. |
|
histone H3.2 |
| 30089712;21489953 |
|
Hist1h3c |
|
0 |
0 |
75553 |
0 |
0 |
|
n.v. |
n.v. |
-0.42 |
n.v. |
n.v. |
|
histone H3.2 |
| 21489955 |
|
Hist1h3g |
|
3752513 |
39673 |
0 |
374301 |
19995 |
|
-0.07 |
-0.22 |
n.v. |
-0.34 |
-0.7 |
|
histone H3.1 |
| 30061345;21489955 |
|
Hist1h3i |
|
0 |
0 |
75553 |
0 |
0 |
|
n.v. |
n.v. |
-0.42 |
n.v. |
n.v. |
|
histone H3.1 |
| 306482623 |
|
Hist1h4m |
|
12320827 |
0 |
0 |
0 |
0 |
|
-0.09 |
n.v. |
n.v. |
n.v. |
n.v. |
|
histone H4 |
| 306482623;30089708 |
|
Hist1h4m |
|
0 |
0 |
179241 |
0 |
0 |
|
n.v. |
n.v. |
-0.39 |
n.v. |
n.v. |
|
histone H4 |
| 30089708;306482623 |
|
Hist1h4n |
|
0 |
179562 |
0 |
477046 |
22126 |
|
n.v. |
-0.12 |
n.v. |
-0.42 |
-0.41 |
|
histone H4 |
| 20799907 |
|
Hist2h2aa1 |
|
11325034 |
0 |
0 |
0 |
0 |
|
-0.08 |
n.v. |
n.v. |
n.v. |
n.v. |
|
histone H2A type 2-A |
| 30061399;20799907 |
|
Hist2h2aa2 |
|
0 |
115502 |
91285 |
405194 |
16096 |
|
n.v. |
-0.17 |
-0.35 |
-0.56 |
-0.52 |
|
histone H2A type 2-A |
| 119433657 |
|
Hist2h2ab |
|
3521016 |
36749 |
73577 |
88199 |
16096 |
|
-0.1 |
-0.18 |
-0.38 |
-0.49 |
-0.52 |
|
histone H2A type 2-B |
| 30089710 |
|
Hist2h2ac |
|
11325034 |
115502 |
91285 |
405996 |
16096 |
|
-0.08 |
-0.17 |
-0.35 |
-0.53 |
-0.52 |
|
histone H2A type 2-C |
| 68226433 |
|
Hist2h2bb |
|
20160469 |
126810 |
104346 |
901664 |
105435 |
|
-0.06 |
-0.11 |
-0.37 |
-0.42 |
-0.32 |
|
histone H2B type 2-B |
| 68226431 |
|
Hist2h2be |
|
18977406 |
114893 |
83332 |
834011 |
99181 |
|
-0.07 |
-0.12 |
-0.38 |
-0.42 |
-0.35 |
|
histone H2B type 2-E |
| 21489953 |
|
Hist2h3c2 |
|
0 |
39673 |
0 |
374301 |
19995 |
|
n.v. |
-0.22 |
n.v. |
-0.34 |
-0.7 |
|
histone H3.2 |
| 30061353 |
|
Hist3h2a |
|
11324321 |
115502 |
91304 |
405832 |
16096 |
|
-0.08 |
-0.17 |
-0.35 |
-0.56 |
-0.52 |
|
histone H2A type 3 |
| 13386452 |
|
Hist3h2ba |
|
18977406 |
114893 |
83332 |
827135 |
99181 |
|
-0.07 |
-0.12 |
-0.38 |
-0.42 |
-0.35 |
|
histone H2B type 3-A |
| 46049029 |
|
Hist3h2bb-ps |
|
18977406 |
114893 |
83332 |
827135 |
99181 |
|
-0.07 |
-0.12 |
-0.38 |
-0.42 |
-0.35 |
|
histone H2B type 3-B |
| 225735582 |
|
Hk1 |
|
950082 |
109079 |
106682 |
136748 |
432557 |
|
0.08 |
-0.11 |
-0.32 |
-0.39 |
-0.42 |
|
hexokinase-1 isoform HK1-sb |
| 225735584 |
|
Hk1 |
|
963299 |
113907 |
108729 |
142191 |
451780 |
|
0.08 |
-0.1 |
-0.32 |
-0.39 |
-0.42 |
|
hexokinase-1 isoform HK1 |
| 7305143 |
|
Hk2 |
|
76867 |
45564 |
23454 |
6663 |
60466 |
|
0.18 |
-0.1 |
-0.29 |
-0.34 |
-0.4 |
|
hexokinase-2 |
| 329755310 |
|
Hk3 |
|
8073 |
4766 |
8572 |
1498 |
13033 |
|
0.18 |
-0.11 |
-0.32 |
-0.24 |
-0.4 |
|
hexokinase-3 isoform 2 |
| 329755312 |
|
Hk3 |
|
8073 |
4766 |
8572 |
1498 |
13033 |
|
0.18 |
-0.11 |
-0.32 |
-0.24 |
-0.4 |
|
hexokinase-3 isoform 3 |
| 84370288 |
|
Hk3 |
|
8073 |
4766 |
8572 |
1498 |
13033 |
|
0.18 |
-0.11 |
-0.32 |
-0.24 |
-0.4 |
|
hexokinase-3 isoform 1 |
| 21703836 |
|
Hkdc1 |
|
118001 |
32686 |
12902 |
25760 |
93173 |
|
0.08 |
-0.08 |
-0.25 |
-0.27 |
-0.4 |
|
putative hexokinase HKDC1 |
| 20982837 |
|
Hlcs |
|
0 |
40 |
0 |
0 |
0 |
|
n.v. |
1.02 |
n.v. |
n.v. |
n.v. |
|
biotin--protein ligase |
| 67763824 |
|
Hltf |
|
0 |
0 |
4 |
0 |
0 |
|
n.v. |
n.v. |
0.47 |
n.v. |
n.v. |
|
helicase-like transcription factor isoform 1 |
| 159110431 |
|
Hmbs |
|
0 |
144 |
40 |
0 |
14865 |
|
n.v. |
-0.23 |
-0.14 |
n.v. |
0.15 |
|
porphobilinogen deaminase isoform 1 |
| 159110463 |
|
Hmbs |
|
0 |
144 |
40 |
0 |
14865 |
|
n.v. |
-0.23 |
-0.14 |
n.v. |
0.15 |
|
porphobilinogen deaminase isoform 2 |
| 154689979 |
|
Hmcn1 |
|
0 |
1382 |
0 |
0 |
0 |
|
n.v. |
-0.04 |
n.v. |
n.v. |
n.v. |
|
hemicentin 1 precursor |
| 262331501 |
|
Hmga1 |
|
0 |
106 |
0 |
573 |
129 |
|
n.v. |
-0.19 |
n.v. |
0.15 |
-0.38 |
|
high mobility group protein HMG-I/HMG-Y isoform b |
| 262331513 |
|
Hmga1 |
|
0 |
106 |
0 |
106 |
129 |
|
n.v. |
-0.19 |
n.v. |
-0.68 |
-0.38 |
|
high mobility group protein HMG-I/HMG-Y isoform d |
| 262331509 |
|
Hmga1 |
|
12759 |
1033 |
0 |
9233 |
129 |
|
0.01 |
0.09 |
n.v. |
-0.14 |
-0.38 |
|
high mobility group protein HMG-I/HMG-Y isoform c |
| 262331515 |
|
Hmga1 |
|
12759 |
1033 |
0 |
9233 |
129 |
|
0.01 |
0.09 |
n.v. |
-0.14 |
-0.38 |
|
high mobility group protein HMG-I/HMG-Y isoform e |
| 262072972;262331501 |
|
Hmga1-rs1 |
|
348 |
0 |
0 |
0 |
0 |
|
0.23 |
n.v. |
n.v. |
n.v. |
n.v. |
|
high mobility group protein HMG-I/HMG-Y isoform 2 |
| 262072970;86198323 |
|
Hmga1-rs1 |
|
12759 |
1142 |
0 |
9340 |
0 |
|
0.01 |
0 |
n.v. |
-0.14 |
n.v. |
|
high mobility group protein HMG-I/HMG-Y isoform 1 |
| 262072970 |
|
Hmga1-rs1 |
|
0 |
0 |
0 |
0 |
129 |
|
n.v. |
n.v. |
n.v. |
n.v. |
-0.38 |
|
high mobility group protein HMG-I/HMG-Y isoform 1 |
| 6754210 |
|
Hmga2 |
|
2197 |
562 |
0 |
1981 |
546 |
|
0.08 |
-0.34 |
n.v. |
-0.51 |
-0.53 |
|
high mobility group protein HMGI-C |
| 6680229 |
|
Hmgb2 |
|
225896 |
24031 |
57643 |
268012 |
232675 |
|
0.1 |
0.23 |
0 |
0.06 |
-0.03 |
|
high mobility group protein B2 |
| 6680231 |
|
Hmgb3 |
|
14389 |
2171 |
5003 |
32308 |
53205 |
|
0.26 |
-0.1 |
-0.05 |
0.04 |
0.05 |
|
high mobility group protein B3 |
| 171543858 |
|
Hmgcl |
|
1611 |
1812 |
0 |
0 |
0 |
|
-0.65 |
-0.17 |
n.v. |
n.v. |
n.v. |
|
hydroxymethylglutaryl-CoA lyase, mitochondrial precursor |
| 31981842 |
|
Hmgcs1 |
|
0 |
0 |
1337 |
0 |
48011 |
|
n.v. |
n.v. |
-0.03 |
n.v. |
0.19 |
|
hydroxymethylglutaryl-CoA synthase, cytoplasmic |
| 31560689 |
|
Hmgcs2 |
|
0 |
0 |
0 |
0 |
8771 |
|
n.v. |
n.v. |
n.v. |
n.v. |
-0.14 |
|
hydroxymethylglutaryl-CoA synthase, mitochondrial
precursor |
| 21313298 |
|
Hmgn3 |
|
0 |
13 |
0 |
229 |
0 |
|
n.v. |
0.36 |
n.v. |
0.56 |
n.v. |
|
high mobility group nucleosome-binding domain-containing
protein 3 isoform Hmgn3a |
| 133778915 |
|
Hmgn5 |
|
11606 |
21 |
1 |
319 |
610 |
|
0.14 |
0.01 |
0.21 |
0.16 |
-0.08 |
|
high mobility group nucleosome-binding domain-containing
protein 5 |
| 225007593 |
|
Hmox2 |
|
31962 |
20157 |
3355 |
131 |
0 |
|
-0.05 |
-0.26 |
-0.4 |
0.58 |
n.v. |
|
heme oxygenase 2 |
| 6680237 |
|
Hn1 |
|
0 |
0 |
18 |
0 |
21644 |
|
n.v. |
n.v. |
0.3 |
n.v. |
0.19 |
|
hematological and neurological expressed 1 protein |
| 39573709 |
|
Hn1l |
|
0 |
0 |
332 |
0 |
87068 |
|
n.v. |
n.v. |
-1.05 |
n.v. |
-0.02 |
|
hematological and neurological expressed 1-like protein |
| 226443091 |
|
Hnrnpa0 |
|
396838 |
4741 |
2249 |
22789 |
0 |
|
-0.07 |
0.03 |
-0.2 |
-0.16 |
n.v. |
|
heterogeneous nuclear ribonucleoprotein A0 |
| 6754220 |
|
Hnrnpa1 |
|
1455768 |
14988 |
27098 |
51847 |
503 |
|
-0.05 |
-0.17 |
-0.09 |
-0.12 |
-0.38 |
|
heterogeneous nuclear ribonucleoprotein A1 isoform a |
| 85060507 |
|
Hnrnpa1 |
|
1455768 |
14988 |
27098 |
51847 |
503 |
|
-0.05 |
-0.17 |
-0.09 |
-0.12 |
-0.38 |
|
heterogeneous nuclear ribonucleoprotein A1 isoform b |
| 109134362;309267107 |
|
Hnrnpa2b1 |
|
0 |
39533 |
0 |
135316 |
3738 |
|
n.v. |
0.01 |
n.v. |
-0.08 |
-0.11 |
|
heterogeneous nuclear ribonucleoproteins A2/B1 isoform 1 |
| 32880197 |
|
Hnrnpa2b1 |
|
2372624 |
39533 |
46681 |
135316 |
3738 |
|
-0.06 |
0.01 |
-0.08 |
-0.08 |
-0.11 |
|
heterogeneous nuclear ribonucleoproteins A2/B1 isoform 2 |
| 157277969 |
|
Hnrnpa3 |
|
1731163 |
10945 |
44807 |
85834 |
2410 |
|
-0.04 |
-0.12 |
-0.05 |
-0.13 |
-0.12 |
|
heterogeneous nuclear ribonucleoprotein A3 isoform c |
| 37674277 |
|
Hnrnpa3 |
|
1733653 |
10945 |
44807 |
85834 |
2410 |
|
-0.04 |
-0.12 |
-0.05 |
-0.13 |
-0.12 |
|
heterogeneous nuclear ribonucleoprotein A3 isoform a |
| 146260280 |
|
Hnrnpab |
|
545611 |
26119 |
111754 |
297594 |
82602 |
|
-0.11 |
-0.1 |
-0.05 |
-0.29 |
-0.33 |
|
heterogeneous nuclear ribonucleoprotein A/B isoform 1 |
| 6754222 |
|
Hnrnpab |
|
545611 |
26119 |
111754 |
297332 |
82602 |
|
-0.11 |
-0.1 |
-0.05 |
-0.29 |
-0.33 |
|
heterogeneous nuclear ribonucleoprotein A/B isoform 2 |
| 283436176 |
|
Hnrnpc |
|
372930 |
1518 |
15119 |
34576 |
0 |
|
-0.1 |
-0.25 |
0.08 |
-0.16 |
n.v. |
|
heterogeneous nuclear ribonucleoproteins C1/C2 isoform 2 |
| 283436180 |
|
Hnrnpc |
|
371063 |
1518 |
13664 |
35943 |
0 |
|
-0.1 |
-0.25 |
0.08 |
-0.16 |
n.v. |
|
heterogeneous nuclear ribonucleoproteins C1/C2 isoform 3 |
| 283436182 |
|
Hnrnpc |
|
371063 |
1518 |
13664 |
35943 |
0 |
|
-0.1 |
-0.25 |
0.08 |
-0.16 |
n.v. |
|
heterogeneous nuclear ribonucleoproteins C1/C2 isoform 4 |
| 8393544 |
|
Hnrnpc |
|
372930 |
1518 |
15119 |
34576 |
0 |
|
-0.1 |
-0.25 |
0.08 |
-0.16 |
n.v. |
|
heterogeneous nuclear ribonucleoproteins C1/C2 isoform 1 |
| 116256512 |
|
Hnrnpd |
|
293921 |
9703 |
106625 |
123496 |
83491 |
|
-0.02 |
-0.03 |
-0.06 |
-0.11 |
-0.11 |
|
heterogeneous nuclear ribonucleoprotein D0 isoform a |
| 116256514 |
|
Hnrnpd |
|
293921 |
9703 |
106625 |
123496 |
83491 |
|
-0.02 |
-0.03 |
-0.06 |
-0.11 |
-0.11 |
|
heterogeneous nuclear ribonucleoprotein D0 isoform c |
| 116256516 |
|
Hnrnpd |
|
290205 |
9703 |
106277 |
123496 |
83491 |
|
-0.05 |
-0.03 |
-0.06 |
-0.11 |
-0.11 |
|
heterogeneous nuclear ribonucleoprotein D0 isoform d |
| 116256518 |
|
Hnrnpd |
|
290205 |
9703 |
106277 |
139245 |
83491 |
|
-0.05 |
-0.03 |
-0.06 |
-0.11 |
-0.11 |
|
heterogeneous nuclear ribonucleoprotein D0 isoform b |
| 148664250 |
|
Hnrnpdl |
|
176763 |
4538 |
73078 |
55711 |
43127 |
|
-0.06 |
-0.04 |
-0.05 |
-0.07 |
-0.16 |
|
heterogeneous nuclear ribonucleoprotein D-like |
| 261878599;19527048 |
|
Hnrnpf |
|
0 |
0 |
46708 |
0 |
0 |
|
n.v. |
n.v. |
-0.01 |
n.v. |
n.v. |
|
heterogeneous nuclear ribonucleoprotein F |
| 19527048 |
|
Hnrnpf |
|
613544 |
15690 |
0 |
33471 |
115695 |
|
-0.02 |
0 |
n.v. |
-0.28 |
-0.18 |
|
heterogeneous nuclear ribonucleoprotein F |
| 10946928 |
|
Hnrnph1 |
|
688471 |
14322 |
42334 |
52969 |
60958 |
|
-0.03 |
0.05 |
-0.07 |
-0.23 |
-0.08 |
|
heterogeneous nuclear ribonucleoprotein H |
| 9845253 |
|
Hnrnph2 |
|
472460 |
7388 |
30841 |
26603 |
58667 |
|
-0.02 |
-0.01 |
-0.06 |
-0.11 |
-0.08 |
|
heterogeneous nuclear ribonucleoprotein H2 |
| 119637823 |
|
Hnrnph3 |
|
4814 |
380 |
1197 |
0 |
0 |
|
-0.13 |
-0.1 |
-0.01 |
n.v. |
n.v. |
|
heterogeneous nuclear ribonucleoprotein H3 |
| 13384620 |
|
Hnrnpk |
|
1684355 |
23848 |
195068 |
258369 |
208610 |
|
-0.01 |
-0.12 |
-0.06 |
-0.06 |
-0.09 |
|
heterogeneous nuclear ribonucleoprotein K |
| 183980004 |
|
Hnrnpl |
|
457028 |
2313 |
13729 |
41083 |
0 |
|
0 |
0.1 |
0 |
-0.11 |
n.v. |
|
heterogeneous nuclear ribonucleoprotein L |
| 110347535 |
|
Hnrnpll |
|
8622 |
2371 |
10681 |
24033 |
1167 |
|
0.14 |
0.05 |
0.09 |
0.02 |
-0.2 |
|
heterogeneous nuclear ribonucleoprotein L-like |
| 158186704 |
|
Hnrnpm |
|
513356 |
10701 |
46193 |
34854 |
835 |
|
-0.07 |
-0.12 |
-0.05 |
-0.13 |
-0.96 |
|
heterogeneous nuclear ribonucleoprotein M isoform b |
| 21313308 |
|
Hnrnpm |
|
513356 |
10701 |
46193 |
34854 |
835 |
|
-0.07 |
-0.12 |
-0.05 |
-0.13 |
-0.96 |
|
heterogeneous nuclear ribonucleoprotein M isoform a |
| 459683866 |
|
Hnrnpr |
|
0 |
5588 |
0 |
0 |
0 |
|
n.v. |
0.17 |
n.v. |
n.v. |
n.v. |
|
heterogeneous nuclear ribonucleoprotein R isoform b |
| 459683868 |
|
Hnrnpr |
|
29601 |
0 |
25583 |
0 |
0 |
|
-0.06 |
n.v. |
0.11 |
n.v. |
n.v. |
|
heterogeneous nuclear ribonucleoprotein R isoform b |
| 33859724 |
|
Hnrnpr |
|
45069 |
5889 |
59204 |
100085 |
364 |
|
-0.08 |
0.18 |
0.07 |
-0.02 |
0.28 |
|
heterogeneous nuclear ribonucleoprotein R isoform a |
| 160333923 |
|
Hnrnpu |
|
1394278 |
16316 |
166148 |
512474 |
18827 |
|
-0.08 |
0.19 |
0.09 |
0.05 |
-0.01 |
|
heterogeneous nuclear ribonucleoprotein U |
| 30017405 |
|
Hnrnpul1 |
|
0 |
0 |
0 |
1694 |
13269 |
|
n.v. |
n.v. |
n.v. |
-0.06 |
-0.04 |
|
heterogeneous nuclear ribonucleoprotein U-like protein 1
isoform 2 |
| 21450323 |
|
Hnrnpul1 |
|
4027 |
0 |
19 |
2685 |
19588 |
|
-0.06 |
n.v. |
1.03 |
-0.13 |
0 |
|
heterogeneous nuclear ribonucleoprotein U-like protein 1
isoform 1 |
| 124487099 |
|
Hnrnpul2 |
|
237850 |
0 |
19480 |
63831 |
1414 |
|
-0.07 |
n.v. |
0.05 |
0.07 |
-0.85 |
|
heterogeneous nuclear ribonucleoprotein U-like protein 2 |
| 13385656 |
|
Hoga1 |
|
970 |
2561 |
0 |
0 |
1992 |
|
-0.05 |
-0.27 |
n.v. |
n.v. |
-0.98 |
|
probable 4-hydroxy-2-oxoglutarate aldolase, mitochondrial
precursor |
| 225903402 |
|
Homer3 |
|
0 |
0 |
442 |
0 |
0 |
|
n.v. |
n.v. |
-0.03 |
n.v. |
n.v. |
|
homer protein homolog 3 isoform 2 |
| 225903404 |
|
Homer3 |
|
0 |
0 |
442 |
0 |
0 |
|
n.v. |
n.v. |
-0.03 |
n.v. |
n.v. |
|
homer protein homolog 3 isoform 1 |
| 22003856 |
|
Hook1 |
|
0 |
0 |
50 |
0 |
18892 |
|
n.v. |
n.v. |
0.91 |
n.v. |
0.03 |
|
protein Hook homolog 1 |
| 269784731 |
|
Hook2 |
|
0 |
0 |
0 |
0 |
1735 |
|
n.v. |
n.v. |
n.v. |
n.v. |
0.25 |
|
protein Hook homolog 2 isoform 1 |
| 269784735 |
|
Hook2 |
|
0 |
0 |
0 |
0 |
1735 |
|
n.v. |
n.v. |
n.v. |
n.v. |
0.25 |
|
protein Hook homolog 2 isoform 2 |
| 46559745 |
|
Hook3 |
|
0 |
94 |
3085 |
1097 |
7411 |
|
n.v. |
0.02 |
-0.02 |
0.05 |
0.1 |
|
protein Hook homolog 3 |
| 6754232 |
|
Hoxa5 |
|
0 |
0 |
0 |
25 |
0 |
|
n.v. |
n.v. |
n.v. |
0.35 |
n.v. |
|
homeobox protein Hox-A5 |
| 88014652 |
|
Hoxb7 |
|
0 |
0 |
0 |
851 |
0 |
|
n.v. |
n.v. |
n.v. |
-0.43 |
n.v. |
|
homeobox protein Hox-B7 |
| 112807184 |
|
Hoxd8 |
|
0 |
0 |
0 |
827 |
0 |
|
n.v. |
n.v. |
n.v. |
-0.19 |
n.v. |
|
homeobox protein Hox-D8 |
| 550821966 |
|
Hp1bp3 |
|
16604 |
0 |
0 |
0 |
0 |
|
0.05 |
n.v. |
n.v. |
n.v. |
n.v. |
|
heterochromatin protein 1-binding protein 3 isoform
4 |
| 550821975 |
|
Hp1bp3 |
|
19569 |
0 |
0 |
0 |
0 |
|
-0.08 |
n.v. |
n.v. |
n.v. |
n.v. |
|
heterochromatin protein 1-binding protein 3 isoform
5 |
| 550822234 |
|
Hp1bp3 |
|
19569 |
0 |
0 |
0 |
0 |
|
-0.08 |
n.v. |
n.v. |
n.v. |
n.v. |
|
heterochromatin protein 1-binding protein 3 isoform
3 |
| 171543869 |
|
Hp1bp3 |
|
23944 |
0 |
82 |
0 |
0 |
|
-0.14 |
n.v. |
-0.42 |
n.v. |
n.v. |
|
heterochromatin protein 1-binding protein 3 isoform
1 |
| 171543871 |
|
Hp1bp3 |
|
20979 |
0 |
82 |
0 |
0 |
|
-0.03 |
n.v. |
-0.42 |
n.v. |
n.v. |
|
heterochromatin protein 1-binding protein 3 isoform
2 |
| 6754240 |
|
Hpca |
|
19642 |
6891 |
4728 |
4715 |
471 |
|
-0.29 |
0.05 |
-0.06 |
-0.03 |
-0.04 |
|
neuron-specific calcium-binding protein hippocalcin |
| 7949055 |
|
Hpcal1 |
|
34122 |
12245 |
7167 |
5681 |
4155 |
|
-0.13 |
0.07 |
0 |
-0.05 |
-0.07 |
|
hippocalcin-like protein 1 |
| 96975138 |
|
Hprt |
|
0 |
2808 |
2325 |
9119 |
58881 |
|
n.v. |
0.24 |
0.04 |
0.09 |
0.04 |
|
hypoxanthine-guanine phosphoribosyltransferase |
| 268607540 |
|
Hps5 |
|
0 |
2 |
0 |
41 |
43 |
|
n.v. |
-0.19 |
n.v. |
-0.15 |
-0.2 |
|
Hermansky-Pudlak syndrome 5 protein homolog isoform
1 |
| 268607542 |
|
Hps5 |
|
0 |
2 |
0 |
41 |
43 |
|
n.v. |
-0.19 |
n.v. |
-0.15 |
-0.2 |
|
Hermansky-Pudlak syndrome 5 protein homolog isoform
2 |
| 194363764;194440734 |
|
Hras1 |
|
11331 |
0 |
0 |
0 |
0 |
|
0.2 |
n.v. |
n.v. |
n.v. |
n.v. |
|
GTPase HRas isoform 1 |
| 194440734;4885425 |
|
Hras1 |
|
0 |
0 |
21833 |
0 |
0 |
|
n.v. |
n.v. |
-0.13 |
n.v. |
n.v. |
|
GTPase HRas isoform 1 |
| 194363766 |
|
Hras1 |
|
7890 |
4618 |
21419 |
10723 |
3427 |
|
0 |
0.03 |
-0.13 |
-0.26 |
-0.24 |
|
GTPase HRas isoform 2 |
| 40807498 |
|
Hrsp12 |
|
5986 |
7713 |
9356 |
4739 |
44616 |
|
0.15 |
0.03 |
-0.06 |
0.07 |
0.04 |
|
ribonuclease UK114 |
| 160948577 |
|
Hs1bp3 |
|
0 |
418 |
440 |
0 |
20145 |
|
n.v. |
0.21 |
-0.01 |
n.v. |
-0.05 |
|
HCLS1-binding protein 3 |
| 170172560 |
|
Hs2st1 |
|
0 |
3317 |
135 |
0 |
0 |
|
n.v. |
-0.06 |
-0.65 |
n.v. |
n.v. |
|
heparan sulfate 2-O-sulfotransferase 1 |
| 6754246 |
|
Hs3st1 |
|
2087 |
0 |
559 |
3070 |
0 |
|
-0.09 |
n.v. |
-0.03 |
0.18 |
n.v. |
|
heparan sulfate glucosamine 3-O-sulfotransferase 1
precursor |
| 358356422 |
|
Hs3st5 |
|
0 |
0 |
310 |
3119 |
1253 |
|
n.v. |
n.v. |
0.1 |
0.1 |
0.02 |
|
heparan sulfate glucosamine 3-O-sulfotransferase 5 |
| 21311873 |
|
Hsbp1 |
|
0 |
73 |
44 |
49 |
0 |
|
n.v. |
-0.61 |
-0.07 |
-0.02 |
n.v. |
|
heat shock factor-binding protein 1 |
| 225703114 |
|
Hscb |
|
0 |
703 |
12 |
0 |
0 |
|
n.v. |
-0.19 |
0.2 |
n.v. |
n.v. |
|
iron-sulfur cluster co-chaperone protein HscB,
mitochondrial precursor |
| 133778913 |
|
Hsd11b2 |
|
35349 |
10684 |
8483 |
2357 |
0 |
|
0.21 |
-0.01 |
-0.17 |
-0.14 |
n.v. |
|
corticosteroid 11-beta-dehydrogenase isozyme 2 |
| 61888838 |
|
Hsd17b10 |
|
74268 |
19808 |
819 |
2202 |
1788 |
|
-0.03 |
-0.14 |
-0.39 |
-0.4 |
-0.46 |
|
3-hydroxyacyl-CoA dehydrogenase type-2 |
| 16716597 |
|
Hsd17b11 |
|
132847 |
22328 |
20835 |
18409 |
0 |
|
0.06 |
0.18 |
0.03 |
-0.01 |
n.v. |
|
estradiol 17-beta-dehydrogenase 11 precursor |
| 9789991 |
|
Hsd17b12 |
|
30205 |
4144 |
1733 |
0 |
0 |
|
-0.13 |
-0.44 |
-0.42 |
n.v. |
n.v. |
|
estradiol 17-beta-dehydrogenase 12 |
| 254553340 |
|
Hsd17b13 |
|
12924 |
4945 |
812 |
3307 |
0 |
|
-0.73 |
0.05 |
-0.03 |
-0.04 |
n.v. |
|
17-beta-hydroxysteroid dehydrogenase 13 isoform 2
precursor |
| 254553342 |
|
Hsd17b13 |
|
12924 |
4945 |
812 |
3307 |
0 |
|
-0.73 |
0.05 |
-0.03 |
-0.04 |
n.v. |
|
17-beta-hydroxysteroid dehydrogenase 13 isoform 1
precursor |
| 295054257 |
|
Hsd17b14 |
|
0 |
0 |
0 |
12033 |
0 |
|
n.v. |
n.v. |
n.v. |
-0.13 |
n.v. |
|
dehydrogenase/reductase (SDR family) member 10 |
| 31982273 |
|
Hsd17b4 |
|
304136 |
77896 |
75007 |
1089 |
6447 |
|
0.05 |
-0.16 |
-0.28 |
0.13 |
-0.16 |
|
peroxisomal multifunctional enzyme type 2 |
| 87162470 |
|
Hsd17b7 |
|
0 |
1776 |
119 |
0 |
0 |
|
n.v. |
-0.1 |
-0.6 |
n.v. |
n.v. |
|
3-keto-steroid reductase |
| 30424792 |
|
Hsdl1 |
|
0 |
3127 |
0 |
0 |
0 |
|
n.v. |
-0.06 |
n.v. |
n.v. |
n.v. |
|
inactive hydroxysteroid dehydrogenase-like protein 1 |
| 125656150 |
|
Hsdl2 |
|
0 |
1033 |
1141 |
0 |
0 |
|
n.v. |
-0.37 |
-0.02 |
n.v. |
n.v. |
|
hydroxysteroid dehydrogenase-like protein 2 |
| 6754254 |
|
Hsp90aa1 |
|
1600568 |
144752 |
539280 |
1735339 |
2077954 |
|
0 |
-0.01 |
-0.01 |
0.07 |
-0.02 |
|
heat shock protein HSP 90-alpha |
| 40556608 |
|
Hsp90ab1 |
|
1923523 |
156906 |
535897 |
1602218 |
2319839 |
|
0 |
-0.05 |
-0.01 |
0.09 |
-0.01 |
|
heat shock protein HSP 90-beta |
| 6755863 |
|
Hsp90b1 |
|
1648145 |
159469 |
197086 |
66311 |
326276 |
|
-0.02 |
-0.23 |
-0.25 |
-0.01 |
-0.45 |
|
endoplasmin precursor |
| 30089677 |
|
Hspa13 |
|
0 |
1129 |
0 |
0 |
0 |
|
n.v. |
-0.2 |
n.v. |
n.v. |
n.v. |
|
heat shock 70 kDa protein 13 precursor |
| 82880662 |
|
Hspa14 |
|
0 |
3386 |
11468 |
18622 |
6726 |
|
n.v. |
0.2 |
-0.03 |
0.09 |
0.1 |
|
heat shock 70 kDa protein 14 isoform 1 |
| 124339829 |
|
Hspa1a |
|
1371084 |
133766 |
338075 |
667050 |
390940 |
|
0.06 |
0.1 |
0.08 |
0.08 |
0.02 |
|
heat shock 70 kDa protein 1A |
| 124339826 |
|
Hspa1b |
|
1394589 |
139087 |
340020 |
680580 |
393264 |
|
0.06 |
0.1 |
0.08 |
0.08 |
0.02 |
|
heat shock 70 kDa protein 1B |
| 124339838 |
|
Hspa1l |
|
1090526 |
59436 |
270367 |
415974 |
293719 |
|
0.05 |
0.07 |
0.05 |
0.02 |
-0.01 |
|
heat shock 70 kDa protein 1-like |
| 31560686 |
|
Hspa2 |
|
1488883 |
119059 |
333988 |
497584 |
436037 |
|
0 |
0.05 |
0.04 |
-0.02 |
-0.01 |
|
heat shock-related 70 kDa protein 2 |
| 112293266 |
|
Hspa4 |
|
25061 |
3814 |
54138 |
93561 |
747727 |
|
0.17 |
0.01 |
0.02 |
0.11 |
0.01 |
|
heat shock 70 kDa protein 4 |
| 40254361 |
|
Hspa4l |
|
8000 |
1975 |
8408 |
14128 |
68112 |
|
-0.09 |
-0.02 |
-0.02 |
0.04 |
0.02 |
|
heat shock 70 kDa protein 4L |
| 254540166 |
|
Hspa5 |
|
1780827 |
108196 |
278796 |
170432 |
133055 |
|
0.03 |
-0.2 |
-0.19 |
-0.19 |
-0.1 |
|
78 kDa glucose-regulated protein precursor |
| 31981690 |
|
Hspa8 |
|
2535072 |
308735 |
666232 |
1629672 |
1016985 |
|
0.03 |
0.06 |
0.07 |
0.03 |
0.01 |
|
heat shock cognate 71 kDa protein |
| 162461907 |
|
Hspa9 |
|
1064092 |
118379 |
12208 |
4911 |
21173 |
|
-0.04 |
-0.09 |
-0.28 |
-0.41 |
-0.25 |
|
stress-70 protein, mitochondrial |
| 158937312 |
|
Hspb1 |
|
0 |
0 |
0 |
0 |
589 |
|
n.v. |
n.v. |
n.v. |
n.v. |
0.31 |
|
heat shock protein beta-1 |
| 110625938 |
|
Hspb11 |
|
0 |
44 |
23 |
3111 |
557 |
|
n.v. |
0.1 |
0.39 |
0.66 |
0.24 |
|
heat shock protein beta-11 |
| 120587017 |
|
Hspbap1 |
|
0 |
0 |
0 |
0 |
2142 |
|
n.v. |
n.v. |
n.v. |
n.v. |
-0.21 |
|
HSPB1-associated protein 1 |
| 13195602 |
|
Hspbp1 |
|
0 |
0 |
3104 |
0 |
15315 |
|
n.v. |
n.v. |
0.14 |
n.v. |
0.33 |
|
hsp70-binding protein 1 |
| 183396771 |
|
Hspd1 |
|
1972400 |
117155 |
18302 |
8538 |
42281 |
|
-0.05 |
-0.1 |
-0.38 |
-0.19 |
-0.34 |
|
60 kDa heat shock protein, mitochondrial |
| 6680309 |
|
Hspe1 |
|
53197 |
9661 |
2147 |
33 |
12209 |
|
0.05 |
-0.13 |
-0.35 |
-2.66 |
-0.3 |
|
10 kDa heat shock protein, mitochondrial |
| 183979966 |
|
Hspg2 |
|
0 |
2762 |
184 |
0 |
0 |
|
n.v. |
0.24 |
-0.15 |
n.v. |
n.v. |
|
basement membrane-specific heparan sulfate proteoglycan
core protein precursor |
| 114145505 |
|
Hsph1 |
|
8000 |
2117 |
14443 |
29059 |
160975 |
|
-0.09 |
0.09 |
0.06 |
0.1 |
0.08 |
|
heat shock protein 105 kDa |
| 225690589 |
|
Htatip2 |
|
0 |
148 |
53 |
0 |
0 |
|
n.v. |
-0.2 |
0.43 |
n.v. |
n.v. |
|
oxidoreductase HTATIP2 isoform a precursor |
| 225690591 |
|
Htatip2 |
|
0 |
148 |
53 |
0 |
0 |
|
n.v. |
-0.2 |
0.43 |
n.v. |
n.v. |
|
oxidoreductase HTATIP2 isoform b |
| 23956212;321267528 |
|
Htatsf1 |
|
0 |
54 |
318 |
2816 |
9531 |
|
n.v. |
-0.09 |
-0.22 |
-0.21 |
0.05 |
|
HIV Tat-specific factor 1 homolog |
| 10946684 |
|
Htr6 |
|
0 |
0 |
11908 |
2153 |
0 |
|
n.v. |
n.v. |
0.33 |
-0.15 |
n.v. |
|
5-hydroxytryptamine receptor 6 |
| 229093139 |
|
Htra1 |
|
0 |
585 |
40 |
65 |
0 |
|
n.v. |
0.47 |
-0.08 |
0.05 |
n.v. |
|
serine protease HTRA1 precursor |
| 254281222 |
|
Htra2 |
|
0 |
493 |
0 |
0 |
0 |
|
n.v. |
0 |
n.v. |
n.v. |
n.v. |
|
serine protease HTRA2, mitochondrial |
| 45439304 |
|
Htt |
|
0 |
61 |
64 |
1302 |
728 |
|
n.v. |
-0.04 |
-0.04 |
0.25 |
-0.09 |
|
huntingtin |
| 6680331 |
|
Hus1 |
|
0 |
0 |
0 |
0 |
1221 |
|
n.v. |
n.v. |
n.v. |
n.v. |
-0.18 |
|
checkpoint protein HUS1 |
| 146231996 |
|
Huwe1 |
|
0 |
169 |
556 |
32488 |
43663 |
|
n.v. |
0.12 |
0.12 |
0.23 |
0.09 |
|
E3 ubiquitin-protein ligase HUWE1 |
| 116812879 |
|
Hyal4 |
|
0 |
409 |
0 |
0 |
0 |
|
n.v. |
0.07 |
n.v. |
n.v. |
n.v. |
|
hyaluronidase-4 |
| 46361984 |
|
Hydin |
|
29894 |
4296 |
18251 |
4355 |
82046 |
|
0.14 |
0.12 |
0.06 |
0.2 |
0.14 |
|
hydrocephalus-inducing protein |
| 157951706 |
|
Hyou1 |
|
48950 |
13844 |
5410 |
0 |
9960 |
|
0.08 |
-0.21 |
-0.27 |
n.v. |
-0.47 |
|
hypoxia up-regulated protein 1 precursor |
| 27229055 |
|
Hypk |
|
0 |
0 |
815 |
6508 |
2013 |
|
n.v. |
n.v. |
-0.03 |
0.16 |
0.06 |
|
huntingtin-interacting protein K |
| 146260276 |
|
I830012O16Rik |
|
0 |
0 |
200 |
0 |
3406 |
|
n.v. |
n.v. |
0.18 |
n.v. |
0.29 |
|
interferon-induced protein with tetratricopeptide repeats
3-like |
| 27754071 |
|
Iah1 |
|
0 |
956 |
618 |
0 |
9960 |
|
n.v. |
0.24 |
0.02 |
n.v. |
0.1 |
|
isoamyl acetate-hydrolyzing esterase 1 homolog |
| 254553372 |
|
Iars |
|
0 |
3138 |
6910 |
338850 |
643 |
|
n.v. |
0.23 |
-0.07 |
0.06 |
-0.35 |
|
isoleucine--tRNA ligase, cytoplasmic |
| 38490690 |
|
Iars2 |
|
13437 |
12705 |
176 |
0 |
75 |
|
0.08 |
0.01 |
-0.39 |
n.v. |
-0.3 |
|
isoleucine--tRNA ligase, mitochondrial precursor |
| 124486857 |
|
Ibtk |
|
0 |
0 |
44 |
0 |
0 |
|
n.v. |
n.v. |
0.22 |
n.v. |
n.v. |
|
inhibitor of Bruton tyrosine kinase |
| 255522770 |
|
Ick |
|
0 |
2261 |
3440 |
4330 |
34420 |
|
n.v. |
0.15 |
-0.03 |
0.42 |
0.29 |
|
serine/threonine-protein kinase ICK |
| 7657220 |
|
Icosl |
|
0 |
42 |
0 |
0 |
0 |
|
n.v. |
0.58 |
n.v. |
n.v. |
n.v. |
|
ICOS ligand precursor |
| 19387848 |
|
Ict1 |
|
0 |
134 |
0 |
0 |
0 |
|
n.v. |
-0.18 |
n.v. |
n.v. |
n.v. |
|
peptidyl-tRNA hydrolase ICT1, mitochondrial |
| 459352741 |
|
Ide |
|
0 |
100 |
1157 |
0 |
0 |
|
n.v. |
0.04 |
0.08 |
n.v. |
n.v. |
|
insulin-degrading enzyme |
| 121583922 |
|
Ide |
|
0 |
113 |
4444 |
16862 |
105114 |
|
n.v. |
0.05 |
0 |
0.37 |
0.03 |
|
insulin-degrading enzyme |
| 162417975 |
|
Idh1 |
|
17482 |
45326 |
29344 |
2488 |
638501 |
|
0.21 |
0.12 |
0.1 |
-0.43 |
0.16 |
|
isocitrate dehydrogenase [NADP] cytoplasmic |
| 225579033 |
|
Idh2 |
|
766162 |
114544 |
4604 |
0 |
111904 |
|
-0.05 |
-0.14 |
-0.34 |
n.v. |
-0.29 |
|
isocitrate dehydrogenase [NADP], mitochondrial
precursor |
| 18250284 |
|
Idh3a |
|
171418 |
16182 |
1793 |
0 |
10624 |
|
-0.08 |
-0.1 |
-0.43 |
n.v. |
-0.24 |
|
isocitrate dehydrogenase [NAD] subunit alpha,
mitochondrial precursor |
| 18700024 |
|
Idh3b |
|
25317 |
530 |
47 |
426 |
0 |
|
0.03 |
0.04 |
0.11 |
-0.32 |
-0.41 |
|
isocitrate dehydrogenase 3, beta subunit |
| 6680345 |
|
Idh3g |
|
1446 |
301 |
0 |
0 |
0 |
|
0.67 |
-0.18 |
n.v. |
n.v. |
n.v. |
|
isocitrate dehydrogenase [NAD] subunit gamma 1,
mitochondrial precursor |
| 281604088 |
|
Idi1 |
|
293 |
4513 |
2573 |
573 |
67834 |
|
0.18 |
0.1 |
0.13 |
-0.3 |
0.28 |
|
isopentenyl-diphosphate Delta-isomerase 1 |
| 347582671 |
|
Ido2 |
|
0 |
0 |
0 |
2701 |
0 |
|
n.v. |
n.v. |
n.v. |
-0.42 |
n.v. |
|
indoleamine 2,3-dioxygenase 2 |
| 13384796 |
|
Ier3ip1 |
|
366 |
255 |
442 |
0 |
0 |
|
0.06 |
-0.23 |
-0.09 |
n.v. |
n.v. |
|
immediate early response 3-interacting protein 1
precursor |
| 118130979 |
|
Ifi204 |
|
29894 |
4296 |
18251 |
4355 |
82120 |
|
0.14 |
0.12 |
0.06 |
0.2 |
0.06 |
|
interferon-activable protein 204 |
| 125628657 |
|
Ifi30 |
|
60337 |
13932 |
9706 |
2276 |
57007 |
|
0.14 |
0.03 |
-0.26 |
-0.33 |
-0.07 |
|
gamma-interferon-inducible lysosomal thiol reductase
precursor |
| 21312544 |
|
Ifi35 |
|
0 |
106 |
815 |
0 |
4102 |
|
n.v. |
0.13 |
0.06 |
n.v. |
0.15 |
|
interferon-induced 35 kDa protein homolog |
| 410991922 |
|
Ifi47 |
|
0 |
0 |
94 |
0 |
2463 |
|
n.v. |
n.v. |
0.1 |
n.v. |
-0.09 |
|
interferon gamma inducible protein 47 |
| 257096036 |
|
Ifih1 |
|
0 |
0 |
16 |
0 |
2142 |
|
n.v. |
n.v. |
-0.06 |
n.v. |
0.09 |
|
interferon-induced helicase C domain-containing protein 1
isoform 1 |
| 257096038 |
|
Ifih1 |
|
0 |
0 |
16 |
0 |
2142 |
|
n.v. |
n.v. |
-0.06 |
n.v. |
0.09 |
|
interferon-induced helicase C domain-containing protein 1
isoform 2 |
| 110626104 |
|
Ifit1 |
|
0 |
532 |
1652 |
15438 |
2849 |
|
n.v. |
0.15 |
0.12 |
0.1 |
-0.34 |
|
interferon-induced protein with tetratricopeptide repeats
1 |
| 6680363 |
|
Ifit2 |
|
0 |
0 |
244 |
0 |
578 |
|
n.v. |
n.v. |
0.15 |
n.v. |
0.84 |
|
interferon-induced protein with tetratricopeptide repeats
2 |
| 6754288 |
|
Ifit3 |
|
0 |
0 |
200 |
0 |
3406 |
|
n.v. |
n.v. |
0.18 |
n.v. |
0.29 |
|
interferon-induced protein with tetratricopeptide repeats
3 |
| 13507626 |
|
Ifitm2 |
|
0 |
2601 |
2109 |
65 |
0 |
|
n.v. |
-0.32 |
-0.31 |
-0.7 |
n.v. |
|
interferon-induced transmembrane protein 2 |
| 21539593 |
|
Ifitm3 |
|
0 |
2042 |
2356 |
1040 |
0 |
|
n.v. |
-0.18 |
-0.12 |
-0.21 |
n.v. |
|
interferon-induced transmembrane protein 3 |
| 226062273 |
|
Ifrd1 |
|
0 |
0 |
59 |
6303 |
0 |
|
n.v. |
n.v. |
0.05 |
0.28 |
n.v. |
|
interferon-related developmental regulator 1 |
| 268370099 |
|
Ift122 |
|
0 |
0 |
37 |
0 |
0 |
|
n.v. |
n.v. |
0.46 |
n.v. |
n.v. |
|
intraflagellar transport protein 122 homolog isoform
1 |
| 268370101 |
|
Ift122 |
|
0 |
0 |
37 |
0 |
0 |
|
n.v. |
n.v. |
0.46 |
n.v. |
n.v. |
|
intraflagellar transport protein 122 homolog isoform
2 |
| 184186088 |
|
Ift140 |
|
0 |
0 |
15 |
0 |
0 |
|
n.v. |
n.v. |
-0.38 |
n.v. |
n.v. |
|
intraflagellar transport 140 |
| 281182704 |
|
Ift172 |
|
0 |
0 |
13 |
0 |
0 |
|
n.v. |
n.v. |
0.34 |
n.v. |
n.v. |
|
intraflagellar transport protein 172 homolog |
| 9506865 |
|
Ift20 |
|
0 |
0 |
0 |
98 |
107 |
|
n.v. |
n.v. |
n.v. |
-0.96 |
-0.5 |
|
intraflagellar transport protein 20 homolog |
| 21313158 |
|
Ift27 |
|
0 |
246 |
29 |
606 |
1799 |
|
n.v. |
0.08 |
0.35 |
0.25 |
0.09 |
|
intraflagellar transport protein 27 homolog |
| 31981999 |
|
Ift52 |
|
0 |
0 |
0 |
0 |
632 |
|
n.v. |
n.v. |
n.v. |
n.v. |
-1.44 |
|
intraflagellar transport protein 52 homolog |
| 28076907 |
|
Ift80 |
|
0 |
182 |
117 |
3782 |
56139 |
|
n.v. |
-0.52 |
-0.12 |
0 |
0.11 |
|
intraflagellar transport protein 80 homolog |
| 15638942 |
|
Ift81 |
|
0 |
104 |
7 |
933 |
0 |
|
n.v. |
0.06 |
-0.02 |
0.22 |
n.v. |
|
intraflagellar transport protein 81 homolog |
| 304555605 |
|
Igbp1 |
|
201 |
292 |
233 |
1784 |
2013 |
|
0.3 |
0.25 |
0.12 |
-0.07 |
0.17 |
|
immunoglobulin-binding protein 1 |
| 113866007 |
|
Igbp1b |
|
0 |
0 |
26 |
0 |
0 |
|
n.v. |
n.v. |
0.12 |
n.v. |
n.v. |
|
immunoglobulin-binding protein 1b |
| 112983656 |
|
Igf1r |
|
0 |
451 |
3777 |
0 |
0 |
|
n.v. |
0.18 |
0.08 |
n.v. |
n.v. |
|
insulin-like growth factor 1 receptor precursor |
| 6753518 |
|
Igf2bp1 |
|
0 |
192 |
3941 |
3561 |
0 |
|
n.v. |
0.05 |
0.16 |
0.14 |
n.v. |
|
insulin-like growth factor 2 mRNA-binding protein 1 |
| 145207996 |
|
Igf2bp2 |
|
28667 |
18082 |
99959 |
195840 |
942 |
|
-0.08 |
0.15 |
0.15 |
0 |
-0.5 |
|
insulin-like growth factor 2 mRNA-binding protein 2 |
| 225543383 |
|
Igf2bp3 |
|
0 |
4551 |
11153 |
59877 |
0 |
|
n.v. |
0.04 |
0.09 |
-0.06 |
n.v. |
|
insulin-like growth factor 2 mRNA-binding protein 3 |
| 133778978 |
|
Igf2r |
|
0 |
395 |
6326 |
1563 |
0 |
|
n.v. |
-0.55 |
0.09 |
0.33 |
n.v. |
|
cation-independent mannose-6-phosphate receptor precursor |
| 226958445 |
|
Igfbp7 |
|
0 |
1088 |
998 |
327 |
728 |
|
n.v. |
-0.06 |
-0.21 |
-0.16 |
-0.18 |
|
insulin-like growth factor-binding protein 7 isoform 2
precursor |
| 226958453 |
|
Igfbp7 |
|
0 |
1088 |
462 |
327 |
728 |
|
n.v. |
-0.06 |
-0.21 |
-0.16 |
-0.18 |
|
insulin-like growth factor-binding protein 7 isoform 1
precursor |
| 153945808 |
|
Ighmbp2 |
|
0 |
0 |
0 |
25 |
0 |
|
n.v. |
n.v. |
n.v. |
0.35 |
n.v. |
|
DNA-binding protein SMUBP-2 |
| 262050642 |
|
Igsf1 |
|
0 |
0 |
79 |
0 |
0 |
|
n.v. |
n.v. |
-0.05 |
n.v. |
n.v. |
|
immunoglobulin superfamily member 1 isoform 3
precursor |
| 29244558 |
|
Igsf1 |
|
0 |
0 |
79 |
0 |
0 |
|
n.v. |
n.v. |
-0.05 |
n.v. |
n.v. |
|
immunoglobulin superfamily member 1 isoform short
precursor |
| 34330164 |
|
Igsf1 |
|
0 |
0 |
79 |
0 |
0 |
|
n.v. |
n.v. |
-0.05 |
n.v. |
n.v. |
|
immunoglobulin superfamily member 1 isoform long
precursor |
| 205360918 |
|
Igtp |
|
0 |
691 |
0 |
0 |
0 |
|
n.v. |
-0.56 |
n.v. |
n.v. |
n.v. |
|
interferon gamma induced GTPase |
| 158937298 |
|
Ikbkap |
|
0 |
461 |
1561 |
37613 |
1157 |
|
n.v. |
-0.38 |
-0.01 |
0.09 |
-0.05 |
|
elongator complex protein 1 |
| 229576825 |
|
Ikbkb |
|
0 |
0 |
108 |
933 |
6586 |
|
n.v. |
n.v. |
0.06 |
0.1 |
0.15 |
|
inhibitor of nuclear factor kappa-B kinase subunit beta
isoform 1 |
| 33469101 |
|
Ikbkb |
|
0 |
0 |
108 |
933 |
6586 |
|
n.v. |
n.v. |
0.06 |
0.1 |
0.15 |
|
inhibitor of nuclear factor kappa-B kinase subunit beta
isoform 2 |
| 209862941 |
|
Ikbkg |
|
0 |
0 |
0 |
0 |
6554 |
|
n.v. |
n.v. |
n.v. |
n.v. |
0.22 |
|
NF-kappa-B essential modulator isoform 3 |
| 238637310 |
|
Ikbkg |
|
0 |
0 |
0 |
0 |
6554 |
|
n.v. |
n.v. |
n.v. |
n.v. |
0.22 |
|
NF-kappa-B essential modulator isoform 4 |
| 238637312 |
|
Ikbkg |
|
0 |
0 |
0 |
0 |
6554 |
|
n.v. |
n.v. |
n.v. |
n.v. |
0.22 |
|
NF-kappa-B essential modulator isoform 5 |
| 238637314 |
|
Ikbkg |
|
0 |
0 |
0 |
0 |
6554 |
|
n.v. |
n.v. |
n.v. |
n.v. |
0.22 |
|
NF-kappa-B essential modulator isoform 1 |
| 238637316 |
|
Ikbkg |
|
0 |
0 |
0 |
0 |
6554 |
|
n.v. |
n.v. |
n.v. |
n.v. |
0.22 |
|
NF-kappa-B essential modulator isoform 2 |
| 111607428 |
|
Il10rb |
|
0 |
140 |
281 |
0 |
0 |
|
n.v. |
0.01 |
-0.22 |
n.v. |
n.v. |
|
interleukin-10 receptor subunit beta precursor |
| 6754326 |
|
Il18rap |
|
0 |
0 |
31 |
0 |
0 |
|
n.v. |
n.v. |
0.63 |
n.v. |
n.v. |
|
interleukin-18 receptor accessory protein precursor |
| 13624317 |
|
Il1rn |
|
0 |
0 |
0 |
0 |
1328 |
|
n.v. |
n.v. |
n.v. |
n.v. |
0.43 |
|
interleukin-1 receptor antagonist protein isoform 1 |
| 227116259 |
|
Il1rn |
|
0 |
0 |
0 |
0 |
1328 |
|
n.v. |
n.v. |
n.v. |
n.v. |
0.43 |
|
interleukin-1 receptor antagonist protein isoform 3 |
| 89257344 |
|
Il1rn |
|
0 |
0 |
0 |
0 |
1328 |
|
n.v. |
n.v. |
n.v. |
n.v. |
0.43 |
|
interleukin-1 receptor antagonist protein isoform 2
precursor |
| 13385872 |
|
Ilf2 |
|
106065 |
7937 |
31532 |
76535 |
0 |
|
-0.06 |
0.28 |
0.04 |
-0.08 |
n.v. |
|
interleukin enhancer-binding factor 2 |
| 472339066;111607430 |
|
Ilf3 |
|
42690 |
0 |
28624 |
0 |
0 |
|
0.05 |
n.v. |
0.06 |
n.v. |
n.v. |
|
interleukin enhancer-binding factor 3 isoform 1 |
| 472339106 |
|
Ilf3 |
|
34360 |
0 |
6443 |
0 |
0 |
|
0.02 |
n.v. |
0.1 |
n.v. |
n.v. |
|
interleukin enhancer-binding factor 3 isoform 5 |
| 111607430 |
|
Ilf3 |
|
0 |
0 |
0 |
30516 |
0 |
|
n.v. |
n.v. |
n.v. |
0.17 |
n.v. |
|
interleukin enhancer-binding factor 3 isoform 1 |
| 111607432 |
|
Ilf3 |
|
42690 |
0 |
28624 |
30516 |
0 |
|
0.05 |
n.v. |
0.06 |
0.17 |
n.v. |
|
interleukin enhancer-binding factor 3 isoform 2 |
| 111607434 |
|
Ilf3 |
|
42690 |
0 |
28624 |
30516 |
0 |
|
0.05 |
n.v. |
0.06 |
0.17 |
n.v. |
|
interleukin enhancer-binding factor 3 isoform 3 |
| 111607436 |
|
Ilf3 |
|
42690 |
0 |
28624 |
30516 |
0 |
|
0.05 |
n.v. |
0.06 |
0.17 |
n.v. |
|
interleukin enhancer-binding factor 3 isoform 4 |
| 240255651;240255653 |
|
Ilk |
|
0 |
0 |
7380 |
0 |
0 |
|
n.v. |
n.v. |
0.05 |
n.v. |
n.v. |
|
integrin-linked protein kinase |
| 240255653;240255651 |
|
Ilk |
|
0 |
3277 |
0 |
15733 |
2624 |
|
n.v. |
0.17 |
n.v. |
0.06 |
0.27 |
|
integrin-linked protein kinase |
| 39930415 |
|
Ilkap |
|
0 |
321 |
0 |
0 |
3191 |
|
n.v. |
0.16 |
n.v. |
n.v. |
-0.01 |
|
integrin-linked kinase-associated serine/threonine
phosphatase 2C |
| 30424591 |
|
Ilvbl |
|
1318 |
2027 |
913 |
0 |
0 |
|
0.19 |
-0.41 |
-0.48 |
n.v. |
n.v. |
|
acetolactate synthase-like protein |
| 358439483 |
|
Immt |
|
146723 |
44988 |
15287 |
0 |
0 |
|
0.03 |
-0.08 |
-0.36 |
n.v. |
n.v. |
|
mitochondrial inner membrane protein isoform 2 |
| 358439528 |
|
Immt |
|
146723 |
44988 |
15066 |
0 |
0 |
|
0.03 |
-0.08 |
-0.36 |
n.v. |
n.v. |
|
mitochondrial inner membrane protein isoform 3 |
| 358439536 |
|
Immt |
|
141176 |
44988 |
14042 |
0 |
0 |
|
0.01 |
-0.08 |
-0.36 |
n.v. |
n.v. |
|
mitochondrial inner membrane protein isoform 4 |
| 358439544 |
|
Immt |
|
141176 |
44950 |
14263 |
0 |
0 |
|
0.01 |
-0.09 |
-0.38 |
n.v. |
n.v. |
|
mitochondrial inner membrane protein isoform 5 |
| 358439552 |
|
Immt |
|
77178 |
24514 |
8341 |
0 |
0 |
|
0.02 |
-0.1 |
-0.32 |
n.v. |
n.v. |
|
mitochondrial inner membrane protein isoform 6 |
| 70608131 |
|
Immt |
|
146723 |
45710 |
15287 |
0 |
0 |
|
0.03 |
-0.1 |
-0.36 |
n.v. |
n.v. |
|
mitochondrial inner membrane protein isoform 1 |
| 19527196 |
|
Imp3 |
|
4778 |
79 |
3 |
237 |
0 |
|
-0.07 |
-0.34 |
0.26 |
0.44 |
n.v. |
|
U3 small nucleolar ribonucleoprotein protein IMP3 |
| 31980942 |
|
Impa1 |
|
16311 |
10701 |
15952 |
11722 |
227738 |
|
0.15 |
0 |
-0.04 |
0 |
0.02 |
|
inositol monophosphatase 1 |
| 16716595 |
|
Impa2 |
|
0 |
79 |
266 |
0 |
11963 |
|
n.v. |
0.98 |
0.09 |
n.v. |
0.1 |
|
inositol monophosphatase 2 |
| 29244210 |
|
Impad1 |
|
0 |
1954 |
546 |
0 |
0 |
|
n.v. |
-0.25 |
-0.32 |
n.v. |
n.v. |
|
inositol monophosphatase 3 |
| 34328209 |
|
Impdh1 |
|
0 |
0 |
0 |
9389 |
0 |
|
n.v. |
n.v. |
n.v. |
0.08 |
n.v. |
|
inosine-5'-monophosphate dehydrogenase 1 |
| 31981382 |
|
Impdh2 |
|
0 |
1424 |
1010 |
184822 |
16118 |
|
n.v. |
-0.01 |
-0.08 |
0.17 |
-0.06 |
|
inosine-5'-monophosphate dehydrogenase 2 |
| 55769576 |
|
Inadl |
|
0 |
0 |
502 |
0 |
0 |
|
n.v. |
n.v. |
0.66 |
n.v. |
n.v. |
|
inaD-like protein isoform 4 |
| 55769581 |
|
Inadl |
|
0 |
0 |
587 |
0 |
0 |
|
n.v. |
n.v. |
0.24 |
n.v. |
n.v. |
|
inaD-like protein isoform 2 |
| 6671754 |
|
Inadl |
|
0 |
0 |
502 |
0 |
0 |
|
n.v. |
n.v. |
0.66 |
n.v. |
n.v. |
|
inaD-like protein isoform 3 |
| 55769578 |
|
Inadl |
|
293 |
35 |
1166 |
0 |
0 |
|
0.14 |
0.86 |
0.31 |
n.v. |
n.v. |
|
inaD-like protein isoform 1 |
| 114052809 |
|
Inf2 |
|
531 |
2 |
202 |
25 |
1167 |
|
0.63 |
0.1 |
-0.09 |
-0.42 |
-0.8 |
|
inverted formin-2 |
| 6678281 |
|
Inmt |
|
8732 |
6872 |
14333 |
8652 |
368846 |
|
-0.07 |
-0.12 |
-0.29 |
-0.05 |
-0.29 |
|
indolethylamine N-methyltransferase |
| 170650609 |
|
Inpp1 |
|
0 |
98 |
97 |
0 |
33307 |
|
n.v. |
0.23 |
0.02 |
n.v. |
0.09 |
|
inositol polyphosphate 1-phosphatase |
| 158853999 |
|
Inpp5d |
|
0 |
0 |
645 |
5615 |
0 |
|
n.v. |
n.v. |
-0.43 |
-0.15 |
n.v. |
|
phosphatidylinositol 3,4,5-trisphosphate 5-phosphatase 1
isoform 1 |
| 158854001 |
|
Inpp5d |
|
0 |
0 |
645 |
5615 |
0 |
|
n.v. |
n.v. |
-0.43 |
-0.15 |
n.v. |
|
phosphatidylinositol 3,4,5-trisphosphate 5-phosphatase 1
isoform 2 |
| 158854003 |
|
Inpp5d |
|
0 |
0 |
645 |
5615 |
0 |
|
n.v. |
n.v. |
-0.43 |
-0.15 |
n.v. |
|
phosphatidylinositol 3,4,5-trisphosphate 5-phosphatase 1
isoform 3 |
| 170172575 |
|
Inppl1 |
|
29894 |
4296 |
18251 |
4355 |
31015 |
|
0.14 |
0.12 |
0.06 |
0.2 |
0.05 |
|
phosphatidylinositol 3,4,5-trisphosphate 5-phosphatase 2 |
| 157057178 |
|
Insr |
|
0 |
52 |
768 |
0 |
0 |
|
n.v. |
0.05 |
0.07 |
n.v. |
n.v. |
|
insulin receptor precursor |
| 160333073 |
|
Insrr |
|
0 |
52 |
66 |
0 |
0 |
|
n.v. |
0.05 |
0.14 |
n.v. |
n.v. |
|
insulin receptor-related protein precursor |
| 294832004 |
|
Ints1 |
|
0 |
0 |
29 |
0 |
0 |
|
n.v. |
n.v. |
0.24 |
n.v. |
n.v. |
|
integrator complex subunit 1 |
| 21313674 |
|
Ints12 |
|
0 |
0 |
0 |
41 |
21 |
|
n.v. |
n.v. |
n.v. |
0.32 |
-0.42 |
|
integrator complex subunit 12 |
| 31652266 |
|
Ints3 |
|
934 |
0 |
228 |
2014 |
1831 |
|
-0.12 |
n.v. |
-0.24 |
-0.03 |
0.08 |
|
integrator complex subunit 3 |
| 30794414 |
|
Ints4 |
|
1080 |
0 |
181 |
0 |
0 |
|
-0.15 |
n.v. |
-0.1 |
n.v. |
n.v. |
|
integrator complex subunit 4 |
| 28849895 |
|
Ints5 |
|
0 |
0 |
37 |
0 |
0 |
|
n.v. |
n.v. |
0.23 |
n.v. |
n.v. |
|
integrator complex subunit 5 |
| 153791768 |
|
Ints7 |
|
513 |
0 |
0 |
434 |
0 |
|
-0.05 |
n.v. |
n.v. |
-0.28 |
n.v. |
|
integrator complex subunit 7 |
| 31981980 |
|
Ints9 |
|
0 |
0 |
0 |
900 |
353 |
|
n.v. |
n.v. |
n.v. |
0.24 |
-0.01 |
|
integrator complex subunit 9 isoform 1 |
| 359279877 |
|
Ints9 |
|
0 |
0 |
0 |
900 |
353 |
|
n.v. |
n.v. |
n.v. |
0.24 |
-0.01 |
|
integrator complex subunit 9 isoform 2 |
| 111120342 |
|
Invs |
|
0 |
0 |
0 |
0 |
2677 |
|
n.v. |
n.v. |
n.v. |
n.v. |
0.09 |
|
inversin |
| 31541898 |
|
Ipo11 |
|
0 |
0 |
16 |
4739 |
1917 |
|
n.v. |
n.v. |
-0.19 |
-0.14 |
0.28 |
|
importin-11 |
| 19745156 |
|
Ipo4 |
|
769 |
503 |
3213 |
21577 |
38908 |
|
0.01 |
0.37 |
0.01 |
0.12 |
0.08 |
|
importin-4 |
| 29789199 |
|
Ipo5 |
|
146 |
430 |
23210 |
85809 |
184225 |
|
-0.69 |
0.4 |
0.02 |
0.04 |
0.07 |
|
importin-5 |
| 74229034 |
|
Ipo7 |
|
0 |
84 |
2810 |
14636 |
67373 |
|
n.v. |
0.55 |
0.06 |
0.07 |
0.07 |
|
importin-7 |
| 124487445 |
|
Ipo8 |
|
0 |
0 |
0 |
2595 |
2367 |
|
n.v. |
n.v. |
n.v. |
0.2 |
-0.25 |
|
importin-8 |
| 112734861 |
|
Ipo9 |
|
879 |
1557 |
5082 |
33970 |
44776 |
|
0 |
0.01 |
0.17 |
0.12 |
0.12 |
|
importin-9 |
| 242332572 |
|
Iqgap1 |
|
52374 |
95170 |
218102 |
1056674 |
752696 |
|
0.31 |
0.04 |
0.08 |
0.01 |
-0.06 |
|
ras GTPase-activating-like protein IQGAP1 |
| 118344444 |
|
Iqgap2 |
|
0 |
3768 |
17055 |
48630 |
49681 |
|
n.v. |
0.12 |
0.09 |
0.03 |
-0.07 |
|
ras GTPase-activating-like protein IQGAP2 |
| 118344446 |
|
Iqgap3 |
|
0 |
605 |
4686 |
26456 |
21216 |
|
n.v. |
0.15 |
0.17 |
0.06 |
-0.06 |
|
IQ motif containing GTPase activating protein 3 |
| 23943898 |
|
Irak4 |
|
0 |
296 |
948 |
0 |
2303 |
|
n.v. |
0.26 |
0.04 |
n.v. |
-0.53 |
|
interleukin-1 receptor-associated kinase 4 |
| 254281215 |
|
Ireb2 |
|
0 |
0 |
404 |
0 |
11556 |
|
n.v. |
n.v. |
-0.17 |
n.v. |
-0.08 |
|
iron-responsive element-binding protein 2 |
| 31982348 |
|
Irf2bp1 |
|
0 |
0 |
236 |
0 |
5001 |
|
n.v. |
n.v. |
-0.08 |
n.v. |
0.07 |
|
interferon regulatory factor 2-binding protein 1 |
| 257196179 |
|
Irf2bp2 |
|
0 |
0 |
919 |
475 |
5205 |
|
n.v. |
n.v. |
0.18 |
0.41 |
0.07 |
|
interferon regulatory factor 2-binding protein 2 |
| 22003884 |
|
Irf2bpl |
|
5016 |
6056 |
7289 |
7302 |
39282 |
|
-0.19 |
0.4 |
0.02 |
0.19 |
-0.09 |
|
interferon regulatory factor 2-binding protein-like |
| 8393627 |
|
Irf3 |
|
0 |
0 |
70 |
0 |
3663 |
|
n.v. |
n.v. |
0.2 |
n.v. |
0.25 |
|
interferon regulatory factor 3 |
| 114145467 |
|
Irf6 |
|
0 |
238 |
783 |
1220 |
11973 |
|
n.v. |
0.2 |
0.1 |
0.04 |
0.28 |
|
interferon regulatory factor 6 |
| 134031980 |
|
Irgc1 |
|
0 |
0 |
417 |
0 |
0 |
|
n.v. |
n.v. |
-0.21 |
n.v. |
n.v. |
|
interferon-inducible GTPase 5 |
| 6680351 |
|
Irgm1 |
|
2050 |
1620 |
6165 |
0 |
0 |
|
-0.29 |
-0.08 |
-0.08 |
n.v. |
n.v. |
|
immunity-related GTPase family M protein 1 |
| 208431800 |
|
Irgq |
|
0 |
0 |
0 |
0 |
5398 |
|
n.v. |
n.v. |
n.v. |
n.v. |
0.11 |
|
immunity-related GTPase family Q protein |
| 21312189 |
|
Isca1 |
|
0 |
687 |
0 |
0 |
0 |
|
n.v. |
0.01 |
n.v. |
n.v. |
n.v. |
|
iron-sulfur cluster assembly 1 homolog, mitochondrial
precursor |
| 254039596 |
|
Isca2 |
|
5290 |
4384 |
0 |
0 |
953 |
|
0.01 |
-0.08 |
n.v. |
n.v. |
0.03 |
|
iron-sulfur cluster assembly 2 homolog, mitochondrial
precursor |
| 21313484 |
|
Iscu |
|
165 |
582 |
0 |
0 |
3256 |
|
0.06 |
0.01 |
n.v. |
n.v. |
-0.06 |
|
iron-sulfur cluster assembly enzyme ISCU, mitochondrial
precursor |
| 226874851 |
|
Isg15 |
|
0 |
0 |
212 |
434 |
4220 |
|
n.v. |
n.v. |
-0.04 |
-1.41 |
-0.46 |
|
ubiquitin-like protein ISG15 precursor |
| 15805028 |
|
Isg20 |
|
604 |
115 |
598 |
1261 |
0 |
|
-0.01 |
0.03 |
0.04 |
0.22 |
n.v. |
|
interferon-stimulated gene 20 kDa protein |
| 29244084 |
|
Isg20l2 |
|
0 |
0 |
618 |
0 |
0 |
|
n.v. |
n.v. |
-0.25 |
n.v. |
n.v. |
|
interferon-stimulated 20 kDa exonuclease-like 2 |
| 31541909 |
|
Isoc1 |
|
0 |
741 |
66 |
2055 |
15357 |
|
n.v. |
0.03 |
0.17 |
0.18 |
0.04 |
|
isochorismatase domain-containing protein 1 |
| 197333728 |
|
Isoc2a |
|
458 |
1758 |
0 |
0 |
0 |
|
0.57 |
0.05 |
n.v. |
n.v. |
n.v. |
|
isochorismatase domain-containing protein 2A,
mitochondrial precursor |
| 21312626 |
|
Ist1 |
|
0 |
0 |
8745 |
8849 |
30972 |
|
n.v. |
n.v. |
0.21 |
-0.01 |
-0.08 |
|
IST1 homolog |
| 20149316 |
|
Isy1 |
|
0 |
0 |
0 |
1334 |
1446 |
|
n.v. |
n.v. |
n.v. |
0 |
-0.43 |
|
pre-mRNA-splicing factor ISY1 homolog |
| 12963757 |
|
Isyna1 |
|
0 |
1964 |
3979 |
35042 |
87133 |
|
n.v. |
0.18 |
0.06 |
0.24 |
0.02 |
|
inositol-3-phosphate synthase 1 |
| 343962614;124487317 |
|
Itch |
|
0 |
0 |
3129 |
0 |
0 |
|
n.v. |
n.v. |
0 |
n.v. |
n.v. |
|
E3 ubiquitin-protein ligase Itchy |
| 124487317 |
|
Itch |
|
2142 |
202 |
0 |
303 |
11 |
|
-0.46 |
0.53 |
n.v. |
-0.18 |
0.66 |
|
E3 ubiquitin-protein ligase Itchy |
| 268839462 |
|
Itfg1 |
|
0 |
1376 |
1136 |
0 |
0 |
|
n.v. |
-0.65 |
-0.16 |
n.v. |
n.v. |
|
T-cell immunomodulatory protein precursor |
| 19527142 |
|
Itfg2 |
|
0 |
0 |
70 |
0 |
0 |
|
n.v. |
n.v. |
0.14 |
n.v. |
n.v. |
|
integrin-alpha FG-GAP repeat-containing protein 2 |
| 46402185 |
|
Itfg3 |
|
0 |
1380 |
6516 |
0 |
0 |
|
n.v. |
-0.07 |
0.01 |
n.v. |
n.v. |
|
protein ITFG3 |
| 153791389 |
|
Itga1 |
|
0 |
960 |
2066 |
0 |
0 |
|
n.v. |
0.26 |
0.01 |
n.v. |
n.v. |
|
integrin alpha-1 precursor |
| 41054731 |
|
Itga2 |
|
0 |
56 |
508 |
0 |
0 |
|
n.v. |
-0.06 |
-0.16 |
n.v. |
n.v. |
|
integrin alpha-2 precursor |
| 7305189 |
|
Itga3 |
|
30608 |
17948 |
135980 |
30819 |
0 |
|
-0.02 |
0.05 |
-0.03 |
-0.17 |
n.v. |
|
integrin alpha-3 precursor |
| 225903442 |
|
Itga5 |
|
0 |
246 |
1061 |
0 |
0 |
|
n.v. |
0.34 |
0.03 |
n.v. |
n.v. |
|
integrin alpha-5 preproprotein |
| 485836844 |
|
Itga6 |
|
256 |
0 |
0 |
0 |
0 |
|
0.24 |
n.v. |
n.v. |
n.v. |
n.v. |
|
integrin alpha-6 isoform 2 precursor |
| 31982236 |
|
Itga6 |
|
842 |
3632 |
32050 |
0 |
0 |
|
0.3 |
0.11 |
-0.01 |
n.v. |
n.v. |
|
integrin alpha-6 isoform 1 precursor |
| 294997269 |
|
Itgad |
|
3661 |
0 |
2919 |
5984 |
0 |
|
0.14 |
n.v. |
0.04 |
0 |
n.v. |
|
integrin alpha-D |
| 154240716 |
|
Itgav |
|
9116 |
7882 |
54529 |
4486 |
0 |
|
-0.16 |
0.11 |
0 |
-0.37 |
n.v. |
|
integrin alpha-V precursor |
| 45504394 |
|
Itgb1 |
|
146778 |
94769 |
233824 |
35378 |
0 |
|
0.07 |
0.06 |
-0.04 |
-0.19 |
n.v. |
|
integrin beta-1 precursor |
| 6680488 |
|
Itgb1bp1 |
|
0 |
0 |
135 |
1113 |
0 |
|
n.v. |
n.v. |
-0.18 |
0.33 |
n.v. |
|
integrin beta-1-binding protein 1 |
| 111607447 |
|
Itgb2 |
|
0 |
0 |
793 |
0 |
0 |
|
n.v. |
n.v. |
-0.06 |
n.v. |
n.v. |
|
integrin beta-2 precursor |
| 110735426 |
|
Itgb4 |
|
3039 |
4851 |
12634 |
0 |
0 |
|
0.08 |
0.25 |
0.11 |
n.v. |
n.v. |
|
integrin beta-4 isoform 1 precursor |
| 110735428 |
|
Itgb4 |
|
3039 |
4668 |
12608 |
0 |
0 |
|
0.08 |
0.27 |
0.11 |
n.v. |
n.v. |
|
integrin beta-4 isoform 2 precursor |
| 225007617 |
|
Itgb5 |
|
769 |
301 |
7096 |
0 |
0 |
|
-0.05 |
0.25 |
0.07 |
n.v. |
n.v. |
|
integrin beta-5 isoform 2 precursor |
| 225007621 |
|
Itgb5 |
|
769 |
301 |
8174 |
0 |
0 |
|
-0.05 |
0.25 |
0.06 |
n.v. |
n.v. |
|
integrin beta-5 isoform 1 precursor |
| 10946686 |
|
Itgb6 |
|
0 |
678 |
7684 |
0 |
0 |
|
n.v. |
0.28 |
0.01 |
n.v. |
n.v. |
|
integrin beta-6 precursor |
| 160708008 |
|
Itgb7 |
|
0 |
0 |
793 |
0 |
0 |
|
n.v. |
n.v. |
-0.06 |
n.v. |
n.v. |
|
integrin beta-7 precursor |
| 6680502 |
|
Itm2b |
|
787 |
6582 |
2467 |
344 |
0 |
|
-0.34 |
-0.39 |
-0.5 |
-0.04 |
n.v. |
|
integral membrane protein 2B |
| 160333680 |
|
Itm2c |
|
0 |
42 |
0 |
0 |
0 |
|
n.v. |
-0.28 |
n.v. |
n.v. |
n.v. |
|
integral membrane protein 2C |
| 31982664 |
|
Itpa |
|
0 |
2050 |
4896 |
0 |
932 |
|
n.v. |
0.12 |
0.02 |
n.v. |
0.17 |
|
inosine triphosphate pyrophosphatase |
| 29789389 |
|
Itpk1 |
|
0 |
0 |
10 |
41 |
503 |
|
n.v. |
n.v. |
-0.2 |
0.15 |
-0.14 |
|
inositol-tetrakisphosphate 1-kinase |
| 291327470 |
|
Itpr1 |
|
0 |
426 |
277 |
0 |
0 |
|
n.v. |
-0.43 |
-0.36 |
n.v. |
n.v. |
|
inositol 1,4,5-trisphosphate receptor type 1 |
| 60592758 |
|
Itpr2 |
|
0 |
399 |
256 |
0 |
0 |
|
n.v. |
-0.47 |
-0.33 |
n.v. |
n.v. |
|
inositol 1,4,5-trisphosphate receptor type 2 isoform
2 |
| 60593032 |
|
Itpr2 |
|
0 |
399 |
256 |
0 |
0 |
|
n.v. |
-0.47 |
-0.33 |
n.v. |
n.v. |
|
inositol 1,4,5-trisphosphate receptor type 2 isoform
1 |
| 61102728 |
|
Itpr3 |
|
860 |
756 |
525 |
0 |
0 |
|
0.08 |
-0.18 |
-0.47 |
n.v. |
n.v. |
|
inositol 1,4,5-trisphosphate receptor type 3 |
| 160333276 |
|
Itsn1 |
|
0 |
0 |
0 |
0 |
418 |
|
n.v. |
n.v. |
n.v. |
n.v. |
-0.06 |
|
intersectin-1 isoform 2 |
| 160333280 |
|
Itsn1 |
|
0 |
0 |
0 |
0 |
418 |
|
n.v. |
n.v. |
n.v. |
n.v. |
-0.06 |
|
intersectin-1 isoform 3 |
| 134288904 |
|
Itsn1 |
|
0 |
61 |
129 |
0 |
418 |
|
n.v. |
0.21 |
0.16 |
n.v. |
-0.06 |
|
intersectin-1 isoform 1 |
| 312176405 |
|
Itsn2 |
|
0 |
0 |
0 |
0 |
246 |
|
n.v. |
n.v. |
n.v. |
n.v. |
-1.94 |
|
intersectin-2 isoform 3 |
| 312176401 |
|
Itsn2 |
|
0 |
61 |
129 |
0 |
246 |
|
n.v. |
0.21 |
0.16 |
n.v. |
-1.94 |
|
intersectin-2 isoform 1 |
| 46560563 |
|
Itsn2 |
|
0 |
61 |
129 |
0 |
246 |
|
n.v. |
0.21 |
0.16 |
n.v. |
-1.94 |
|
intersectin-2 isoform 2 |
| 9789985 |
|
Ivd |
|
22278 |
24871 |
0 |
98 |
2495 |
|
0.2 |
-0.11 |
n.v. |
-0.72 |
-0.28 |
|
isovaleryl-CoA dehydrogenase, mitochondrial precursor |
| 83627715 |
|
Ivl |
|
0 |
0 |
0 |
0 |
6501 |
|
n.v. |
n.v. |
n.v. |
n.v. |
0.15 |
|
involucrin |
| 87239990 |
|
Ivns1abp |
|
0 |
0 |
0 |
3479 |
0 |
|
n.v. |
n.v. |
n.v. |
0.56 |
n.v. |
|
influenza virus NS1A-binding protein homolog isoform
2 |
| 87239992 |
|
Ivns1abp |
|
0 |
0 |
0 |
909 |
0 |
|
n.v. |
n.v. |
n.v. |
0.45 |
n.v. |
|
influenza virus NS1A-binding protein homolog isoform
1 |
| 87239996 |
|
Ivns1abp |
|
0 |
0 |
0 |
3479 |
0 |
|
n.v. |
n.v. |
n.v. |
0.56 |
n.v. |
|
influenza virus NS1A-binding protein homolog isoform
3 |
| 30352010 |
|
Iws1 |
|
0 |
0 |
127 |
0 |
450 |
|
n.v. |
n.v. |
0.16 |
n.v. |
0.73 |
|
protein IWS1 homolog |
| 344179114 |
|
Jagn1 |
|
2270 |
0 |
57 |
0 |
0 |
|
-0.07 |
n.v. |
-0.86 |
n.v. |
n.v. |
|
protein jagunal homolog 1 isoform 3 |
| 13385862 |
|
Jagn1 |
|
14077 |
914 |
246 |
360 |
0 |
|
0.01 |
0.07 |
-0.79 |
-0.36 |
n.v. |
|
protein jagunal homolog 1 isoform 1 |
| 326439090 |
|
Jagn1 |
|
11789 |
914 |
189 |
360 |
0 |
|
0.05 |
0.07 |
-0.61 |
-0.36 |
n.v. |
|
protein jagunal homolog 1 isoform 2 |
| 111607496 |
|
Jak1 |
|
0 |
0 |
1124 |
0 |
0 |
|
n.v. |
n.v. |
-0.14 |
n.v. |
n.v. |
|
tyrosine-protein kinase JAK1 |
| 114326480 |
|
Jak2 |
|
0 |
0 |
0 |
0 |
33114 |
|
n.v. |
n.v. |
n.v. |
n.v. |
0 |
|
tyrosine-protein kinase JAK2 |
| 253970431 |
|
Jakmip3 |
|
0 |
0 |
12 |
0 |
0 |
|
n.v. |
n.v. |
-0.14 |
n.v. |
n.v. |
|
janus kinase and microtubule-interacting protein 3 |
| 11230774 |
|
Jarid2 |
|
0 |
505 |
206 |
0 |
0 |
|
n.v. |
0.12 |
-0.17 |
n.v. |
n.v. |
|
protein Jumonji |
| 226531205 |
|
Jmjd1c |
|
0 |
0 |
9 |
0 |
0 |
|
n.v. |
n.v. |
0.1 |
n.v. |
n.v. |
|
probable JmjC domain-containing histone demethylation
protein 2C isoform 1 |
| 334724461 |
|
Jmjd1c |
|
0 |
0 |
9 |
0 |
0 |
|
n.v. |
n.v. |
0.1 |
n.v. |
n.v. |
|
probable JmjC domain-containing histone demethylation
protein 2C isoform 2 |
| 167860141 |
|
Jmjd7 |
|
0 |
0 |
0 |
0 |
1724 |
|
n.v. |
n.v. |
n.v. |
n.v. |
0.31 |
|
jmjC domain-containing protein 7 |
| 326633188 |
|
Josd2 |
|
0 |
0 |
0 |
156 |
225 |
|
n.v. |
n.v. |
n.v. |
0.1 |
-0.01 |
|
Josephin-2 |
| 46049047 |
|
Jtb |
|
0 |
376 |
571 |
164 |
0 |
|
n.v. |
-0.24 |
-0.27 |
-0.07 |
n.v. |
|
protein JTB precursor |
| 6754404 |
|
Jund |
|
0 |
0 |
0 |
90 |
0 |
|
n.v. |
n.v. |
n.v. |
0.28 |
n.v. |
|
transcription factor jun-D |
| 28395018 |
|
Jup |
|
189870 |
94015 |
169308 |
10175 |
5548 |
|
0.06 |
-0.07 |
-0.16 |
-0.3 |
-0.67 |
|
junction plakoglobin |
| 256017137 |
|
Kalrn |
|
0 |
0 |
0 |
0 |
2677 |
|
n.v. |
n.v. |
n.v. |
n.v. |
0.09 |
|
kalirin isoform 2 |
| 295054244 |
|
Kalrn |
|
0 |
0 |
0 |
0 |
2677 |
|
n.v. |
n.v. |
n.v. |
n.v. |
0.09 |
|
kalirin isoform 1 |
| 75677563 |
|
Kank1 |
|
0 |
38 |
0 |
0 |
0 |
|
n.v. |
0.1 |
n.v. |
n.v. |
n.v. |
|
KN motif and ankyrin repeat domain-containing protein 1 |
| 16716381 |
|
Kars |
|
860 |
11273 |
9834 |
492599 |
5269 |
|
0.29 |
0.14 |
-0.02 |
0.06 |
0.02 |
|
lysine--tRNA ligase isoform 2 |
| 195963321 |
|
Kars |
|
860 |
11273 |
9834 |
491952 |
5269 |
|
0.29 |
0.14 |
-0.02 |
0.06 |
0.02 |
|
lysine--tRNA ligase isoform 1 |
| 124487239 |
|
Kat6a |
|
0 |
0 |
44 |
0 |
0 |
|
n.v. |
n.v. |
0.36 |
n.v. |
n.v. |
|
histone acetyltransferase KAT6A |
| 21313044 |
|
Katnal2 |
|
0 |
0 |
7081 |
14726 |
12220 |
|
n.v. |
n.v. |
-0.05 |
-0.12 |
-0.07 |
|
katanin p60 ATPase-containing subunit A-like 2 |
| 84095201 |
|
Katnb1 |
|
0 |
35 |
1 |
0 |
0 |
|
n.v. |
-0.4 |
0.01 |
n.v. |
n.v. |
|
katanin p80 WD40 repeat-containing subunit B1 |
| 172072622 |
|
Kbtbd2 |
|
0 |
0 |
0 |
131 |
0 |
|
n.v. |
n.v. |
n.v. |
0.38 |
n.v. |
|
kelch repeat and BTB (POZ) domain containing 2 |
| 257153339 |
|
Kbtbd3 |
|
119758 |
42 |
2698 |
28216 |
0 |
|
-0.07 |
-0.25 |
-0.08 |
-0.18 |
n.v. |
|
kelch repeat and BTB domain-containing protein 3 |
| 126517505 |
|
Kcmf1 |
|
0 |
0 |
0 |
5795 |
0 |
|
n.v. |
n.v. |
n.v. |
0.14 |
n.v. |
|
E3 ubiquitin-protein ligase KCMF1 |
| 358030294 |
|
Kcnab2 |
|
0 |
0 |
42 |
1113 |
0 |
|
n.v. |
n.v. |
0.04 |
0 |
n.v. |
|
voltage-gated potassium channel subunit beta-2 isoform
2 |
| 358030297 |
|
Kcnab2 |
|
0 |
0 |
42 |
1113 |
0 |
|
n.v. |
n.v. |
0.04 |
0 |
n.v. |
|
voltage-gated potassium channel subunit beta-2 isoform
1 |
| 28076887 |
|
Kcng4 |
|
29894 |
4296 |
18251 |
4355 |
82046 |
|
0.14 |
0.12 |
0.06 |
0.2 |
0.14 |
|
potassium voltage-gated channel subfamily G member 4 |
| 40445393 |
|
Kcnk12 |
|
0 |
0 |
344 |
0 |
0 |
|
n.v. |
n.v. |
0.13 |
n.v. |
n.v. |
|
potassium channel subfamily K member 12 |
| 27370096 |
|
Kctd13 |
|
0 |
0 |
111 |
3233 |
0 |
|
n.v. |
n.v. |
-0.07 |
-0.19 |
n.v. |
|
BTB/POZ domain-containing adapter for CUL3-mediated RhoA
degradation protein 1 |
| 27369698 |
|
Kctd7 |
|
0 |
0 |
309 |
0 |
0 |
|
n.v. |
n.v. |
0.14 |
n.v. |
n.v. |
|
BTB/POZ domain-containing protein KCTD7 |
| 12963767 |
|
Kdelc1 |
|
0 |
0 |
247 |
0 |
321 |
|
n.v. |
n.v. |
-0.17 |
n.v. |
0.95 |
|
KDEL motif-containing protein 1 precursor |
| 47078285 |
|
Kdelc2 |
|
1886 |
1079 |
0 |
0 |
0 |
|
-0.5 |
-0.52 |
n.v. |
n.v. |
n.v. |
|
KDEL (Lys-Asp-Glu-Leu) containing 2 protein precursor |
| 19527170 |
|
Kdelr1 |
|
21693 |
1484 |
3412 |
1105 |
0 |
|
-0.08 |
-0.24 |
-0.37 |
-0.38 |
n.v. |
|
ER lumen protein retaining receptor 1 |
| 13385318 |
|
Kdelr2 |
|
21693 |
1484 |
3412 |
1105 |
0 |
|
-0.08 |
-0.24 |
-0.37 |
-0.38 |
n.v. |
|
ER lumen protein retaining receptor 2 |
| 224994233 |
|
Kdm1a |
|
0 |
96 |
1077 |
22838 |
1146 |
|
n.v. |
0.09 |
-0.21 |
-0.15 |
-0.57 |
|
lysine-specific histone demethylase 1A |
| 26986559 |
|
Kdm1b |
|
0 |
0 |
6 |
0 |
0 |
|
n.v. |
n.v. |
3.96 |
n.v. |
n.v. |
|
lysine-specific histone demethylase 1B |
| 124486935 |
|
Kdm3b |
|
0 |
50 |
1 |
0 |
1167 |
|
n.v. |
-0.87 |
0.48 |
n.v. |
-0.05 |
|
lysine-specific demethylase 3B |
| 165905607 |
|
Kdm5c |
|
0 |
0 |
0 |
0 |
2763 |
|
n.v. |
n.v. |
n.v. |
n.v. |
0.32 |
|
lysine-specific demethylase 5C |
| 27777648 |
|
Kdr |
|
0 |
202 |
6785 |
36254 |
73039 |
|
n.v. |
0.05 |
-0.02 |
0.01 |
-0.01 |
|
vascular endothelial growth factor receptor 2
precursor |
| 110625780 |
|
Kdsr |
|
0 |
2269 |
477 |
0 |
0 |
|
n.v. |
-0.13 |
-0.31 |
n.v. |
n.v. |
|
3-ketodihydrosphingosine reductase precursor |
| 160333659;7710044 |
|
Keap1 |
|
0 |
0 |
2789 |
0 |
0 |
|
n.v. |
n.v. |
0.05 |
n.v. |
n.v. |
|
kelch-like ECH-associated protein 1 |
| 7710044 |
|
Keap1 |
|
0 |
651 |
0 |
3561 |
0 |
|
n.v. |
0.08 |
n.v. |
-0.2 |
n.v. |
|
kelch-like ECH-associated protein 1 |
| 110626031 |
|
Khdrbs1 |
|
57280 |
1428 |
5013 |
3659 |
0 |
|
0.06 |
0.05 |
-0.04 |
0.01 |
n.v. |
|
KH domain-containing, RNA-binding, signal
transduction-associated protein 1 |
| 18875400 |
|
Khdrbs2 |
|
23651 |
0 |
2155 |
1711 |
0 |
|
0.16 |
n.v. |
-0.08 |
0.01 |
n.v. |
|
KH domain-containing, RNA-binding, signal
transduction-associated protein 2 |
| 117647236 |
|
Khdrbs3 |
|
23651 |
0 |
2155 |
1711 |
0 |
|
0.16 |
n.v. |
-0.08 |
0.01 |
n.v. |
|
KH domain-containing, RNA-binding, signal
transduction-associated protein 3 |
| 31982229 |
|
Khk |
|
0 |
0 |
0 |
0 |
493 |
|
n.v. |
n.v. |
n.v. |
n.v. |
-0.13 |
|
ketohexokinase |
| 163954948 |
|
Khsrp |
|
143611 |
3609 |
64408 |
31367 |
55368 |
|
0.04 |
0.03 |
-0.06 |
-0.08 |
-0.07 |
|
far upstream element-binding protein 2 |
| 124487039 |
|
Kidins220 |
|
1501 |
0 |
9 |
0 |
0 |
|
0.01 |
n.v. |
-0.36 |
n.v. |
n.v. |
|
kinase D-interacting substrate of 220 kDa |
| 45476577 |
|
Kif11 |
|
0 |
0 |
278 |
57 |
3234 |
|
n.v. |
n.v. |
0.16 |
0.77 |
0.51 |
|
kinesin-like protein KIF11 |
| 120300944 |
|
Kif13a |
|
0 |
8 |
934 |
1351 |
5141 |
|
n.v. |
0.87 |
0.01 |
0.12 |
0.18 |
|
kinesin-like protein KIF13A |
| 124487163 |
|
Kif13b |
|
2929 |
4304 |
11609 |
67023 |
134822 |
|
0.15 |
0.12 |
0.05 |
0.05 |
0.02 |
|
kinesin-like protein KIF13B |
| 124486927 |
|
Kif14 |
|
0 |
0 |
154 |
0 |
2174 |
|
n.v. |
n.v. |
0.02 |
n.v. |
-0.18 |
|
kinesin-like protein KIF14 |
| 39930325 |
|
Kif15 |
|
0 |
0 |
0 |
0 |
396 |
|
n.v. |
n.v. |
n.v. |
n.v. |
0.53 |
|
kinesin-like protein KIF15 |
| 124487287 |
|
Kif16b |
|
0 |
0 |
66 |
1089 |
0 |
|
n.v. |
n.v. |
0.11 |
-0.01 |
n.v. |
|
kinesin-like protein KIF16B |
| 13487898 |
|
Kif17 |
|
0 |
0 |
154 |
0 |
2174 |
|
n.v. |
n.v. |
0.02 |
n.v. |
-0.18 |
|
kinesin-like protein KIF17 isoform 1 |
| 300795177 |
|
Kif17 |
|
0 |
0 |
154 |
0 |
2174 |
|
n.v. |
n.v. |
0.02 |
n.v. |
-0.18 |
|
kinesin-like protein KIF17 isoform 2 |
| 160333877 |
|
Kif1a |
|
0 |
764 |
2139 |
2177 |
9746 |
|
n.v. |
0.22 |
0.16 |
0.25 |
0.08 |
|
kinesin-like protein KIF1A isoform b |
| 160708010 |
|
Kif1a |
|
0 |
764 |
2139 |
2177 |
9746 |
|
n.v. |
0.22 |
0.16 |
0.25 |
0.08 |
|
kinesin-like protein KIF1A isoform a |
| 86990458 |
|
Kif1b |
|
0 |
764 |
2139 |
2177 |
9746 |
|
n.v. |
0.22 |
0.16 |
0.25 |
0.08 |
|
kinesin-like protein KIF1B isoform a |
| 86990460 |
|
Kif1b |
|
0 |
764 |
2524 |
2177 |
9746 |
|
n.v. |
0.22 |
0.13 |
0.25 |
0.08 |
|
kinesin-like protein KIF1B isoform b |
| 145966744 |
|
Kif1c |
|
0 |
797 |
2979 |
3266 |
9746 |
|
n.v. |
-0.75 |
0.12 |
0.05 |
0.08 |
|
kinesin-like protein KIF1C |
| 157823695 |
|
Kif21a |
|
0 |
0 |
0 |
33 |
311 |
|
n.v. |
n.v. |
n.v. |
0.08 |
-0.08 |
|
kinesin-like protein KIF21A isoform 3 |
| 157823731 |
|
Kif21a |
|
0 |
0 |
0 |
33 |
311 |
|
n.v. |
n.v. |
n.v. |
0.08 |
-0.08 |
|
kinesin-like protein KIF21A isoform 1 |
| 157823761 |
|
Kif21a |
|
0 |
0 |
0 |
33 |
311 |
|
n.v. |
n.v. |
n.v. |
0.08 |
-0.08 |
|
kinesin-like protein KIF21A isoform 2 |
| 157823795 |
|
Kif21a |
|
0 |
0 |
0 |
33 |
311 |
|
n.v. |
n.v. |
n.v. |
0.08 |
-0.08 |
|
kinesin-like protein KIF21A isoform 4 |
| 21704182 |
|
Kif22 |
|
0 |
1528 |
15 |
426 |
0 |
|
n.v. |
-3.25 |
-3.38 |
-3.42 |
n.v. |
|
kinesin-like protein KIF22 |
| 32401469 |
|
Kif27 |
|
0 |
0 |
356 |
0 |
0 |
|
n.v. |
n.v. |
0.16 |
n.v. |
n.v. |
|
kinesin-like protein KIF27 |
| 224809371 |
|
Kif2a |
|
0 |
0 |
3939 |
1523 |
0 |
|
n.v. |
n.v. |
-0.13 |
-0.72 |
n.v. |
|
kinesin-like protein KIF2A isoform 1 |
| 224809373 |
|
Kif2a |
|
0 |
0 |
3939 |
1523 |
0 |
|
n.v. |
n.v. |
-0.13 |
-0.72 |
n.v. |
|
kinesin-like protein KIF2A isoform 2 |
| 110625946 |
|
Kif2b |
|
0 |
0 |
0 |
1040 |
0 |
|
n.v. |
n.v. |
n.v. |
0.44 |
n.v. |
|
kinesin-like protein KIF2B |
| 34328138 |
|
Kif3a |
|
0 |
0 |
212 |
0 |
2677 |
|
n.v. |
n.v. |
0.36 |
n.v. |
0.14 |
|
kinesin-like protein KIF3A |
| 227908861 |
|
Kif3b |
|
0 |
0 |
154 |
0 |
2784 |
|
n.v. |
n.v. |
0.02 |
n.v. |
-0.15 |
|
kinesin-like protein KIF3B |
| 84781817 |
|
Kif3c |
|
0 |
0 |
158 |
33 |
2174 |
|
n.v. |
n.v. |
0.11 |
0.3 |
-0.18 |
|
kinesin-like protein KIF3C |
| 84781727;40254635 |
|
Kif5a |
|
0 |
0 |
5373 |
0 |
0 |
|
n.v. |
n.v. |
0.02 |
n.v. |
n.v. |
|
kinesin heavy chain isoform 5A |
| 40254635;84781727 |
|
Kif5a |
|
13949 |
0 |
0 |
42360 |
59191 |
|
-0.06 |
n.v. |
n.v. |
0.35 |
0.09 |
|
kinesin heavy chain isoform 5A |
| 61657921 |
|
Kif5b |
|
18196 |
44 |
12889 |
108876 |
206319 |
|
-0.12 |
0.29 |
0.08 |
0.34 |
0.2 |
|
kinesin-1 heavy chain |
| 45433560 |
|
Kif5c |
|
13949 |
0 |
5373 |
44325 |
59191 |
|
-0.06 |
n.v. |
0.02 |
0.34 |
0.09 |
|
kinesin heavy chain isoform 5C |
| 254675236 |
|
Kif9 |
|
0 |
0 |
154 |
0 |
2174 |
|
n.v. |
n.v. |
0.02 |
n.v. |
-0.18 |
|
kinesin-like protein KIF9 isoform 2 |
| 254675238 |
|
Kif9 |
|
0 |
0 |
154 |
0 |
2174 |
|
n.v. |
n.v. |
0.02 |
n.v. |
-0.18 |
|
kinesin-like protein KIF9 isoform 1 |
| 224967071 |
|
Kifc3 |
|
0 |
177 |
239 |
0 |
2174 |
|
n.v. |
-0.13 |
0.21 |
n.v. |
-0.18 |
|
kinesin-like protein KIFC3 isoform a |
| 224967073 |
|
Kifc3 |
|
0 |
177 |
239 |
0 |
2174 |
|
n.v. |
-0.13 |
0.21 |
n.v. |
-0.18 |
|
kinesin-like protein KIFC3 isoform b |
| 224967075 |
|
Kifc3 |
|
0 |
177 |
168 |
0 |
2174 |
|
n.v. |
-0.13 |
0.22 |
n.v. |
-0.18 |
|
kinesin-like protein KIFC3 isoform c |
| 33859684 |
|
Kin |
|
0 |
0 |
335 |
0 |
0 |
|
n.v. |
n.v. |
0.1 |
n.v. |
n.v. |
|
DNA/RNA-binding protein KIN17 |
| 70608146 |
|
Kirrel |
|
0 |
0 |
126 |
0 |
0 |
|
n.v. |
n.v. |
-0.25 |
n.v. |
n.v. |
|
kin of IRRE-like protein 1 precursor |
| 170650719 |
|
Kit |
|
0 |
202 |
6785 |
36254 |
73039 |
|
n.v. |
0.05 |
-0.02 |
0.01 |
-0.01 |
|
mast/stem cell growth factor receptor Kit isoform 2 |
| 170650721 |
|
Kit |
|
0 |
202 |
6785 |
36254 |
73039 |
|
n.v. |
0.05 |
-0.02 |
0.01 |
-0.01 |
|
mast/stem cell growth factor receptor Kit isoform 1 |
| 227330584 |
|
Kl |
|
29894 |
4296 |
18251 |
4355 |
82046 |
|
0.14 |
0.12 |
0.06 |
0.2 |
0.14 |
|
klotho precursor |
| 131412178 |
|
Klc1 |
|
0 |
0 |
56 |
892 |
3780 |
|
n.v. |
n.v. |
-1.48 |
-0.21 |
0.08 |
|
kinesin light chain 1 isoform 1D |
| 131412198 |
|
Klc1 |
|
0 |
0 |
56 |
892 |
3780 |
|
n.v. |
n.v. |
-1.48 |
-0.21 |
0.08 |
|
kinesin light chain 1 isoform 1A |
| 131412207 |
|
Klc1 |
|
0 |
0 |
56 |
892 |
3780 |
|
n.v. |
n.v. |
-1.48 |
-0.21 |
0.08 |
|
kinesin light chain 1 isoform 1H |
| 133778983 |
|
Klc2 |
|
0 |
486 |
468 |
2521 |
13944 |
|
n.v. |
-0.16 |
-0.22 |
0.25 |
0.3 |
|
kinesin light chain 2 |
| 22122725 |
|
Klc3 |
|
0 |
0 |
56 |
237 |
4830 |
|
n.v. |
n.v. |
-1.48 |
1.07 |
0.04 |
|
kinesin light chain 3 |
| 13386370 |
|
Klc4 |
|
0 |
140 |
56 |
1899 |
14222 |
|
n.v. |
0.15 |
-1.48 |
0.08 |
0.11 |
|
kinesin light chain 4 |
| 58037463 |
|
Klhdc10 |
|
0 |
0 |
0 |
123 |
1210 |
|
n.v. |
n.v. |
n.v. |
0.2 |
0.46 |
|
kelch domain-containing protein 10 |
| 226246638 |
|
Klhdc2 |
|
0 |
0 |
0 |
0 |
364 |
|
n.v. |
n.v. |
n.v. |
n.v. |
-0.16 |
|
kelch domain-containing protein 2 |
| 255683384 |
|
Klhdc4 |
|
0 |
340 |
127 |
205 |
0 |
|
n.v. |
0.36 |
0.1 |
0.55 |
n.v. |
|
kelch domain-containing protein 4 |
| 237513007 |
|
Klhdc7b |
|
0 |
215 |
0 |
3070 |
0 |
|
n.v. |
0.36 |
n.v. |
0.04 |
n.v. |
|
kelch domain containing 7B |
| 84794655 |
|
Klhl15 |
|
0 |
0 |
31 |
0 |
0 |
|
n.v. |
n.v. |
0.63 |
n.v. |
n.v. |
|
kelch-like 15 isoform a |
| 159032012 |
|
Klhl22 |
|
0 |
17 |
79 |
0 |
1157 |
|
n.v. |
0.22 |
-0.23 |
n.v. |
0.19 |
|
kelch-like protein 22 |
| 109288014 |
|
Kntc1 |
|
0 |
29 |
32 |
2521 |
568 |
|
n.v. |
-0.18 |
-0.06 |
0.1 |
-0.24 |
|
kinetochore-associated protein 1 |
| 31543047 |
|
Kpna1 |
|
0 |
79 |
145 |
0 |
0 |
|
n.v. |
1.36 |
0.42 |
n.v. |
n.v. |
|
importin subunit alpha-1 |
| 6754474 |
|
Kpna2 |
|
10142 |
1937 |
3698 |
16821 |
26078 |
|
0.06 |
0.25 |
0.15 |
0.18 |
0.18 |
|
importin subunit alpha-1 |
| 6680596 |
|
Kpna3 |
|
18 |
1035 |
780 |
12827 |
5066 |
|
2.62 |
0.15 |
-0.03 |
0.11 |
-0.07 |
|
importin subunit alpha-3 |
| 6680598 |
|
Kpna4 |
|
183 |
695 |
35 |
19113 |
5248 |
|
-1.47 |
-0.31 |
0.27 |
0.04 |
-0.2 |
|
importin subunit alpha-3 |
| 227116300 |
|
Kpna6 |
|
0 |
79 |
72 |
0 |
525 |
|
n.v. |
1.36 |
0.02 |
n.v. |
-0.01 |
|
importin subunit alpha-7 |
| 88014720 |
|
Kpnb1 |
|
201037 |
5582 |
30759 |
202200 |
136332 |
|
0.03 |
0.14 |
0.03 |
0.05 |
-0.01 |
|
importin subunit beta-1 |
| 228480267 |
|
Kptn |
|
0 |
0 |
0 |
0 |
5130 |
|
n.v. |
n.v. |
n.v. |
n.v. |
-0.25 |
|
kaptin |
| 266458391 |
|
Kras |
|
9483 |
17070 |
27225 |
12819 |
3427 |
|
0.07 |
-0.06 |
-0.12 |
-0.26 |
-0.24 |
|
GTPase KRas |
| 282847448 |
|
Krit1 |
|
0 |
0 |
23 |
344 |
0 |
|
n.v. |
n.v. |
0.63 |
0.25 |
n.v. |
|
krev interaction trapped protein 1 isoform 2 |
| 282847450 |
|
Krit1 |
|
0 |
0 |
23 |
344 |
0 |
|
n.v. |
n.v. |
0.63 |
0.25 |
n.v. |
|
krev interaction trapped protein 1 isoform 1 |
| 226442952 |
|
Krr1 |
|
2471 |
0 |
1011 |
0 |
0 |
|
0.07 |
n.v. |
-0.33 |
n.v. |
n.v. |
|
KRR1 small subunit processome component homolog |
| 20270210 |
|
Kti12 |
|
0 |
0 |
0 |
0 |
0 |
|
n.v. |
n.v. |
n.v. |
n.v. |
0.33 |
|
protein KTI12 homolog |
| 144922638 |
|
Ktn1 |
|
40731 |
1772 |
4380 |
0 |
0 |
|
0.02 |
-0.21 |
-0.15 |
n.v. |
n.v. |
|
kinectin |
| 112293279 |
|
L1cam |
|
0 |
0 |
85 |
0 |
2677 |
|
n.v. |
n.v. |
-0.28 |
n.v. |
0.09 |
|
neural cell adhesion molecule L1 precursor |
| 21703884 |
|
L2hgdh |
|
0 |
3591 |
0 |
0 |
0 |
|
n.v. |
-0.08 |
n.v. |
n.v. |
n.v. |
|
L-2-hydroxyglutarate dehydrogenase, mitochondrial
precursor |
| 13399318 |
|
l7Rn6 |
|
0 |
73 |
483 |
0 |
653 |
|
n.v. |
0.18 |
-0.01 |
n.v. |
0.45 |
|
protein Hikeshi |
| 144922663 |
|
Lace1 |
|
0 |
113 |
0 |
0 |
0 |
|
n.v. |
-0.23 |
n.v. |
n.v. |
n.v. |
|
lactation elevated protein 1 |
| 13507666 |
|
Lactb |
|
439 |
2987 |
0 |
0 |
0 |
|
-0.2 |
-0.06 |
n.v. |
n.v. |
n.v. |
|
serine beta-lactamase-like protein LACTB, mitochondrial
precursor |
| 21703764 |
|
Lactb2 |
|
0 |
0 |
0 |
0 |
3930 |
|
n.v. |
n.v. |
n.v. |
n.v. |
-0.03 |
|
beta-lactamase-like protein 2 |
| 31981555 |
|
Lad1 |
|
63943 |
1184 |
2681 |
8521 |
18206 |
|
-0.16 |
0.51 |
0.53 |
0.48 |
0.14 |
|
ladinin-1 |
| 13384798 |
|
Lage3 |
|
0 |
0 |
7 |
0 |
932 |
|
n.v. |
n.v. |
-0.02 |
n.v. |
0.31 |
|
L antigen family member 3 |
| 124487155 |
|
Lama5 |
|
55 |
125 |
102 |
213 |
86 |
|
0.17 |
-0.3 |
-0.17 |
-0.16 |
0.02 |
|
laminin subunit alpha-5 precursor |
| 114326497 |
|
Lamb1 |
|
3222 |
9033 |
2840 |
0 |
0 |
|
-0.09 |
-0.23 |
-0.4 |
n.v. |
n.v. |
|
laminin subunit beta-1 |
| 31982223 |
|
Lamb2 |
|
0 |
0 |
773 |
0 |
0 |
|
n.v. |
n.v. |
-0.29 |
n.v. |
n.v. |
|
laminin subunit beta-2 precursor |
| 153791270 |
|
Lamc1 |
|
0 |
77 |
26 |
0 |
0 |
|
n.v. |
-0.36 |
-0.23 |
n.v. |
n.v. |
|
laminin subunit gamma-1 precursor |
| 110624798 |
|
Lamc2 |
|
0 |
261 |
40 |
0 |
0 |
|
n.v. |
-0.16 |
-0.16 |
n.v. |
n.v. |
|
laminin subunit gamma-2 precursor |
| 113195678 |
|
Lamp1 |
|
11258 |
44727 |
136147 |
32587 |
20519 |
|
0.15 |
-0.12 |
-0.21 |
-0.96 |
-0.09 |
|
lysosome-associated membrane glycoprotein 1
precursor |
| 31543108 |
|
Lamp2 |
|
31047 |
33509 |
45572 |
4576 |
4819 |
|
-0.02 |
-0.08 |
-0.23 |
-0.27 |
-0.01 |
|
lysosome-associated membrane glycoprotein 2 isoform 2 |
| 63054837 |
|
Lamp2 |
|
31047 |
33509 |
45572 |
4576 |
4819 |
|
-0.02 |
-0.08 |
-0.23 |
-0.27 |
-0.01 |
|
lysosome-associated membrane glycoprotein 2 isoform 1
precursor |
| 242332593 |
|
Lamtor1 |
|
14810 |
7191 |
5269 |
1883 |
0 |
|
-0.04 |
-0.08 |
-0.18 |
-0.39 |
n.v. |
|
ragulator complex protein LAMTOR1 |
| 13752573 |
|
Lamtor2 |
|
220 |
3920 |
6074 |
671 |
3191 |
|
0.16 |
-0.07 |
-0.16 |
-1.53 |
0.06 |
|
ragulator complex protein LAMTOR2 |
| 9910452 |
|
Lamtor3 |
|
146 |
526 |
111 |
0 |
1135 |
|
0.1 |
0.29 |
-0.01 |
n.v. |
0.07 |
|
ragulator complex protein LAMTOR3 |
| 237820655 |
|
Lamtor5 |
|
0 |
33 |
836 |
0 |
0 |
|
n.v. |
-0.06 |
-0.2 |
n.v. |
n.v. |
|
hepatitis B virus X-interacting protein homolog |
| 300795817 |
|
Lancl1 |
|
0 |
48 |
1333 |
2906 |
17157 |
|
n.v. |
0.09 |
-0.05 |
-0.28 |
0 |
|
lanC-like protein 1 |
| 19526936 |
|
Lancl2 |
|
0 |
353 |
967 |
0 |
18463 |
|
n.v. |
0.28 |
0.15 |
n.v. |
0 |
|
lanC-like protein 2 |
| 255069715 |
|
Lap3 |
|
13601 |
20284 |
792 |
32390 |
22672 |
|
0.21 |
-0.07 |
-0.12 |
0.04 |
-0.17 |
|
cytosol aminopeptidase |
| 109689716 |
|
Laptm4a |
|
0 |
1445 |
0 |
0 |
0 |
|
n.v. |
-0.38 |
n.v. |
n.v. |
n.v. |
|
lysosomal-associated transmembrane protein 4A |
| 226442901 |
|
Larp1 |
|
0 |
188 |
5316 |
10224 |
0 |
|
n.v. |
0.47 |
0.34 |
0.13 |
n.v. |
|
la-related protein 1 |
| 124358932 |
|
Larp4 |
|
0 |
0 |
8303 |
3184 |
0 |
|
n.v. |
n.v. |
0.17 |
0.6 |
n.v. |
|
la-related protein 4 isoform 2 |
| 124358934 |
|
Larp4 |
|
0 |
0 |
8303 |
3184 |
0 |
|
n.v. |
n.v. |
0.17 |
0.6 |
n.v. |
|
la-related protein 4 isoform 1 |
| 27369836 |
|
Larp4b |
|
989 |
528 |
13823 |
12639 |
0 |
|
0.36 |
-0.47 |
-0.02 |
0.08 |
n.v. |
|
la-related protein 4B |
| 110665742 |
|
Larp7 |
|
1940 |
633 |
4681 |
54205 |
30618 |
|
-0.07 |
0.16 |
-0.11 |
0.01 |
0.09 |
|
la-related protein 7 |
| 120537241 |
|
Lars |
|
0 |
7404 |
9307 |
296219 |
13419 |
|
n.v. |
0.05 |
-0.05 |
0.1 |
-0.12 |
|
leucine--tRNA ligase, cytoplasmic |
| 23346617 |
|
Lars2 |
|
0 |
148 |
0 |
0 |
0 |
|
n.v. |
-0.41 |
n.v. |
n.v. |
n.v. |
|
probable leucine--tRNA ligase, mitochondrial |
| 407262453 |
|
Las1l |
|
0 |
0 |
279 |
0 |
0 |
|
n.v. |
n.v. |
-0.17 |
n.v. |
n.v. |
|
PREDICTED: ribosomal biogenesis protein LAS1L |
| 71979675 |
|
Las1l |
|
0 |
0 |
279 |
0 |
0 |
|
n.v. |
n.v. |
-0.17 |
n.v. |
n.v. |
|
ribosomal biogenesis protein LAS1L |
| 6754508 |
|
Lasp1 |
|
9464 |
4012 |
9315 |
1850 |
218174 |
|
0.63 |
0.2 |
0.04 |
0.56 |
0.04 |
|
LIM and SH3 domain protein 1 |
| 229608895 |
|
Lbr |
|
49060 |
516 |
110 |
0 |
0 |
|
-0.11 |
0.11 |
-0.48 |
n.v. |
n.v. |
|
lamin-B receptor |
| 244791455 |
|
Lck |
|
0 |
2733 |
8629 |
9250 |
44016 |
|
n.v. |
0.52 |
-0.1 |
0.06 |
0.06 |
|
proto-oncogene tyrosine-protein kinase LCK isoform a |
| 33859570 |
|
Lck |
|
0 |
2733 |
8629 |
9250 |
44016 |
|
n.v. |
0.52 |
-0.1 |
0.06 |
0.06 |
|
proto-oncogene tyrosine-protein kinase LCK isoform b |
| 295789100;295789098 |
|
Lclat1 |
|
0 |
294 |
0 |
0 |
0 |
|
n.v. |
0.49 |
n.v. |
n.v. |
n.v. |
|
lysocardiolipin acyltransferase 1 |
| 42794773 |
|
Lcmt1 |
|
0 |
0 |
1835 |
794 |
87186 |
|
n.v. |
n.v. |
-0.63 |
-0.13 |
-0.08 |
|
leucine carboxyl methyltransferase 1 |
| 34328049 |
|
Lcn2 |
|
0 |
923 |
382 |
0 |
0 |
|
n.v. |
-0.35 |
-0.71 |
n.v. |
n.v. |
|
neutrophil gelatinase-associated lipocalin precursor |
| 31543113;350606354 |
|
Lcp1 |
|
0 |
18963 |
20061 |
13858 |
7315 |
|
n.v. |
0.06 |
-0.09 |
0.04 |
0.05 |
|
plastin-2 |
| 257743039 |
|
Ldha |
|
784742 |
144928 |
249610 |
373000 |
1539952 |
|
0.16 |
0.11 |
0.02 |
0.19 |
0.04 |
|
L-lactate dehydrogenase A chain isoform 2 |
| 6754524 |
|
Ldha |
|
784742 |
144928 |
249610 |
374195 |
1535036 |
|
0.16 |
0.11 |
0.02 |
0.19 |
0.04 |
|
L-lactate dehydrogenase A chain isoform 1 |
| 30425048 |
|
Ldhal6b |
|
0 |
13343 |
33526 |
6794 |
53055 |
|
n.v. |
0.12 |
0.02 |
0.23 |
0.08 |
|
L-lactate dehydrogenase A-like 6B |
| 6678674 |
|
Ldhb |
|
330918 |
15646 |
91923 |
101787 |
231293 |
|
0.1 |
0.11 |
0.03 |
0.21 |
0.07 |
|
L-lactate dehydrogenase B chain |
| 7305229 |
|
Ldhc |
|
406229 |
3835 |
97590 |
133940 |
290099 |
|
0.13 |
0.03 |
0.02 |
0.17 |
0.04 |
|
L-lactate dehydrogenase C chain |
| 34328379 |
|
Ldhd |
|
0 |
7171 |
0 |
0 |
0 |
|
n.v. |
-0.03 |
n.v. |
n.v. |
n.v. |
|
probable D-lactate dehydrogenase, mitochondrial |
| 113195700 |
|
Ldlr |
|
0 |
0 |
66 |
0 |
0 |
|
n.v. |
n.v. |
0.4 |
n.v. |
n.v. |
|
low-density lipoprotein receptor isoform 1 precursor |
| 358030301 |
|
Ldlr |
|
0 |
0 |
66 |
0 |
0 |
|
n.v. |
n.v. |
0.4 |
n.v. |
n.v. |
|
low-density lipoprotein receptor isoform 2 |
| 358030304 |
|
Ldlr |
|
0 |
0 |
66 |
0 |
0 |
|
n.v. |
n.v. |
0.4 |
n.v. |
n.v. |
|
low-density lipoprotein receptor isoform 3 presursor
precursor |
| 160333775 |
|
Ldlrap1 |
|
0 |
159 |
20 |
229 |
0 |
|
n.v. |
-0.1 |
0.74 |
-0.3 |
n.v. |
|
low density lipoprotein receptor adapter protein 1 |
| 170932462 |
|
Lect1 |
|
0 |
0 |
0 |
1465 |
1050 |
|
n.v. |
n.v. |
n.v. |
0.35 |
-0.05 |
|
leukocyte cell-derived chemotaxin 1 |
| 145864461 |
|
Lemd3 |
|
531 |
0 |
0 |
0 |
0 |
|
0.55 |
n.v. |
n.v. |
n.v. |
n.v. |
|
inner nuclear membrane protein Man1 |
| 87299619 |
|
Leo1 |
|
0 |
0 |
0 |
1776 |
1242 |
|
n.v. |
n.v. |
n.v. |
0.06 |
-1.57 |
|
RNA polymerase-associated protein LEO1 |
| 28077089 |
|
Leprot |
|
0 |
171 |
454 |
16 |
0 |
|
n.v. |
-0.13 |
-0.2 |
-0.79 |
n.v. |
|
leptin receptor gene-related protein |
| 13386094 |
|
Leprotl1 |
|
0 |
0 |
360 |
0 |
0 |
|
n.v. |
n.v. |
-0.02 |
n.v. |
n.v. |
|
leptin receptor overlapping transcript-like 1 |
| 9789997 |
|
Letm1 |
|
1849 |
14972 |
304 |
0 |
0 |
|
0.27 |
0 |
-0.38 |
n.v. |
n.v. |
|
LETM1 and EF-hand domain-containing protein 1,
mitochondrial precursor |
| 6678682 |
|
Lgals1 |
|
17427 |
7895 |
73489 |
1997 |
245205 |
|
0.06 |
0.25 |
0.06 |
0.18 |
0.03 |
|
galectin-1 |
| 9506757 |
|
Lgals12 |
|
0 |
17 |
0 |
0 |
0 |
|
n.v. |
-1.47 |
n.v. |
n.v. |
n.v. |
|
galectin-12 |
| 33859580;225543163 |
|
Lgals3 |
|
10563 |
0 |
55057 |
0 |
0 |
|
-0.09 |
n.v. |
0.03 |
n.v. |
n.v. |
|
galectin-3 |
| 225543163 |
|
Lgals3 |
|
0 |
30536 |
0 |
24966 |
32696 |
|
n.v. |
0.14 |
n.v. |
-0.09 |
0.05 |
|
galectin-3 |
| 9256551 |
|
Lgals8 |
|
0 |
1703 |
0 |
0 |
0 |
|
n.v. |
-0.12 |
n.v. |
n.v. |
n.v. |
|
galectin-8 |
| 312261230;9256551 |
|
Lgals8 |
|
0 |
0 |
3115 |
0 |
0 |
|
n.v. |
n.v. |
-0.27 |
n.v. |
n.v. |
|
galectin-8 |
| 226531119 |
|
Lgals9 |
|
0 |
6427 |
8735 |
1653 |
4305 |
|
n.v. |
0.22 |
0 |
-0.59 |
-0.31 |
|
galectin-9 isoform 1 |
| 226531139 |
|
Lgals9 |
|
0 |
6427 |
8735 |
1653 |
4305 |
|
n.v. |
0.22 |
0 |
-0.59 |
-0.31 |
|
galectin-9 isoform 2 |
| 29611654 |
|
Lgalsl |
|
0 |
0 |
0 |
0 |
2217 |
|
n.v. |
n.v. |
n.v. |
n.v. |
0.12 |
|
galectin-related protein A |
| 7242187 |
|
Lgmn |
|
66597 |
7611 |
2829 |
1924 |
5933 |
|
0.14 |
-0.04 |
-0.2 |
-0.43 |
-0.05 |
|
legumain precursor |
| 13277380 |
|
Lias |
|
0 |
13 |
0 |
0 |
0 |
|
n.v. |
-0.47 |
n.v. |
n.v. |
n.v. |
|
lipoyl synthase, mitochondrial precursor |
| 313151236;133892266 |
|
Lig1 |
|
0 |
0 |
4153 |
0 |
0 |
|
n.v. |
n.v. |
0.03 |
n.v. |
n.v. |
|
DNA ligase 1 |
| 133892266 |
|
Lig1 |
|
0 |
3269 |
0 |
35525 |
63165 |
|
n.v. |
-0.02 |
n.v. |
0.1 |
0.11 |
|
DNA ligase 1 |
| 158518433 |
|
Lima1 |
|
18947 |
1263 |
3431 |
0 |
4423 |
|
0.1 |
0.32 |
0.36 |
n.v. |
-0.04 |
|
LIM domain and actin-binding protein 1 isoform b |
| 165905585 |
|
Lima1 |
|
19770 |
1597 |
3705 |
426 |
4423 |
|
0.11 |
0.47 |
0.34 |
-0.29 |
-0.04 |
|
LIM domain and actin-binding protein 1 isoform a |
| 224994267 |
|
Limd1 |
|
0 |
0 |
0 |
0 |
311 |
|
n.v. |
n.v. |
n.v. |
n.v. |
0.5 |
|
LIM domain-containing protein 1 |
| 6754550 |
|
Limk2 |
|
0 |
113 |
0 |
221 |
0 |
|
n.v. |
0.01 |
n.v. |
0.13 |
n.v. |
|
LIM domain kinase 2 isoform a |
| 76443701 |
|
Limk2 |
|
0 |
113 |
0 |
221 |
0 |
|
n.v. |
0.01 |
n.v. |
0.13 |
n.v. |
|
LIM domain kinase 2 isoform b |
| 77404365 |
|
Limk2 |
|
0 |
113 |
0 |
221 |
0 |
|
n.v. |
0.01 |
n.v. |
0.13 |
n.v. |
|
LIM domain kinase 2 isoform c |
| 300863087 |
|
Lims1 |
|
0 |
1263 |
6705 |
5583 |
21173 |
|
n.v. |
0.21 |
0.06 |
0.02 |
-0.58 |
|
LIM and senescent cell antigen-like-containing domain
protein 1 isoform 2 |
| 300863089 |
|
Lims1 |
|
0 |
1263 |
6057 |
5583 |
21173 |
|
n.v. |
0.21 |
0.11 |
0.02 |
-0.58 |
|
LIM and senescent cell antigen-like-containing domain
protein 1 isoform 3 |
| 84794647 |
|
Lims1 |
|
0 |
1263 |
6705 |
5583 |
21173 |
|
n.v. |
0.21 |
0.06 |
0.02 |
-0.58 |
|
LIM and senescent cell antigen-like-containing domain
protein 1 isoform 1 |
| 21450085 |
|
Lims2 |
|
0 |
0 |
648 |
254 |
0 |
|
n.v. |
n.v. |
-0.33 |
-0.26 |
n.v. |
|
LIM and senescent cell antigen-like-containing domain
protein 2 |
| 85701728 |
|
Lin7a |
|
165 |
73 |
1858 |
0 |
0 |
|
0.32 |
0.41 |
-0.19 |
n.v. |
n.v. |
|
protein lin-7 homolog A isoform 2 |
| 86991442 |
|
Lin7a |
|
165 |
1125 |
3351 |
0 |
0 |
|
0.32 |
-0.12 |
-0.1 |
n.v. |
n.v. |
|
protein lin-7 homolog A isoform 1 |
| 6755971 |
|
Lin7b |
|
165 |
73 |
2243 |
0 |
0 |
|
0.32 |
0.41 |
-0.06 |
n.v. |
n.v. |
|
protein lin-7 homolog B |
| 6755973 |
|
Lin7c |
|
8494 |
4590 |
17103 |
0 |
3009 |
|
0.16 |
-0.22 |
-0.13 |
n.v. |
-0.65 |
|
protein lin-7 homolog C |
| 161760651 |
|
Lipa |
|
0 |
1424 |
111 |
0 |
0 |
|
n.v. |
-0.09 |
-0.48 |
n.v. |
n.v. |
|
lysosomal acid lipase/cholesteryl ester hydrolase
precursor |
| 87239970 |
|
Lipe |
|
0 |
2 |
502 |
1817 |
0 |
|
n.v. |
1.11 |
0.16 |
0.2 |
n.v. |
|
hormone-sensitive lipase isoform 1 |
| 87239972 |
|
Lipe |
|
0 |
2 |
502 |
1817 |
0 |
|
n.v. |
1.11 |
0.16 |
0.2 |
n.v. |
|
hormone-sensitive lipase isoform 2 |
| 226874865 |
|
Llgl1 |
|
0 |
0 |
1905 |
3127 |
803 |
|
n.v. |
n.v. |
0.16 |
0.27 |
0.19 |
|
lethal(2) giant larvae protein homolog 1 isoform 3 |
| 226874867 |
|
Llgl1 |
|
0 |
0 |
1905 |
3127 |
803 |
|
n.v. |
n.v. |
0.16 |
0.27 |
0.19 |
|
lethal(2) giant larvae protein homolog 1 isoform 1 |
| 6678696 |
|
Llgl1 |
|
0 |
0 |
1905 |
3127 |
803 |
|
n.v. |
n.v. |
0.16 |
0.27 |
0.19 |
|
lethal(2) giant larvae protein homolog 1 isoform 2 |
| 144922656 |
|
Llgl2 |
|
6462 |
4108 |
20371 |
49343 |
96 |
|
-0.17 |
-0.07 |
0.12 |
-0.15 |
-0.51 |
|
lethal(2) giant larvae protein homolog 2 isoform 1 |
| 357527422 |
|
Llgl2 |
|
6462 |
3947 |
18043 |
32939 |
96 |
|
-0.17 |
-0.07 |
0.11 |
-0.19 |
-0.51 |
|
lethal(2) giant larvae protein homolog 2 isoform 2 |
| 21313566 |
|
Llph |
|
0 |
0 |
0 |
1416 |
0 |
|
n.v. |
n.v. |
n.v. |
-0.33 |
n.v. |
|
protein LLP homolog |
| 149270995 |
|
Llph-ps2 |
|
0 |
0 |
0 |
1416 |
0 |
|
n.v. |
n.v. |
n.v. |
-0.33 |
n.v. |
|
PREDICTED: protein LLP homolog |
| 21312570 |
|
Lman1 |
|
0 |
7933 |
2817 |
2055 |
0 |
|
n.v. |
-0.06 |
0.12 |
0.18 |
n.v. |
|
protein ERGIC-53 precursor |
| 34328278 |
|
Lman2 |
|
13199 |
9502 |
16825 |
16780 |
0 |
|
0.01 |
-0.11 |
-0.14 |
-0.11 |
n.v. |
|
vesicular integral-membrane protein VIP36 precursor |
| 61656186 |
|
Lman2l |
|
0 |
1104 |
698 |
0 |
0 |
|
n.v. |
-0.34 |
-0.23 |
n.v. |
n.v. |
|
VIP36-like protein precursor |
| 123701962 |
|
Lmbrd1 |
|
0 |
119 |
0 |
0 |
0 |
|
n.v. |
-0.08 |
n.v. |
n.v. |
n.v. |
|
probable lysosomal cobalamin transporter |
| 254939582 |
|
Lmf1 |
|
29894 |
4296 |
18251 |
4355 |
82046 |
|
0.14 |
0.12 |
0.06 |
0.2 |
0.14 |
|
lipase maturation factor 1 |
| 30725786 |
|
Lmf2 |
|
3460 |
453 |
176 |
0 |
0 |
|
-0.19 |
-0.18 |
-0.73 |
n.v. |
n.v. |
|
lipase maturation factor 2 |
| 9506843 |
|
Lmna |
|
1479584 |
4250 |
635 |
0 |
2784 |
|
-0.08 |
-0.37 |
-0.22 |
n.v. |
-0.22 |
|
prelamin-A/C isoform C2 |
| 161760667 |
|
Lmna |
|
2071289 |
4899 |
1179 |
270 |
11395 |
|
-0.07 |
-0.36 |
-0.17 |
0.73 |
-0.38 |
|
prelamin-A/C isoform C |
| 162287370 |
|
Lmna |
|
2225847 |
4943 |
1179 |
270 |
11791 |
|
-0.09 |
-0.33 |
-0.17 |
0.73 |
-0.39 |
|
prelamin-A/C isoform A precursor |
| 188219589 |
|
Lmnb1 |
|
646880 |
12195 |
1340 |
0 |
396 |
|
0 |
-0.14 |
-0.28 |
n.v. |
-0.76 |
|
lamin-B1 |
| 113195686 |
|
Lmnb2 |
|
234610 |
0 |
0 |
0 |
0 |
|
0.01 |
n.v. |
n.v. |
n.v. |
n.v. |
|
lamin-B2 |
| 157311641 |
|
Lmo7 |
|
0 |
0 |
155 |
0 |
2270 |
|
n.v. |
n.v. |
0.49 |
n.v. |
0.59 |
|
LIM domain only 7 |
| 124487401 |
|
Lmtk2 |
|
0 |
0 |
351 |
0 |
0 |
|
n.v. |
n.v. |
0.09 |
n.v. |
n.v. |
|
serine/threonine-protein kinase LMTK2 precursor |
| 27370240 |
|
Lnpep |
|
11661 |
6363 |
35244 |
15593 |
0 |
|
0.01 |
-0.03 |
0.12 |
0.01 |
n.v. |
|
leucyl-cystinyl aminopeptidase |
| 407260881 |
|
LOC100044322 |
|
5931 |
0 |
102 |
0 |
0 |
|
0.06 |
n.v. |
-0.29 |
n.v. |
n.v. |
|
PREDICTED: UDP-glucose:glycoprotein glucosyltransferase
1-like |
| 149257848 |
|
LOC100044391 |
|
0 |
409 |
0 |
3422 |
1253 |
|
n.v. |
-0.15 |
n.v. |
-0.15 |
0.24 |
|
PREDICTED: non-histone chromosomal protein
HMG-14-like |
| 377837128 |
|
LOC100044627 |
|
87228 |
13191 |
67873 |
98939 |
1649 |
|
-0.01 |
0.12 |
0.25 |
-0.19 |
-0.77 |
|
PREDICTED: 60S ribosomal protein L23-like |
| 149255928 |
|
LOC100044742 |
|
0 |
1624 |
2242 |
1653 |
2635 |
|
n.v. |
0.22 |
-0.01 |
0.02 |
-0.23 |
|
PREDICTED: protein tyrosine phosphatase type IVA 1-like
isoform 1 |
| 309263678 |
|
LOC100044811 |
|
0 |
0 |
0 |
802 |
0 |
|
n.v. |
n.v. |
n.v. |
0.08 |
n.v. |
|
PREDICTED: vacuolar protein sorting-associated protein 52
homolog |
| 149251501 |
|
LOC100044829 |
|
170740 |
7841 |
1673 |
17075 |
0 |
|
0.06 |
0.04 |
-0.25 |
-0.2 |
n.v. |
|
PREDICTED: rRNA 2'-O-methyltransferase fibrillarin-like
isoform 1 |
| 407262350 |
|
LOC100044900 |
|
751 |
0 |
0 |
0 |
0 |
|
0.37 |
n.v. |
n.v. |
n.v. |
n.v. |
|
PREDICTED: SUMO-conjugating enzyme UBC9-like |
| 407262350;35493987 |
|
LOC100044900 |
|
0 |
0 |
2455 |
0 |
0 |
|
n.v. |
n.v. |
-0.04 |
n.v. |
n.v. |
|
PREDICTED: SUMO-conjugating enzyme UBC9-like |
| 407262157 |
|
LOC100045148 |
|
0 |
0 |
9 |
0 |
0 |
|
n.v. |
n.v. |
0.03 |
n.v. |
n.v. |
|
PREDICTED: ribonuclease 3-like |
| 309267107 |
|
LOC100045191 |
|
2375993 |
0 |
0 |
0 |
0 |
|
-0.06 |
n.v. |
n.v. |
n.v. |
n.v. |
|
PREDICTED: heterogeneous nuclear ribonucleoproteins
A2/B1-like isoform 1 |
| 309267107;109134362 |
|
LOC100045191 |
|
0 |
0 |
46681 |
0 |
0 |
|
n.v. |
n.v. |
-0.08 |
n.v. |
n.v. |
|
PREDICTED: heterogeneous nuclear ribonucleoproteins
A2/B1-like isoform 1 |
| 309266688 |
|
LOC100045367 |
|
172406 |
50 |
42910 |
1056 |
0 |
|
-0.02 |
0.26 |
0.17 |
-0.36 |
n.v. |
|
PREDICTED: 60S ribosomal protein L19-like, partial |
| 149274502 |
|
LOC100045688 |
|
256 |
3092 |
0 |
0 |
2752 |
|
0.28 |
0.13 |
n.v. |
n.v. |
-0.61 |
|
PREDICTED: coiled-coil-helix-coiled-coil-helix
domain-containing protein 2, mitochondrial-like |
| 149271901 |
|
LOC100045848 |
|
9135 |
695 |
822 |
3446 |
2592 |
|
0.29 |
0.21 |
-0.02 |
-0.06 |
0.05 |
|
PREDICTED: protein BUD31 homolog isoform 2 |
| 149251548 |
|
LOC100045901 |
|
348 |
3810 |
5856 |
7318 |
35063 |
|
0.19 |
0.16 |
0.1 |
-0.02 |
0.06 |
|
PREDICTED: ubiquitin-conjugating enzyme E2 L3-like |
| 149262068 |
|
LOC100045924 |
|
348 |
572 |
199 |
0 |
1210 |
|
-0.42 |
0.27 |
0.13 |
n.v. |
-0.26 |
|
PREDICTED: mitotic spindle assembly checkpoint protein
MAD2A-like |
| 309267183 |
|
LOC100045968 |
|
47193 |
1774 |
2802 |
7563 |
3277 |
|
-0.02 |
0.22 |
-0.04 |
-0.1 |
-0.08 |
|
PREDICTED: NHP2-like protein 1-like |
| 149260287 |
|
LOC100045999 |
|
391383 |
56557 |
67174 |
115498 |
1182297 |
|
0.02 |
0.02 |
0.05 |
0.07 |
0 |
|
PREDICTED: GTP-binding nuclear protein Ran-like |
| 407262677 |
|
LOC100046048 |
|
0 |
0 |
0 |
278 |
0 |
|
n.v. |
n.v. |
n.v. |
-0.28 |
n.v. |
|
PREDICTED: host cell factor 1-like, partial |
| 149263037 |
|
LOC100046079 |
|
46497 |
19111 |
1636 |
0 |
0 |
|
-0.03 |
-0.06 |
-0.32 |
n.v. |
n.v. |
|
PREDICTED: cytochrome c oxidase subunit 5B,
mitochondrial-like |
| 149258501 |
|
LOC100046151 |
|
2506789 |
256530 |
67557 |
6999 |
0 |
|
-0.01 |
-0.13 |
-0.44 |
-0.58 |
n.v. |
|
PREDICTED: phosphate carrier protein, mitochondrial-like
isoform 1 |
| 407261592 |
|
LOC100046151 |
|
2506789 |
256530 |
67452 |
6999 |
0 |
|
-0.01 |
-0.13 |
-0.44 |
-0.58 |
n.v. |
|
PREDICTED: phosphate carrier protein, mitochondrial-like
isoform 2 |
| 407261594 |
|
LOC100046151 |
|
276531 |
55071 |
6051 |
49 |
0 |
|
0.04 |
-0.13 |
-0.46 |
0.59 |
n.v. |
|
PREDICTED: phosphate carrier protein, mitochondrial-like
isoform 3 |
| 149254294 |
|
LOC100046223 |
|
604 |
2042 |
10066 |
54082 |
0 |
|
0.07 |
0.31 |
0.35 |
0.03 |
n.v. |
|
PREDICTED: 40S ribosomal protein S15-like isoform 1 |
| 407261929 |
|
LOC100046289 |
|
1043 |
159 |
657 |
753 |
450 |
|
-0.01 |
0.05 |
-0.04 |
0.08 |
0.33 |
|
PREDICTED: transcription initiation factor IIA subunit
2-like |
| 149267077 |
|
LOC100046297 |
|
96198 |
6899 |
138393 |
142494 |
214 |
|
-0.03 |
0.16 |
0.17 |
-0.09 |
-0.9 |
|
PREDICTED: 40S ribosomal protein S26-like |
| 149251776 |
|
LOC100046628 |
|
298113 |
2662 |
63071 |
169097 |
49639 |
|
0.06 |
-0.04 |
-0.17 |
-0.23 |
-0.35 |
|
PREDICTED: nucleophosmin-like |
| 149274885 |
|
LOC100046684 |
|
50561 |
10031 |
0 |
0 |
203 |
|
-0.05 |
-0.15 |
n.v. |
n.v. |
-0.67 |
|
PREDICTED: ES1 protein homolog, mitochondrial-like
isoform 1 |
| 149274887 |
|
LOC100046684 |
|
39541 |
4071 |
0 |
0 |
203 |
|
-0.05 |
-0.14 |
n.v. |
n.v. |
-0.67 |
|
PREDICTED: ES1 protein homolog, mitochondrial-like
isoform 2 |
| 309266230 |
|
LOC100047252 |
|
34489 |
8112 |
66872 |
81127 |
633424 |
|
0.07 |
-0.04 |
-0.01 |
0.16 |
0.05 |
|
PREDICTED: phosphoserine aminotransferase-like isoform
2 |
| 149251053 |
|
LOC100047429 |
|
202391 |
0 |
0 |
0 |
0 |
|
0.02 |
n.v. |
n.v. |
n.v. |
n.v. |
|
PREDICTED: ATP synthase subunit O, mitochondrial-like |
| 149251053;20070412 |
|
LOC100047429 |
|
0 |
0 |
15246 |
0 |
0 |
|
n.v. |
n.v. |
-0.34 |
n.v. |
n.v. |
|
PREDICTED: ATP synthase subunit O, mitochondrial-like |
| 309264668 |
|
LOC100047518 |
|
9336 |
726 |
1831 |
966 |
1039 |
|
-0.07 |
0.11 |
-0.04 |
0.11 |
0.02 |
|
PREDICTED: tax1-binding protein 3-like isoform 2 |
| 407262733 |
|
LOC100047577 |
|
127520 |
1994 |
7296 |
9160 |
396 |
|
0.03 |
-0.26 |
-0.33 |
-0.36 |
0.08 |
|
PREDICTED: cytochrome b5 type B-like |
| 149261435 |
|
LOC100047658 |
|
824 |
4709 |
15744 |
21594 |
11631 |
|
0.2 |
0.15 |
0.06 |
-0.11 |
0.13 |
|
PREDICTED: eukaryotic translation initiation factor
5-like isoform 1 |
| 407262563 |
|
LOC100047753 |
|
2325 |
39707 |
48114 |
113657 |
233928 |
|
0.34 |
0.17 |
0.09 |
0.28 |
0.13 |
|
PREDICTED: nucleoside diphosphate kinase A-like |
| 149240955 |
|
LOC100047957 |
|
1373 |
2156 |
4412 |
76944 |
29826 |
|
1.1 |
0.16 |
-0.03 |
0.07 |
-0.13 |
|
PREDICTED: casein kinase II subunit alpha-like |
| 407261725 |
|
LOC100048117 |
|
2241974 |
202040 |
497027 |
1366760 |
2739930 |
|
0.03 |
0.01 |
-0.05 |
0.14 |
0.01 |
|
PREDICTED: glyceraldehyde-3-phosphate dehydrogenase-like
isoform 1 |
| 407261373 |
|
LOC100048119 |
|
55742 |
8177 |
24266 |
52183 |
163513 |
|
0.02 |
-0.12 |
0.04 |
-0.02 |
-0.04 |
|
PREDICTED: prostaglandin E synthase 3-like |
| 377834168 |
|
LOC100048410 |
|
8512 |
2 |
5100 |
0 |
0 |
|
-0.02 |
-0.08 |
-0.11 |
n.v. |
n.v. |
|
PREDICTED: guanine nucleotide-binding protein
G(I)/G(S)/G(O) subunit gamma-5-like |
| 149255796 |
|
LOC100048447 |
|
0 |
0 |
0 |
0 |
2945 |
|
n.v. |
n.v. |
n.v. |
n.v. |
0.42 |
|
PREDICTED: methyltransferase-like protein 21D-like |
| 407261032 |
|
LOC100048613 |
|
0 |
14617 |
237 |
0 |
0 |
|
n.v. |
-0.15 |
-0.33 |
n.v. |
n.v. |
|
PREDICTED: cytochrome c oxidase subunit 7C,
mitochondrial-like |
| 309267068 |
|
LOC100048629 |
|
0 |
0 |
31 |
0 |
0 |
|
n.v. |
n.v. |
0.63 |
n.v. |
n.v. |
|
PREDICTED: olfactory receptor 7A10-like, partial |
| 407262004 |
|
LOC100503047 |
|
494 |
253 |
5242 |
6090 |
750 |
|
-0.22 |
0.35 |
0.09 |
0.02 |
0.08 |
|
PREDICTED: eukaryotic translation initiation factor 1A,
X-chromosomal-like |
| 309264158 |
|
LOC100503055 |
|
28997 |
3282 |
16454 |
77296 |
0 |
|
-0.02 |
0.34 |
0.2 |
0.07 |
n.v. |
|
PREDICTED: 60S ribosomal protein L29-like |
| 309267076 |
|
LOC100503180 |
|
0 |
420 |
757 |
5525 |
6169 |
|
n.v. |
-0.29 |
-0.01 |
0.31 |
0.1 |
|
PREDICTED: acetyl-CoA carboxylase 1-like, partial |
| 309264728 |
|
LOC100503217 |
|
0 |
144 |
1348 |
6663 |
0 |
|
n.v. |
0.49 |
0.3 |
-0.05 |
n.v. |
|
PREDICTED: la-related protein 1B-like isoform 1 |
| 309265521 |
|
LOC100503235 |
|
0 |
278 |
76 |
0 |
2003 |
|
n.v. |
0.03 |
-0.38 |
n.v. |
0 |
|
PREDICTED: ubiquitin-conjugating enzyme E2 E1-like |
| 377833219 |
|
LOC100503822 |
|
0 |
3933 |
464 |
851 |
0 |
|
n.v. |
0.15 |
-0.06 |
-0.32 |
n.v. |
|
PREDICTED: protein FAM177A1 |
| 309265677 |
|
LOC100504817 |
|
157889 |
34381 |
58325 |
58404 |
47475 |
|
0.02 |
0.24 |
0.18 |
-0.13 |
0.04 |
|
PREDICTED: eukaryotic initiation factor 4A-III-like |
| 309265792 |
|
LOC100504863 |
|
87246 |
5897 |
29764 |
20284 |
4691 |
|
-0.11 |
0.04 |
0.17 |
-0.14 |
-0.11 |
|
PREDICTED: 60S ribosomal protein L22-like |
| 309263511 |
|
LOC100504872 |
|
112234 |
8705 |
69910 |
112437 |
0 |
|
-0.06 |
0.25 |
0.21 |
-0.15 |
n.v. |
|
PREDICTED: 60S ribosomal protein L32-like |
| 309265053 |
|
LOC100504912 |
|
45985 |
9782 |
3107 |
393 |
0 |
|
-0.18 |
-0.11 |
-0.32 |
-0.01 |
n.v. |
|
PREDICTED: up-regulated during skeletal muscle growth
protein 5-like |
| 309266753 |
|
LOC100504959 |
|
0 |
0 |
183 |
360 |
0 |
|
n.v. |
n.v. |
-0.22 |
0.11 |
n.v. |
|
PREDICTED: conserved oligomeric Golgi complex subunit
1-like |
| 309265938 |
|
LOC100504968 |
|
6114 |
2923 |
31 |
0 |
0 |
|
0.36 |
-0.07 |
-0.24 |
n.v. |
n.v. |
|
PREDICTED: NADH dehydrogenase [ubiquinone] iron-sulfur
protein 5-like |
| 309264544 |
|
LOC100504988 |
|
934 |
528 |
1826 |
5247 |
1017 |
|
-0.47 |
-0.51 |
-0.54 |
-0.52 |
-0.79 |
|
PREDICTED: signal recognition particle 14 kDa
protein-like |
| 309266758 |
|
LOC100505014 |
|
54881 |
424 |
16844 |
9675 |
0 |
|
-0.02 |
0.39 |
0.29 |
-0.03 |
n.v. |
|
PREDICTED: 60S ribosomal protein L15-like |
| 309264022 |
|
LOC100505031 |
|
455088 |
67475 |
457722 |
774371 |
31539 |
|
0.03 |
0.15 |
0.21 |
-0.13 |
-0.13 |
|
PREDICTED: 40S ribosomal protein SA-like |
| 309265361 |
|
LOC100505283 |
|
73096 |
26511 |
75005 |
93561 |
0 |
|
-0.01 |
0.21 |
0.2 |
-0.16 |
n.v. |
|
PREDICTED: 60S ribosomal protein L21-like |
| 377835354 |
|
LOC100861685 |
|
5455 |
29517 |
79646 |
329493 |
0 |
|
0.04 |
0.18 |
0.26 |
-0.12 |
n.v. |
|
PREDICTED: 60S ribosomal protein L23a-like |
| 377834995 |
|
LOC100861784 |
|
0 |
1632 |
5142 |
2546 |
20841 |
|
n.v. |
0.3 |
0.03 |
0 |
0.1 |
|
PREDICTED: ubiquitin-conjugating enzyme E2 L3-like |
| 407263800 |
|
LOC100861898 |
|
494 |
2202 |
15977 |
12778 |
1971 |
|
-0.22 |
0.28 |
0.14 |
0.06 |
-0.07 |
|
PREDICTED: eukaryotic translation initiation factor
1A-like |
| 377833741 |
|
LOC100861945 |
|
0 |
0 |
1210 |
0 |
0 |
|
n.v. |
n.v. |
0.21 |
n.v. |
n.v. |
|
PREDICTED: uncharacterized protein LOC100861945 |
| 377835119 |
|
LOC100861947 |
|
0 |
2325 |
6446 |
18696 |
4937 |
|
n.v. |
-0.18 |
0.03 |
-0.47 |
-0.35 |
|
PREDICTED: translational activator GCN1-like |
| 377834422 |
|
LOC100862012 |
|
113278 |
97339 |
81978 |
502070 |
353703 |
|
0.08 |
0.1 |
-0.04 |
0.14 |
-0.01 |
|
PREDICTED: peroxiredoxin-1 |
| 377834028 |
|
LOC100862066 |
|
0 |
0 |
645 |
5615 |
0 |
|
n.v. |
n.v. |
-0.43 |
-0.15 |
n.v. |
|
PREDICTED: uncharacterized protein LOC100862066 |
| 377837112 |
|
LOC100862431 |
|
0 |
0 |
234 |
0 |
0 |
|
n.v. |
n.v. |
-0.31 |
n.v. |
n.v. |
|
PREDICTED: h-2 class I histocompatibility antigen, D-D
alpha chain-like |
| 377837104 |
|
LOC100862433 |
|
270178 |
93529 |
200324 |
629396 |
0 |
|
0.06 |
0.13 |
0.18 |
-0.12 |
n.v. |
|
PREDICTED: 40S ribosomal protein S16-like |
| 377837120 |
|
LOC100862435 |
|
0 |
0 |
234 |
0 |
0 |
|
n.v. |
n.v. |
-0.31 |
n.v. |
n.v. |
|
PREDICTED: h-2 class I histocompatibility antigen, D-B
alpha chain-like |
| 377837231 |
|
LOC100862445 |
|
677 |
507 |
18394 |
2890 |
2892 |
|
1.26 |
0.92 |
0.22 |
0.18 |
-0.24 |
|
PREDICTED: 60S acidic ribosomal protein P1-like |
| 407262755 |
|
LOC100862445 |
|
677 |
507 |
18394 |
2890 |
2892 |
|
1.26 |
0.92 |
0.22 |
0.18 |
-0.24 |
|
PREDICTED: 60S acidic ribosomal protein P1-like |
| 407264599 |
|
LOC100862446 |
|
681386 |
104436 |
103466 |
583745 |
106988 |
|
-0.04 |
-0.16 |
-0.34 |
-0.2 |
-0.27 |
|
PREDICTED: ferritin light chain 1-like isoform 1 |
| 377834725 |
|
LOC100862447 |
|
0 |
0 |
234 |
0 |
0 |
|
n.v. |
n.v. |
-0.31 |
n.v. |
n.v. |
|
PREDICTED: h-2 class I histocompatibility antigen, D-D
alpha chain-like |
| 407262287 |
|
LOC100862455 |
|
54039 |
12181 |
41274 |
75487 |
1649 |
|
-0.02 |
0.12 |
0.29 |
-0.19 |
-0.77 |
|
PREDICTED: 60S ribosomal protein L23-like |
| 377837185 |
|
LOC100862468 |
|
106724 |
1833 |
5559 |
16150 |
5365 |
|
-0.07 |
0.01 |
-0.05 |
-0.03 |
-0.18 |
|
PREDICTED: NHP2-like protein 1-like |
| 407261291 |
|
LOC100862515 |
|
0 |
365 |
481 |
12622 |
9564 |
|
n.v. |
0.59 |
-0.02 |
0.23 |
0.3 |
|
PREDICTED: TBC1 domain family member 1-like, partial |
| 377834690 |
|
LOC100862531 |
|
0 |
138 |
0 |
0 |
0 |
|
n.v. |
0.62 |
n.v. |
n.v. |
n.v. |
|
PREDICTED: tRNA modification GTPase GTPBP3,
mitochondrial-like isoform 2 |
| 377833375 |
|
LOC100862557 |
|
1538 |
2092 |
1544 |
87545 |
21740 |
|
0.02 |
0.27 |
0.03 |
0.07 |
0.11 |
|
PREDICTED: myosin-6-like |
| 377833339 |
|
LOC100862587 |
|
28997 |
3282 |
16493 |
77296 |
0 |
|
-0.02 |
0.34 |
0.2 |
0.07 |
n.v. |
|
PREDICTED: 60S ribosomal protein L29-like |
| 377834331 |
|
LOC100862604 |
|
149908 |
5235 |
2038 |
6769 |
36209 |
|
0.02 |
-0.1 |
-0.02 |
-0.4 |
-0.05 |
|
PREDICTED: chromobox protein homolog 3-like |
| 407262330 |
|
LOC101055631 |
|
0 |
33 |
0 |
0 |
0 |
|
n.v. |
0.27 |
n.v. |
n.v. |
n.v. |
|
PREDICTED: uncharacterized LOC101055631 |
| 407262230 |
|
LOC101055659 |
|
6682 |
253 |
1330 |
909 |
0 |
|
-0.08 |
-0.2 |
-0.26 |
-0.67 |
n.v. |
|
PREDICTED: mitochondrial import receptor subunit TOM22
homolog |
| 407261331 |
|
LOC101055675 |
|
0 |
23 |
518 |
0 |
0 |
|
n.v. |
0.28 |
0.21 |
n.v. |
n.v. |
|
PREDICTED: 60S ribosomal protein L31-like |
| 407261069 |
|
LOC101055744 |
|
19185 |
37373 |
102507 |
66303 |
0 |
|
0.08 |
0.24 |
0.26 |
-0.01 |
n.v. |
|
PREDICTED: 60S ribosomal protein L18-like |
| 407262437 |
|
LOC101055749 |
|
29894 |
4296 |
18251 |
4355 |
82046 |
|
0.14 |
0.12 |
0.06 |
0.2 |
0.14 |
|
PREDICTED: uncharacterized LOC101055749 |
| 407264338 |
|
LOC101055749 |
|
29894 |
4296 |
18251 |
4355 |
82046 |
|
0.14 |
0.12 |
0.06 |
0.2 |
0.14 |
|
PREDICTED: uncharacterized protein LOC101055749 |
| 407261248 |
|
LOC101055761 |
|
732 |
0 |
375 |
229 |
6372 |
|
-0.04 |
n.v. |
0.06 |
0.13 |
-0.07 |
|
PREDICTED: coiled-coil domain-containing protein
72-like |
| 407261857 |
|
LOC101055799 |
|
14389 |
3530 |
19349 |
11157 |
2442 |
|
0.07 |
-0.02 |
0.18 |
-0.04 |
-0.07 |
|
PREDICTED: 60S ribosomal protein L22-like |
| 407262441 |
|
LOC101055815 |
|
3881 |
2597 |
2855 |
5108 |
4048 |
|
0 |
0.12 |
0.12 |
0.13 |
-0.08 |
|
PREDICTED: eukaryotic translation initiation factor
1-like |
| 407262010 |
|
LOC101055828 |
|
0 |
695 |
4703 |
4920 |
8375 |
|
n.v. |
-0.07 |
-0.15 |
-0.39 |
-0.39 |
|
PREDICTED: protein AHNAK2-like |
| 407263825 |
|
LOC101055828 |
|
0 |
1048 |
4706 |
4920 |
8375 |
|
n.v. |
-0.06 |
-0.16 |
-0.39 |
-0.39 |
|
PREDICTED: protein AHNAK2-like |
| 407260908 |
|
LOC101055829 |
|
232615 |
37339 |
116591 |
402975 |
0 |
|
-0.05 |
0.2 |
0.25 |
-0.31 |
n.v. |
|
PREDICTED: 60S ribosomal protein L7a-like |
| 407261194 |
|
LOC101055843 |
|
0 |
3947 |
9642 |
0 |
0 |
|
n.v. |
0.59 |
0.05 |
n.v. |
n.v. |
|
PREDICTED: perilipin-2-like |
| 407262073 |
|
LOC101055909 |
|
421 |
1424 |
947 |
0 |
0 |
|
-0.23 |
-0.05 |
-0.35 |
n.v. |
n.v. |
|
PREDICTED: protein transport protein Sec61 subunit
beta-like |
| 407261941 |
|
LOC101055913 |
|
513 |
42 |
239 |
0 |
546 |
|
-0.73 |
0.33 |
0.15 |
n.v. |
-0.27 |
|
PREDICTED: small ubiquitin-related modifier 2-like |
| 407262980 |
|
LOC101055915 |
|
340144 |
63110 |
230441 |
534321 |
0 |
|
-0.03 |
0.11 |
0.21 |
-0.18 |
n.v. |
|
PREDICTED: 40S ribosomal protein S8-like |
| 407262455 |
|
LOC101055925 |
|
155546 |
17349 |
41356 |
80497 |
3716 |
|
0.01 |
0.02 |
0.19 |
-0.23 |
-0.23 |
|
PREDICTED: 60S ribosomal protein L12-like |
| 407262470 |
|
LOC101055936 |
|
10398 |
0 |
0 |
0 |
0 |
|
-0.07 |
n.v. |
n.v. |
n.v. |
n.v. |
|
PREDICTED: 60S ribosomal protein L7a-like |
| 407264353 |
|
LOC101055936 |
|
10398 |
0 |
0 |
0 |
0 |
|
-0.07 |
n.v. |
n.v. |
n.v. |
n.v. |
|
PREDICTED: 60S ribosomal protein L7a-like |
| 407261474 |
|
LOC101055953 |
|
0 |
2822 |
0 |
0 |
0 |
|
n.v. |
-0.56 |
n.v. |
n.v. |
n.v. |
|
PREDICTED: 39S ribosomal protein L41, mitochondrial-like |
| 407264058 |
|
LOC101055956 |
|
0 |
457 |
0 |
53263 |
0 |
|
n.v. |
0.21 |
n.v. |
0.26 |
n.v. |
|
PREDICTED: elongation factor 1-gamma-like |
| 407262130 |
|
LOC101056029 |
|
310470 |
24601 |
114890 |
105496 |
0 |
|
-0.04 |
-0.11 |
0.18 |
-0.16 |
n.v. |
|
PREDICTED: 60S ribosomal protein L9-like |
| 407264033 |
|
LOC101056029 |
|
310470 |
24601 |
114890 |
105496 |
0 |
|
-0.04 |
-0.11 |
0.18 |
-0.16 |
n.v. |
|
PREDICTED: 60S ribosomal protein L9-like |
| 407261723 |
|
LOC101056044 |
|
110202 |
3169 |
1052 |
11918 |
0 |
|
-0.15 |
0.03 |
-0.39 |
-0.19 |
n.v. |
|
PREDICTED: nucleolar protein 56-like |
| 407262307 |
|
LOC101056061 |
|
29308 |
221 |
2220 |
0 |
0 |
|
-0.01 |
0.06 |
-0.01 |
n.v. |
n.v. |
|
PREDICTED: enhancer of rudimentary homolog |
| 407263189 |
|
LOC101056102 |
|
458 |
954 |
2731 |
3430 |
0 |
|
0.28 |
0.29 |
0.39 |
-0.37 |
n.v. |
|
PREDICTED: envelope glycoprotein-like, partial |
| 407261583 |
|
LOC101056128 |
|
0 |
1104 |
530 |
0 |
0 |
|
n.v. |
-0.34 |
-0.23 |
n.v. |
n.v. |
|
PREDICTED: VIP36-like protein-like |
| 407262373 |
|
LOC101056140 |
|
112747 |
18161 |
64949 |
156369 |
0 |
|
-0.04 |
0.24 |
0.25 |
-0.12 |
n.v. |
|
PREDICTED: uncharacterized LOC101056140 |
| 407264228 |
|
LOC101056140 |
|
184360 |
21412 |
89361 |
276787 |
0 |
|
0.02 |
0.2 |
0.29 |
-0.14 |
n.v. |
|
PREDICTED: uncharacterized protein LOC101056140 |
| 407261282 |
|
LOC101056154 |
|
677 |
507 |
18394 |
2890 |
2892 |
|
1.26 |
0.92 |
0.22 |
0.18 |
-0.24 |
|
PREDICTED: 60S acidic ribosomal protein P1-like |
| 407263193 |
|
LOC101056154 |
|
677 |
507 |
18394 |
2890 |
2892 |
|
1.26 |
0.92 |
0.22 |
0.18 |
-0.24 |
|
PREDICTED: 60S acidic ribosomal protein P1-like |
| 407263038 |
|
LOC101056241 |
|
0 |
152 |
1395 |
0 |
0 |
|
n.v. |
0.2 |
0.2 |
n.v. |
n.v. |
|
PREDICTED: plasma membrane calcium-transporting ATPase
1-like |
| 407261825 |
|
LOC101056244 |
|
238 |
0 |
12 |
0 |
311 |
|
-0.44 |
n.v. |
0.22 |
n.v. |
-0.64 |
|
PREDICTED: eukaryotic translation initiation factor
1b-like |
| 407261113 |
|
LOC101056341 |
|
1418625 |
114838 |
284797 |
642026 |
988894 |
|
0 |
0.01 |
-0.05 |
0.1 |
0 |
|
PREDICTED: glyceraldehyde-3-phosphate dehydrogenase-like,
partial |
| 407262753 |
|
LOC101056348 |
|
0 |
2672 |
13 |
0 |
0 |
|
n.v. |
-0.08 |
-0.14 |
n.v. |
n.v. |
|
PREDICTED: succinate dehydrogenase [ubiquinone]
iron-sulfur subunit, mitochondrial-like |
| 407261656 |
|
LOC101056352 |
|
0 |
0 |
0 |
0 |
20112 |
|
n.v. |
n.v. |
n.v. |
n.v. |
0.02 |
|
PREDICTED: alpha-enolase-like |
| 407262207 |
|
LOC101056365 |
|
4320 |
4989 |
16855 |
130863 |
0 |
|
0.1 |
0.31 |
0.27 |
-0.05 |
n.v. |
|
PREDICTED: 40S ribosomal protein S24-like |
| 407262376 |
|
LOC101056370 |
|
281254 |
3363 |
2742 |
1261 |
11159 |
|
-0.02 |
0.04 |
-0.5 |
-0.21 |
-0.18 |
|
PREDICTED: 60 kDa heat shock protein,
mitochondrial-like |
| 407261123 |
|
LOC101056383 |
|
0 |
152 |
1395 |
0 |
0 |
|
n.v. |
0.2 |
0.2 |
n.v. |
n.v. |
|
PREDICTED: plasma membrane calcium-transporting ATPase
1-like |
| 407261888 |
|
LOC101056386 |
|
197925 |
7461 |
8064 |
184093 |
482 |
|
-0.04 |
-0.15 |
-0.29 |
-0.16 |
0.23 |
|
PREDICTED: ferritin light chain 1-like |
| 407260886 |
|
LOC101056391 |
|
0 |
0 |
0 |
2333 |
1456 |
|
n.v. |
n.v. |
n.v. |
0 |
0.01 |
|
PREDICTED: DNA-(apurinic or apyrimidinic site) lyase-like |
| 407261870;31543471 |
|
LOC101056392 |
|
0 |
0 |
88 |
0 |
0 |
|
n.v. |
n.v. |
-0.43 |
n.v. |
n.v. |
|
PREDICTED: peroxisomal membrane protein PEX13-like
isoform 1 |
| 407262029 |
|
LOC101056437 |
|
0 |
0 |
0 |
0 |
19588 |
|
n.v. |
n.v. |
n.v. |
n.v. |
-0.04 |
|
PREDICTED: serpin B9-like |
| 407262314 |
|
LOC101056444 |
|
608400 |
124733 |
289620 |
591161 |
1113574 |
|
0.05 |
0.08 |
-0.03 |
0.06 |
0.04 |
|
PREDICTED: 14-3-3 protein zeta/delta-like, partial |
| 407262619 |
|
LOC101056446 |
|
2233 |
0 |
623 |
0 |
0 |
|
-0.1 |
n.v. |
-0.13 |
n.v. |
n.v. |
|
PREDICTED: h-2 class I histocompatibility antigen, D-D
alpha chain-like isoform 9 |
| 407262621 |
|
LOC101056446 |
|
2233 |
0 |
623 |
0 |
0 |
|
-0.1 |
n.v. |
-0.13 |
n.v. |
n.v. |
|
PREDICTED: h-2 class I histocompatibility antigen, D-D
alpha chain-like isoform 10 |
| 407262603 |
|
LOC101056446 |
|
2233 |
349 |
623 |
0 |
0 |
|
-0.1 |
-0.34 |
-0.13 |
n.v. |
n.v. |
|
PREDICTED: h-2 class I histocompatibility antigen, D-D
alpha chain-like isoform 1 |
| 407262605 |
|
LOC101056446 |
|
2233 |
349 |
623 |
0 |
0 |
|
-0.1 |
-0.34 |
-0.13 |
n.v. |
n.v. |
|
PREDICTED: h-2 class I histocompatibility antigen, D-D
alpha chain-like isoform 2 |
| 407262607 |
|
LOC101056446 |
|
2233 |
349 |
623 |
0 |
0 |
|
-0.1 |
-0.34 |
-0.13 |
n.v. |
n.v. |
|
PREDICTED: h-2 class I histocompatibility antigen, D-D
alpha chain-like isoform 3 |
| 407262609 |
|
LOC101056446 |
|
2233 |
349 |
623 |
0 |
0 |
|
-0.1 |
-0.34 |
-0.13 |
n.v. |
n.v. |
|
PREDICTED: h-2 class I histocompatibility antigen, D-D
alpha chain-like isoform 4 |
| 407262611 |
|
LOC101056446 |
|
2233 |
349 |
623 |
0 |
0 |
|
-0.1 |
-0.34 |
-0.13 |
n.v. |
n.v. |
|
PREDICTED: h-2 class I histocompatibility antigen, D-D
alpha chain-like isoform 5 |
| 407262613 |
|
LOC101056446 |
|
2233 |
349 |
623 |
0 |
0 |
|
-0.1 |
-0.34 |
-0.13 |
n.v. |
n.v. |
|
PREDICTED: h-2 class I histocompatibility antigen, D-D
alpha chain-like isoform 6 |
| 407262615 |
|
LOC101056446 |
|
2233 |
349 |
389 |
0 |
0 |
|
-0.1 |
-0.34 |
0 |
n.v. |
n.v. |
|
PREDICTED: h-2 class I histocompatibility antigen, D-D
alpha chain-like isoform 7 |
| 407262617 |
|
LOC101056446 |
|
2233 |
349 |
623 |
0 |
0 |
|
-0.1 |
-0.34 |
-0.13 |
n.v. |
n.v. |
|
PREDICTED: h-2 class I histocompatibility antigen, D-D
alpha chain-like isoform 8 |
| 407262576 |
|
LOC101056452 |
|
14205 |
22439 |
99330 |
173673 |
19823 |
|
-0.02 |
0.29 |
0.12 |
0 |
0.07 |
|
PREDICTED: eukaryotic translation initiation factor 2
subunit 3-like |
| 407262333 |
|
LOC101056456 |
|
0 |
0 |
0 |
24082 |
0 |
|
n.v. |
n.v. |
n.v. |
-0.07 |
n.v. |
|
PREDICTED: WW domain-containing adapter protein with
coiled-coil-like isoform 1 |
| 407262335 |
|
LOC101056456 |
|
0 |
0 |
0 |
24082 |
0 |
|
n.v. |
n.v. |
n.v. |
-0.07 |
n.v. |
|
PREDICTED: WW domain-containing adapter protein with
coiled-coil-like isoform 2 |
| 407262339 |
|
LOC101056456 |
|
0 |
0 |
0 |
24082 |
0 |
|
n.v. |
n.v. |
n.v. |
-0.07 |
n.v. |
|
PREDICTED: WW domain-containing adapter protein with
coiled-coil-like isoform 4 |
| 407262341 |
|
LOC101056456 |
|
0 |
0 |
0 |
24082 |
0 |
|
n.v. |
n.v. |
n.v. |
-0.07 |
n.v. |
|
PREDICTED: WW domain-containing adapter protein with
coiled-coil-like isoform 5 |
| 407262343 |
|
LOC101056456 |
|
0 |
0 |
0 |
24082 |
0 |
|
n.v. |
n.v. |
n.v. |
-0.07 |
n.v. |
|
PREDICTED: WW domain-containing adapter protein with
coiled-coil-like isoform 6 |
| 407261812 |
|
LOC101056470 |
|
15304 |
22278 |
55839 |
144950 |
0 |
|
-0.02 |
0.17 |
0.3 |
-0.1 |
n.v. |
|
PREDICTED: uncharacterized protein LOC101056470 |
| 407262623 |
|
LOC101056478 |
|
1281 |
5123 |
3810 |
27798 |
75877 |
|
0.49 |
0.29 |
0.18 |
0.21 |
0.19 |
|
PREDICTED: high mobility group protein B1-like |
| 407262528 |
|
LOC101056486 |
|
494 |
1950 |
11249 |
13367 |
1221 |
|
-0.22 |
0.26 |
0.16 |
0.09 |
-0.07 |
|
PREDICTED: eukaryotic translation initiation factor
1A-like |
| 407262506 |
|
LOC101056523 |
|
3899 |
255 |
10322 |
38349 |
13365 |
|
0.13 |
0.08 |
0.07 |
-0.18 |
-0.19 |
|
PREDICTED: protein flightless-1 homolog, partial |
| 407261989 |
|
LOC101056543 |
|
35276 |
4221 |
7883 |
81692 |
0 |
|
0.09 |
-0.07 |
0.19 |
-0.23 |
n.v. |
|
PREDICTED: 40S ribosomal protein S2-like |
| 407262193 |
|
LOC101056544 |
|
217091 |
22351 |
155015 |
174352 |
1853 |
|
-0.05 |
0.1 |
0.24 |
-0.25 |
-0.5 |
|
PREDICTED: 40S ribosomal protein S14-like |
| 407262152 |
|
LOC101056551 |
|
0 |
0 |
0 |
0 |
600 |
|
n.v. |
n.v. |
n.v. |
n.v. |
0.49 |
|
PREDICTED: uncharacterized protein LOC101056551 |
| 407262277 |
|
LOC101056557 |
|
422906 |
92191 |
182232 |
511843 |
1027791 |
|
-0.04 |
0.01 |
-0.04 |
0.13 |
0 |
|
PREDICTED: glyceraldehyde-3-phosphate
dehydrogenase-like |
| 407262168 |
|
LOC101056558 |
|
2746 |
0 |
0 |
0 |
0 |
|
0.01 |
n.v. |
n.v. |
n.v. |
n.v. |
|
PREDICTED: apolipoprotein L3-like |
| 407262168;238776830 |
|
LOC101056558 |
|
0 |
0 |
20923 |
0 |
0 |
|
n.v. |
n.v. |
0.17 |
n.v. |
n.v. |
|
PREDICTED: apolipoprotein L3-like |
| 407261780 |
|
LOC101056559 |
|
0 |
0 |
290 |
0 |
0 |
|
n.v. |
n.v. |
0.01 |
n.v. |
n.v. |
|
PREDICTED: G/T mismatch-specific thymine DNA
glycosylase-like |
| 407262460 |
|
LOC101056577 |
|
531 |
1200 |
9 |
0 |
1114 |
|
0.07 |
-0.1 |
-0.5 |
n.v. |
-0.25 |
|
PREDICTED: mitochondrial import inner membrane
translocase subunit Tim8 A-like |
| 407262586 |
|
LOC101056592 |
|
178026 |
30703 |
322 |
0 |
11191 |
|
-0.07 |
-0.14 |
-0.55 |
n.v. |
-0.28 |
|
PREDICTED: electron transfer flavoprotein subunit
beta-like |
| 407262172 |
|
LOC101056595 |
|
112674 |
1612 |
16038 |
38308 |
4080 |
|
0.04 |
-0.01 |
-0.19 |
-0.2 |
-0.33 |
|
PREDICTED: serine/arginine-rich splicing factor
3-like |
| 407260973 |
|
LOC101056616 |
|
0 |
3565 |
4844 |
8734 |
21280 |
|
n.v. |
0.04 |
-0.03 |
0.1 |
0.1 |
|
PREDICTED: transcription elongation factor B polypeptide
1-like |
| 407261696 |
|
LOC101056619 |
|
3359410 |
408048 |
479284 |
2405508 |
1643063 |
|
0.03 |
0.05 |
0 |
0.06 |
-0.02 |
|
PREDICTED: elongation factor 1-alpha 1-like isoform
1 |
| 407261700 |
|
LOC101056619 |
|
3359410 |
408048 |
479284 |
2405369 |
1644348 |
|
0.03 |
0.05 |
0 |
0.06 |
-0.02 |
|
PREDICTED: elongation factor 1-alpha 1-like isoform
3 |
| 407261702 |
|
LOC101056619 |
|
3129340 |
383965 |
475807 |
1894557 |
1629997 |
|
0.02 |
0.03 |
-0.01 |
0.04 |
-0.02 |
|
PREDICTED: elongation factor 1-alpha 1-like isoform
4 |
| 407261716 |
|
LOC101056619 |
|
3211644 |
394887 |
463131 |
2315172 |
1590629 |
|
0.03 |
0.06 |
0 |
0.06 |
-0.02 |
|
PREDICTED: elongation factor 1-alpha 1-like isoform
11 |
| 407261718 |
|
LOC101056619 |
|
2588397 |
258194 |
357372 |
1974710 |
1571138 |
|
0.06 |
0.06 |
-0.01 |
0.05 |
-0.04 |
|
PREDICTED: elongation factor 1-alpha 1-like isoform
12 |
| 407262235 |
|
LOC101056658 |
|
30132 |
27405 |
40254 |
229638 |
324894 |
|
0.33 |
0.14 |
-0.02 |
0.2 |
0 |
|
PREDICTED: adenosylhomocysteinase-like |
| 407262590 |
|
LOC101056659 |
|
341517 |
25791 |
0 |
13318 |
0 |
|
0.01 |
-0.1 |
n.v. |
-0.17 |
n.v. |
|
PREDICTED: histone H3.3-like |
| 407262435 |
|
LOC101056668 |
|
3204 |
0 |
0 |
0 |
0 |
|
0.17 |
n.v. |
n.v. |
n.v. |
n.v. |
|
PREDICTED: cohesin subunit SA-2-like |
| 407262493 |
|
LOC101056688 |
|
0 |
5033 |
7343 |
19171 |
65489 |
|
n.v. |
0.31 |
0.07 |
0.2 |
0.03 |
|
PREDICTED: tryptophan--tRNA ligase, cytoplasmic-like |
| 407260978 |
|
LOC101056690 |
|
0 |
0 |
0 |
0 |
4830 |
|
n.v. |
n.v. |
n.v. |
n.v. |
0.09 |
|
PREDICTED: DNA repair protein SWI5 homolog |
| 407260980 |
|
LOC101056690 |
|
0 |
0 |
0 |
0 |
4830 |
|
n.v. |
n.v. |
n.v. |
n.v. |
0.09 |
|
PREDICTED: DNA repair protein SWI5 homolog |
| 407260982 |
|
LOC101056690 |
|
0 |
0 |
0 |
0 |
4830 |
|
n.v. |
n.v. |
n.v. |
n.v. |
0.09 |
|
PREDICTED: DNA repair protein SWI5 homolog |
| 407260984 |
|
LOC101056690 |
|
0 |
0 |
0 |
0 |
3973 |
|
n.v. |
n.v. |
n.v. |
n.v. |
0.07 |
|
PREDICTED: DNA repair protein SWI5 homolog |
| 377834539 |
|
LOC215866 |
|
458 |
827 |
2616 |
3389 |
0 |
|
0.28 |
0.31 |
0.4 |
-0.45 |
n.v. |
|
PREDICTED: envelope glycoprotein |
| 407263623 |
|
LOC215866 |
|
458 |
827 |
2616 |
3389 |
0 |
|
0.28 |
0.31 |
0.4 |
-0.45 |
n.v. |
|
PREDICTED: envelope glycoprotein |
| 82975294 |
|
LOC386400 |
|
0 |
3561 |
1588 |
3806 |
63989 |
|
n.v. |
-0.11 |
0.06 |
0.16 |
0.02 |
|
PREDICTED: carbonyl reductase [NADPH] 1-like |
| 407261848 |
|
LOC434624 |
|
174255 |
6670 |
4879 |
114262 |
0 |
|
-0.1 |
-0.17 |
-0.38 |
-0.16 |
n.v. |
|
PREDICTED: ferritin light chain 1-like |
| 377834670 |
|
LOC547349 |
|
0 |
0 |
234 |
0 |
0 |
|
n.v. |
n.v. |
-0.31 |
n.v. |
n.v. |
|
PREDICTED: h-2 class I histocompatibility antigen, D-B
alpha chain |
| 68534959 |
|
LOC547349 |
|
0 |
0 |
234 |
0 |
0 |
|
n.v. |
n.v. |
-0.31 |
n.v. |
n.v. |
|
MHC class I family member precursor |
| 407262567 |
|
LOC630855 |
|
91457 |
18203 |
96011 |
120451 |
0 |
|
-0.02 |
0.14 |
0.2 |
-0.12 |
n.v. |
|
PREDICTED: 60S ribosomal protein L12-like isoform 1 |
| 82916992 |
|
LOC631033 |
|
860 |
11273 |
9834 |
492591 |
5269 |
|
0.29 |
0.14 |
-0.02 |
0.07 |
0.02 |
|
PREDICTED: lysine--tRNA ligase-like isoform 1 |
| 82913708 |
|
LOC631040 |
|
3240 |
992 |
10 |
0 |
0 |
|
0.02 |
-0.1 |
-0.17 |
n.v. |
n.v. |
|
PREDICTED: NADH dehydrogenase [ubiquinone] iron-sulfur
protein 6, mitochondrial-like |
| 407261777 |
|
LOC631286 |
|
13675 |
9143 |
13517 |
23984 |
41339 |
|
-0.01 |
0.19 |
0.01 |
0.03 |
0.09 |
|
PREDICTED: low molecular weight phosphotyrosine protein
phosphatase-like |
| 82892305 |
|
LOC631287 |
|
0 |
2601 |
2109 |
65 |
0 |
|
n.v. |
-0.32 |
-0.31 |
-0.7 |
n.v. |
|
PREDICTED: interferon-induced transmembrane protein
2-like |
| 82918783 |
|
LOC631966 |
|
3881 |
2597 |
2763 |
5026 |
3116 |
|
0 |
0.12 |
0.12 |
0.11 |
-0.21 |
|
PREDICTED: eukaryotic translation initiation factor
1-like |
| 149253567 |
|
LOC632465 |
|
0 |
0 |
0 |
892 |
2046 |
|
n.v. |
n.v. |
n.v. |
-0.04 |
0.07 |
|
PREDICTED: RING-box protein 2-like |
| 82935644 |
|
LOC633406 |
|
0 |
0 |
600 |
205 |
0 |
|
n.v. |
n.v. |
-0.06 |
1.04 |
n.v. |
|
PREDICTED: rRNA-processing protein FCF1 homolog |
| 83013315 |
|
LOC634339 |
|
1117 |
33 |
13185 |
53182 |
0 |
|
0.08 |
0.44 |
0.23 |
-0.1 |
n.v. |
|
PREDICTED: 60S ribosomal protein L21-like |
| 82916356 |
|
LOC634555 |
|
549 |
0 |
0 |
0 |
0 |
|
-0.01 |
n.v. |
n.v. |
n.v. |
n.v. |
|
PREDICTED: nucleoporin Nup37-like |
| 82931574 |
|
LOC635999 |
|
165 |
353 |
1266 |
3061 |
1778 |
|
0.24 |
0.32 |
0.15 |
0.1 |
0.03 |
|
PREDICTED: peptidyl-prolyl cis-trans isomerase
NIMA-interacting 4-like |
| 82905443 |
|
LOC636901 |
|
301097 |
39166 |
329048 |
341936 |
25821 |
|
0.05 |
0.17 |
0.22 |
-0.13 |
-0.4 |
|
PREDICTED: 40S ribosomal protein SA-like isoform 1 |
| 82898629 |
|
LOC637553 |
|
18068 |
32757 |
63469 |
311231 |
0 |
|
-0.08 |
0.14 |
0.19 |
-0.1 |
n.v. |
|
PREDICTED: 60S ribosomal protein L36-like |
| 83009766 |
|
LOC637657 |
|
146 |
526 |
111 |
0 |
1135 |
|
0.1 |
0.29 |
-0.01 |
n.v. |
0.07 |
|
PREDICTED: ragulator complex protein LAMTOR3-like |
| 83014391 |
|
LOC637733 |
|
135245 |
17341 |
28577 |
114475 |
301569 |
|
0.16 |
0.25 |
0.01 |
0.18 |
0.1 |
|
PREDICTED: high mobility group protein B1-like |
| 309263460 |
|
LOC638236 |
|
90413 |
8004 |
64076 |
341019 |
0 |
|
0 |
0.13 |
0.22 |
-0.08 |
n.v. |
|
PREDICTED: 60S ribosomal protein L13a-like |
| 82898755 |
|
LOC638399 |
|
124316 |
8089 |
116780 |
48442 |
1210 |
|
0 |
0.09 |
0.21 |
-0.2 |
-1.1 |
|
PREDICTED: 60S ribosomal protein L31-like isoform 1 |
| 377833703 |
|
LOC639541 |
|
0 |
449 |
332 |
0 |
20027 |
|
n.v. |
-0.08 |
-0.53 |
n.v. |
-0.07 |
|
PREDICTED: protein farnesyltransferase subunit
beta-like |
| 82885488 |
|
LOC639905 |
|
0 |
319 |
566 |
0 |
4005 |
|
n.v. |
0.48 |
0.09 |
n.v. |
-0.04 |
|
PREDICTED: SAP30-binding protein-like |
| 82942326 |
|
LOC639931 |
|
0 |
0 |
0 |
892 |
2046 |
|
n.v. |
n.v. |
n.v. |
-0.04 |
0.07 |
|
PREDICTED: RING-box protein 2-like |
| 309264229 |
|
LOC640611 |
|
0 |
3371 |
3695 |
11124 |
48932 |
|
n.v. |
0.15 |
0.07 |
0.12 |
0.15 |
|
PREDICTED: cyclin-dependent kinase 4-like |
| 309267099 |
|
LOC640856 |
|
6133 |
342 |
0 |
0 |
311 |
|
-2.47 |
-0.58 |
n.v. |
n.v. |
-1.04 |
|
PREDICTED: ubiquinone biosynthesis protein COQ9,
mitochondrial-like |
| 149274459 |
|
LOC668643 |
|
0 |
0 |
164 |
0 |
0 |
|
n.v. |
n.v. |
0.02 |
n.v. |
n.v. |
|
PREDICTED: zinc finger protein 709-like |
| 94394659 |
|
LOC674321 |
|
1574 |
1647 |
0 |
0 |
0 |
|
1.06 |
0.04 |
n.v. |
n.v. |
n.v. |
|
PREDICTED: glycine cleavage system H protein,
mitochondrial-like |
| 377833655 |
|
LOC674595 |
|
76904 |
61 |
63 |
0 |
0 |
|
-0.05 |
0.02 |
-0.16 |
n.v. |
n.v. |
|
PREDICTED: heterogeneous nuclear ribonucleoprotein
A3-like |
| 309263209 |
|
LOC674846 |
|
0 |
0 |
0 |
0 |
793 |
|
n.v. |
n.v. |
n.v. |
n.v. |
-0.36 |
|
PREDICTED: protein FAM136A-like, partial |
| 407262183 |
|
LOC675851 |
|
8933 |
4553 |
190 |
0 |
0 |
|
-0.29 |
-0.15 |
-0.67 |
n.v. |
n.v. |
|
PREDICTED: NADH dehydrogenase [ubiquinone] 1 subunit
C2-like |
| 149267855 |
|
LOC677113 |
|
23981 |
5342 |
24193 |
145261 |
0 |
|
-0.04 |
0.37 |
0.23 |
-0.1 |
n.v. |
|
PREDICTED: 40S ribosomal protein S24-like |
| 407262542 |
|
LOC677654 |
|
9556 |
30375 |
34868 |
17231 |
489189 |
|
0.3 |
0.2 |
0.06 |
0.11 |
0.12 |
|
PREDICTED: peroxiredoxin-6-like, partial |
| 27754073 |
|
Loh12cr1 |
|
0 |
98 |
211 |
0 |
782 |
|
n.v. |
-0.34 |
0.03 |
n.v. |
0.17 |
|
loss of heterozygosity 12 chromosomal region 1 protein
homolog isoform 2 |
| 281427221 |
|
Loh12cr1 |
|
0 |
98 |
211 |
0 |
782 |
|
n.v. |
-0.34 |
0.03 |
n.v. |
0.17 |
|
loss of heterozygosity 12 chromosomal region 1 protein
homolog isoform 1 |
| 116089322 |
|
Lonp1 |
|
77929 |
50182 |
0 |
0 |
2388 |
|
-0.14 |
-0.18 |
n.v. |
n.v. |
-0.47 |
|
lon protease homolog, mitochondrial precursor |
| 13385298 |
|
Lonp2 |
|
0 |
2476 |
3557 |
0 |
0 |
|
n.v. |
-0.24 |
-0.28 |
n.v. |
n.v. |
|
lon protease homolog 2, peroxisomal isoform 1 |
| 274319427 |
|
Lonp2 |
|
0 |
205 |
918 |
0 |
0 |
|
n.v. |
-0.85 |
-0.29 |
n.v. |
n.v. |
|
lon protease homolog 2, peroxisomal isoform 2 |
| 40254539 |
|
Lpar2 |
|
0 |
0 |
0 |
0 |
0 |
|
n.v. |
n.v. |
0.54 |
n.v. |
n.v. |
|
lysophosphatidic acid receptor 2 |
| 148747363 |
|
Lpcat1 |
|
1318 |
1856 |
1119 |
0 |
0 |
|
-0.16 |
-0.55 |
-0.32 |
n.v. |
n.v. |
|
lysophosphatidylcholine acyltransferase 1 |
| 27370522 |
|
Lpcat2 |
|
0 |
290 |
176 |
0 |
0 |
|
n.v. |
-0.49 |
-0.43 |
n.v. |
n.v. |
|
lysophosphatidylcholine acyltransferase 2 |
| 21699058 |
|
Lpcat3 |
|
0 |
315 |
531 |
0 |
0 |
|
n.v. |
-0.3 |
-0.39 |
n.v. |
n.v. |
|
lysophospholipid acyltransferase 5 |
| 46402175 |
|
Lpcat4 |
|
0 |
0 |
196 |
0 |
0 |
|
n.v. |
n.v. |
-0.31 |
n.v. |
n.v. |
|
lysophospholipid acyltransferase LPCAT4 |
| 198386326 |
|
Lpgat1 |
|
714 |
0 |
0 |
0 |
0 |
|
0.14 |
n.v. |
n.v. |
n.v. |
n.v. |
|
acyl-CoA:lysophosphatidylglycerol acyltransferase 1
isoform 1 |
| 26986567 |
|
Lpgat1 |
|
714 |
10 |
0 |
0 |
0 |
|
0.14 |
-0.36 |
n.v. |
n.v. |
n.v. |
|
acyl-CoA:lysophosphatidylglycerol acyltransferase 1
isoform 2 |
| 124486821 |
|
Lphn2 |
|
0 |
361 |
1068 |
0 |
0 |
|
n.v. |
0.2 |
-0.21 |
n.v. |
n.v. |
|
latrophilin-2 precursor |
| 225543157 |
|
Lpp |
|
0 |
0 |
0 |
0 |
43202 |
|
n.v. |
n.v. |
n.v. |
n.v. |
0.05 |
|
lipoma-preferred partner homolog isoform 1 |
| 225543168 |
|
Lpp |
|
0 |
0 |
0 |
0 |
37869 |
|
n.v. |
n.v. |
n.v. |
n.v. |
0.02 |
|
lipoma-preferred partner homolog isoform 2 |
| 117956395 |
|
Lrba |
|
6645 |
33805 |
57519 |
406119 |
548477 |
|
0.04 |
0.15 |
0.02 |
0.1 |
0.02 |
|
lipopolysaccharide-responsive and beige-like anchor
protein isoform gamma |
| 117956397 |
|
Lrba |
|
10251 |
35586 |
65647 |
471701 |
649992 |
|
0.03 |
0.14 |
0.01 |
0.09 |
0.02 |
|
lipopolysaccharide-responsive and beige-like anchor
protein isoform beta |
| 117956399 |
|
Lrba |
|
10251 |
36375 |
68511 |
481221 |
744086 |
|
0.03 |
0.15 |
0.01 |
0.09 |
0.01 |
|
lipopolysaccharide-responsive and beige-like anchor
protein isoform alpha |
| 356460937 |
|
Lrch1 |
|
0 |
0 |
104 |
0 |
0 |
|
n.v. |
n.v. |
0.61 |
n.v. |
n.v. |
|
leucine-rich repeat and calponin homology
domain-containing protein 1 isoform 2 |
| 90991704 |
|
Lrch1 |
|
0 |
0 |
104 |
0 |
0 |
|
n.v. |
n.v. |
0.61 |
n.v. |
n.v. |
|
leucine-rich repeat and calponin homology
domain-containing protein 1 isoform 1 |
| 22122701 |
|
Lrch4 |
|
0 |
0 |
9 |
0 |
0 |
|
n.v. |
n.v. |
0.43 |
n.v. |
n.v. |
|
leucine-rich repeat and calponin homology
domain-containing protein 4 isoform 1 |
| 274325486 |
|
Lrch4 |
|
0 |
0 |
9 |
0 |
0 |
|
n.v. |
n.v. |
0.43 |
n.v. |
n.v. |
|
leucine-rich repeat and calponin homology
domain-containing protein 4 isoform 2 |
| 254588006 |
|
Lrguk |
|
0 |
0 |
560 |
17263 |
0 |
|
n.v. |
n.v. |
-0.02 |
0.15 |
n.v. |
|
leucine-rich repeat and guanylate kinase
domain-containing protein |
| 124494256 |
|
Lrp1 |
|
0 |
2165 |
8565 |
4813 |
0 |
|
n.v. |
0.03 |
0.07 |
-0.07 |
n.v. |
|
prolow-density lipoprotein receptor-related protein 1
precursor |
| 153792247 |
|
Lrp1b |
|
0 |
0 |
126 |
0 |
0 |
|
n.v. |
n.v. |
-0.19 |
n.v. |
n.v. |
|
low-density lipoprotein receptor-related protein 1B
precursor |
| 124487372 |
|
Lrp2 |
|
0 |
17049 |
52358 |
12450 |
0 |
|
n.v. |
-0.18 |
-0.28 |
-0.93 |
n.v. |
|
low-density lipoprotein receptor-related protein 2
precursor |
| 148727327 |
|
Lrp6 |
|
0 |
0 |
912 |
0 |
0 |
|
n.v. |
n.v. |
-3.05 |
n.v. |
n.v. |
|
low-density lipoprotein receptor-related protein 6
precursor |
| 63999380 |
|
Lrpap1 |
|
8183 |
2459 |
1414 |
0 |
750 |
|
-0.03 |
-0.07 |
-0.14 |
n.v. |
-0.31 |
|
alpha-2-macroglobulin receptor-associated protein
precursor |
| 134031976 |
|
Lrpprc |
|
134879 |
60365 |
165 |
0 |
2517 |
|
0 |
-0.16 |
-0.4 |
n.v. |
-0.56 |
|
leucine-rich PPR motif-containing protein, mitochondrial
precursor |
| 225690585 |
|
Lrrc1 |
|
8586 |
4718 |
12071 |
0 |
0 |
|
0.07 |
0.04 |
-0.07 |
n.v. |
n.v. |
|
leucine-rich repeat-containing protein 1 isoform 2 |
| 225690587 |
|
Lrrc1 |
|
8586 |
6897 |
13874 |
0 |
0 |
|
0.07 |
0.04 |
-0.08 |
n.v. |
n.v. |
|
leucine-rich repeat-containing protein 1 isoform 1 |
| 21703932 |
|
Lrrc14 |
|
604 |
0 |
0 |
0 |
0 |
|
-0.08 |
n.v. |
n.v. |
n.v. |
n.v. |
|
leucine-rich repeat-containing protein 14 |
| 154146185 |
|
Lrrc16a |
|
110 |
5476 |
20364 |
23051 |
4305 |
|
0.61 |
0.2 |
0.14 |
0.03 |
-0.1 |
|
leucine-rich repeat-containing protein 16A |
| 23956308 |
|
Lrrc20 |
|
0 |
159 |
679 |
0 |
16760 |
|
n.v. |
0.33 |
0.3 |
n.v. |
0.34 |
|
leucine-rich repeat-containing protein 20 |
| 31541911 |
|
Lrrc40 |
|
201 |
2737 |
3407 |
10911 |
1446 |
|
0.42 |
0 |
0.01 |
-0.02 |
-0.42 |
|
leucine-rich repeat-containing protein 40 |
| 41152116 |
|
Lrrc47 |
|
0 |
3361 |
5365 |
112903 |
675 |
|
n.v. |
0.24 |
0.07 |
-0.02 |
-0.02 |
|
leucine-rich repeat-containing protein 47 |
| 227430395 |
|
Lrrc57 |
|
0 |
3478 |
1472 |
859 |
0 |
|
n.v. |
0.07 |
-0.14 |
-0.14 |
n.v. |
|
leucine-rich repeat-containing protein 57 isoform b |
| 227430397 |
|
Lrrc57 |
|
0 |
3478 |
1472 |
859 |
0 |
|
n.v. |
0.07 |
-0.14 |
-0.14 |
n.v. |
|
leucine-rich repeat-containing protein 57 isoform a |
| 31981233 |
|
Lrrc57 |
|
0 |
3478 |
1472 |
859 |
0 |
|
n.v. |
0.07 |
-0.14 |
-0.14 |
n.v. |
|
leucine-rich repeat-containing protein 57 isoform c |
| 110347495 |
|
Lrrc58 |
|
0 |
0 |
136 |
1236 |
11170 |
|
n.v. |
n.v. |
0.01 |
0.13 |
0.23 |
|
leucine-rich repeat-containing protein 58 |
| 19527026 |
|
Lrrc59 |
|
60758 |
23326 |
6763 |
0 |
0 |
|
0.07 |
-0.2 |
-0.31 |
n.v. |
n.v. |
|
leucine-rich repeat-containing protein 59 |
| 267844854 |
|
Lrrc63 |
|
4503 |
524 |
17863 |
0 |
0 |
|
-0.03 |
0.32 |
0.19 |
n.v. |
n.v. |
|
leucine-rich repeat-containing protein 63 |
| 124486885 |
|
Lrrc7 |
|
0 |
0 |
70 |
0 |
0 |
|
n.v. |
n.v. |
0.38 |
n.v. |
n.v. |
|
leucine-rich repeat-containing protein 7 |
| 29244192 |
|
Lrrc8a |
|
0 |
0 |
218 |
0 |
0 |
|
n.v. |
n.v. |
0.21 |
n.v. |
n.v. |
|
leucine-rich repeat-containing protein 8A |
| 254675306 |
|
Lrrcc1 |
|
0 |
0 |
72 |
0 |
0 |
|
n.v. |
n.v. |
-0.93 |
n.v. |
n.v. |
|
leucine-rich repeat and coiled-coil domain-containing
protein 1 isoform 3 |
| 254675308 |
|
Lrrcc1 |
|
0 |
0 |
72 |
0 |
0 |
|
n.v. |
n.v. |
-0.93 |
n.v. |
n.v. |
|
leucine-rich repeat and coiled-coil domain-containing
protein 1 isoform 1 |
| 254675310 |
|
Lrrcc1 |
|
0 |
0 |
72 |
0 |
0 |
|
n.v. |
n.v. |
-0.93 |
n.v. |
n.v. |
|
leucine-rich repeat and coiled-coil domain-containing
protein 1 isoform 2 |
| 162417949 |
|
Lrrfip1 |
|
0 |
1311 |
18360 |
67826 |
38886 |
|
n.v. |
0.26 |
0.22 |
0.1 |
-0.17 |
|
leucine-rich repeat flightless-interacting protein 1
isoform 1 |
| 162417952 |
|
Lrrfip1 |
|
0 |
620 |
10379 |
23812 |
16867 |
|
n.v. |
0.29 |
0.21 |
0.13 |
-0.22 |
|
leucine-rich repeat flightless-interacting protein 1
isoform 3 |
| 6678722 |
|
Lrrfip1 |
|
0 |
620 |
12934 |
29738 |
18195 |
|
n.v. |
0.29 |
0.21 |
0.13 |
-0.19 |
|
leucine-rich repeat flightless-interacting protein 1
isoform 2 |
| 110625827 |
|
Lrrfip2 |
|
0 |
299 |
6115 |
16731 |
9103 |
|
n.v. |
-0.32 |
0.14 |
0.11 |
-0.16 |
|
leucine-rich repeat flightless-interacting protein 2
isoform 2 |
| 258679524 |
|
Lrrfip2 |
|
0 |
299 |
6115 |
16731 |
9103 |
|
n.v. |
-0.32 |
0.14 |
0.11 |
-0.16 |
|
leucine-rich repeat flightless-interacting protein 2
isoform 1 |
| 56699427 |
|
Lrrk1 |
|
0 |
71 |
18 |
0 |
0 |
|
n.v. |
-0.56 |
0.1 |
n.v. |
n.v. |
|
leucine-rich repeat serine/threonine-protein kinase
1 |
| 146231954 |
|
Lrrk2 |
|
33244 |
628 |
0 |
0 |
0 |
|
0.17 |
-0.24 |
n.v. |
n.v. |
n.v. |
|
leucine-rich repeat serine/threonine-protein kinase
2 |
| 110625667 |
|
Lsm1 |
|
0 |
0 |
0 |
2145 |
0 |
|
n.v. |
n.v. |
n.v. |
0.13 |
n.v. |
|
U6 snRNA-associated Sm-like protein LSm1 |
| 20270251 |
|
Lsm10 |
|
0 |
0 |
111 |
614 |
75 |
|
n.v. |
n.v. |
0.13 |
0.09 |
0.85 |
|
U7 snRNA-associated Sm-like protein LSm10 |
| 31711990 |
|
Lsm12 |
|
0 |
1787 |
6777 |
6696 |
15486 |
|
n.v. |
-0.01 |
0.27 |
-0.24 |
-0.28 |
|
protein LSM12 homolog |
| 23956156 |
|
Lsm14a |
|
0 |
0 |
499 |
458 |
0 |
|
n.v. |
n.v. |
0.22 |
0.61 |
n.v. |
|
protein LSM14 homolog A |
| 148839333 |
|
Lsm14b |
|
0 |
0 |
822 |
0 |
0 |
|
n.v. |
n.v. |
0.15 |
n.v. |
n.v. |
|
protein LSM14 homolog B |
| 324021707 |
|
Lsm2 |
|
0 |
0 |
16 |
0 |
0 |
|
n.v. |
n.v. |
0.59 |
n.v. |
n.v. |
|
U6 snRNA-associated Sm-like protein LSm2 isoform 3 |
| 13994221 |
|
Lsm2 |
|
13931 |
589 |
1324 |
2210 |
107 |
|
-0.11 |
-0.21 |
0 |
-0.07 |
0.48 |
|
U6 snRNA-associated Sm-like protein LSm2 isoform 1 |
| 158533995 |
|
Lsm2 |
|
13931 |
589 |
1324 |
2210 |
107 |
|
-0.11 |
-0.21 |
0 |
-0.07 |
0.48 |
|
U6 snRNA-associated Sm-like protein LSm2 isoform 2 |
| 324021709 |
|
Lsm2 |
|
13235 |
589 |
658 |
2210 |
107 |
|
-0.16 |
-0.21 |
-0.18 |
-0.07 |
0.48 |
|
U6 snRNA-associated Sm-like protein LSm2 isoform 4 |
| 13385806 |
|
Lsm3 |
|
3625 |
875 |
550 |
31416 |
9092 |
|
-0.02 |
0.1 |
0.02 |
0.01 |
-0.18 |
|
U6 snRNA-associated Sm-like protein LSm3 |
| 159032056 |
|
Lsm4 |
|
879 |
2252 |
3172 |
23763 |
25199 |
|
0.05 |
0.12 |
0 |
-0.04 |
-0.03 |
|
U6 snRNA-associated Sm-like protein LSm4 |
| 113865835 |
|
Lsm6 |
|
0 |
925 |
0 |
0 |
0 |
|
n.v. |
-0.03 |
n.v. |
n.v. |
n.v. |
|
U6 snRNA-associated Sm-like protein LSm6 |
| 300797601;113865835 |
|
Lsm6 |
|
4998 |
0 |
3481 |
0 |
0 |
|
-0.04 |
n.v. |
-0.03 |
n.v. |
n.v. |
|
U6 snRNA-associated Sm-like protein LSm6 |
| 13384714 |
|
Lsm7 |
|
0 |
0 |
0 |
19179 |
14897 |
|
n.v. |
n.v. |
n.v. |
-0.01 |
-0.06 |
|
U6 snRNA-associated Sm-like protein LSm7 |
| 58037525 |
|
Lsmd1 |
|
0 |
0 |
294 |
33 |
0 |
|
n.v. |
n.v. |
0.1 |
0.31 |
n.v. |
|
LSM domain-containing protein 1 |
| 255958261 |
|
Lsr |
|
0 |
2 |
171 |
0 |
0 |
|
n.v. |
0.25 |
0.19 |
n.v. |
n.v. |
|
lipolysis-stimulated lipoprotein receptor isoform 2
precursor |
| 255958263 |
|
Lsr |
|
0 |
2 |
171 |
0 |
0 |
|
n.v. |
0.25 |
0.19 |
n.v. |
n.v. |
|
lipolysis-stimulated lipoprotein receptor isoform 3
precursor |
| 30794490 |
|
Lsr |
|
0 |
2 |
171 |
0 |
0 |
|
n.v. |
0.25 |
0.19 |
n.v. |
n.v. |
|
lipolysis-stimulated lipoprotein receptor isoform 1
precursor |
| 22122469 |
|
Lss |
|
3332 |
13897 |
6420 |
622 |
0 |
|
0.27 |
-0.23 |
-0.14 |
-0.11 |
n.v. |
|
lanosterol synthase |
| 116734870 |
|
Lta4h |
|
0 |
4958 |
13299 |
3078 |
78704 |
|
n.v. |
0.19 |
-0.01 |
0.38 |
0.07 |
|
leukotriene A-4 hydrolase |
| 124486727 |
|
Ltn1 |
|
0 |
0 |
184 |
10085 |
1039 |
|
n.v. |
n.v. |
-0.04 |
0.05 |
0.17 |
|
E3 ubiquitin-protein ligase listerin |
| 31324539 |
|
Ltv1 |
|
0 |
0 |
0 |
1965 |
0 |
|
n.v. |
n.v. |
n.v. |
-0.24 |
n.v. |
|
protein LTV1 homolog |
| 114158677 |
|
Luc7l |
|
0 |
810 |
746 |
4273 |
5344 |
|
n.v. |
-0.06 |
-0.15 |
-0.08 |
-0.17 |
|
putative RNA-binding protein Luc7-like 1 isoform 2 |
| 21536228 |
|
Luc7l |
|
0 |
810 |
746 |
4273 |
5344 |
|
n.v. |
-0.06 |
-0.15 |
-0.08 |
-0.17 |
|
putative RNA-binding protein Luc7-like 1 isoform 1 |
| 283806681 |
|
Luc7l2 |
|
0 |
2657 |
2530 |
6344 |
19266 |
|
n.v. |
-0.16 |
-0.12 |
0.06 |
-0.05 |
|
putative RNA-binding protein Luc7-like 2 isoform 1 |
| 283806683 |
|
Luc7l2 |
|
0 |
2657 |
2530 |
6344 |
19266 |
|
n.v. |
-0.16 |
-0.12 |
0.06 |
-0.05 |
|
putative RNA-binding protein Luc7-like 2 isoform 2 |
| 283806685 |
|
Luc7l2 |
|
0 |
2570 |
2530 |
6344 |
19266 |
|
n.v. |
-0.12 |
-0.12 |
0.06 |
-0.05 |
|
putative RNA-binding protein Luc7-like 2 isoform 3 |
| 23956166 |
|
Luc7l3 |
|
11844 |
1369 |
935 |
6696 |
1007 |
|
0.22 |
-0.3 |
-0.34 |
-0.37 |
-0.06 |
|
luc7-like protein 3 |
| 119433663 |
|
Luzp1 |
|
0 |
2 |
37 |
106 |
64 |
|
n.v. |
-0.02 |
-0.08 |
0.18 |
0.05 |
|
leucine zipper protein 1 |
| 31980632 |
|
Lxn |
|
2032 |
5286 |
5883 |
303 |
35245 |
|
0.82 |
0.18 |
-0.11 |
0.33 |
0.12 |
|
latexin |
| 255708401 |
|
Ly6e |
|
0 |
747 |
116 |
0 |
0 |
|
n.v. |
-0.24 |
-0.35 |
n.v. |
n.v. |
|
lymphocyte antigen 6E precursor |
| 148747179 |
|
Ly75 |
|
0 |
84 |
534 |
0 |
0 |
|
n.v. |
0.43 |
0.02 |
n.v. |
n.v. |
|
lymphocyte antigen 75 precursor |
| 188219567 |
|
Lyar |
|
0 |
299 |
4427 |
10821 |
0 |
|
n.v. |
-0.17 |
-0.34 |
-0.48 |
n.v. |
|
cell growth-regulating nucleolar protein |
| 161760634 |
|
Lyn |
|
2691 |
4169 |
3879 |
6025 |
34420 |
|
0.15 |
0.11 |
-0.03 |
0.09 |
0.29 |
|
tyrosine-protein kinase Lyn isoform B |
| 161760636 |
|
Lyn |
|
2691 |
4169 |
3879 |
6025 |
34420 |
|
0.15 |
0.11 |
-0.03 |
0.09 |
0.29 |
|
tyrosine-protein kinase Lyn isoform A |
| 6678760 |
|
Lypla1 |
|
1336 |
3670 |
2568 |
417 |
38179 |
|
-0.12 |
0 |
-0.02 |
0.25 |
0.04 |
|
acyl-protein thioesterase 1 |
| 7242156 |
|
Lypla2 |
|
0 |
0 |
25 |
0 |
7432 |
|
n.v. |
n.v. |
0.09 |
n.v. |
0.06 |
|
acyl-protein thioesterase 2 |
| 227496223 |
|
Lyplal1 |
|
0 |
2305 |
48 |
0 |
2110 |
|
n.v. |
-0.18 |
-0.29 |
n.v. |
0.1 |
|
lysophospholipase-like protein 1 |
| 41235733 |
|
Lyrm4 |
|
2215 |
3691 |
0 |
0 |
0 |
|
0.06 |
-0.05 |
n.v. |
n.v. |
n.v. |
|
LYR motif-containing protein 4 |
| 19526856 |
|
Lyrm5 |
|
18 |
0 |
0 |
0 |
0 |
|
-0.06 |
n.v. |
n.v. |
n.v. |
n.v. |
|
LYR motif-containing protein 5 |
| 111955376 |
|
Lyst |
|
0 |
0 |
20 |
262 |
0 |
|
n.v. |
n.v. |
-0.75 |
0.24 |
n.v. |
|
lysosomal-trafficking regulator |
| 27229082 |
|
Lzic |
|
0 |
232 |
370 |
0 |
7797 |
|
n.v. |
0.2 |
0.06 |
n.v. |
0.16 |
|
protein LZIC |
| 15277319 |
|
Lztfl1 |
|
0 |
806 |
154 |
0 |
33574 |
|
n.v. |
-0.89 |
0.24 |
n.v. |
0.03 |
|
leucine zipper transcription factor-like protein 1 |
| 27229001 |
|
Lztr1 |
|
0 |
0 |
29 |
319 |
203 |
|
n.v. |
n.v. |
0.31 |
0.12 |
-0.18 |
|
leucine-zipper-like transcriptional regulator 1 |
| 14916479 |
|
M6pr |
|
10526 |
9795 |
23833 |
17640 |
0 |
|
-0.82 |
-0.18 |
0.08 |
0.06 |
n.v. |
|
cation-dependent mannose-6-phosphate receptor precursor |
| 253314482 |
|
Macc1 |
|
0 |
324 |
124 |
0 |
0 |
|
n.v. |
-0.15 |
0.06 |
n.v. |
n.v. |
|
metastasis associated in colon cancer 1 |
| 312433955 |
|
Macf1 |
|
0 |
2181 |
18177 |
40731 |
79229 |
|
n.v. |
0.23 |
0.12 |
0.23 |
-0.04 |
|
microtubule-actin cross-linking factor 1 isoform 1 |
| 312433957 |
|
Macf1 |
|
0 |
2181 |
18177 |
40731 |
78683 |
|
n.v. |
0.23 |
0.12 |
0.23 |
-0.02 |
|
microtubule-actin cross-linking factor 1 isoform 2 |
| 170650601 |
|
Macrod1 |
|
0 |
3417 |
154 |
0 |
4552 |
|
n.v. |
-0.26 |
-0.17 |
n.v. |
0.11 |
|
O-acetyl-ADP-ribose deacetylase MACROD1 |
| 88014564 |
|
Mad1l1 |
|
0 |
0 |
0 |
0 |
910 |
|
n.v. |
n.v. |
n.v. |
n.v. |
-0.05 |
|
mitotic spindle assembly checkpoint protein MAD1 |
| 31543218 |
|
Mad2l1 |
|
348 |
572 |
199 |
0 |
1210 |
|
-0.42 |
0.27 |
0.13 |
n.v. |
-0.26 |
|
mitotic spindle assembly checkpoint protein MAD2A |
| 120407043 |
|
Maea |
|
0 |
0 |
0 |
1465 |
246 |
|
n.v. |
n.v. |
n.v. |
0.33 |
-0.04 |
|
macrophage erythroblast attacher |
| 148238102 |
|
Magea10 |
|
0 |
0 |
0 |
1203 |
0 |
|
n.v. |
n.v. |
n.v. |
0 |
n.v. |
|
melanoma-associated antigen 10 |
| 9789935 |
|
Maged1 |
|
0 |
0 |
0 |
0 |
32 |
|
n.v. |
n.v. |
n.v. |
n.v. |
-0.52 |
|
melanoma-associated antigen D1 |
| 407262474 |
|
Maged2 |
|
0 |
23 |
0 |
0 |
0 |
|
n.v. |
-0.28 |
n.v. |
n.v. |
n.v. |
|
PREDICTED: melanoma-associated antigen D2 |
| 13507638 |
|
Maged2 |
|
0 |
23 |
0 |
0 |
257 |
|
n.v. |
-0.28 |
n.v. |
n.v. |
0.39 |
|
melanoma-associated antigen D2 |
| 134031962 |
|
Magi1 |
|
0 |
0 |
28 |
0 |
0 |
|
n.v. |
n.v. |
-0.02 |
n.v. |
n.v. |
|
membrane-associated guanylate kinase, WW and PDZ
domain-containing protein 1 isoform d |
| 134031999 |
|
Magi1 |
|
0 |
0 |
28 |
0 |
0 |
|
n.v. |
n.v. |
-0.02 |
n.v. |
n.v. |
|
membrane-associated guanylate kinase, WW and PDZ
domain-containing protein 1 isoform b |
| 34328051 |
|
Magi1 |
|
0 |
0 |
28 |
0 |
0 |
|
n.v. |
n.v. |
-0.02 |
n.v. |
n.v. |
|
membrane-associated guanylate kinase, WW and PDZ
domain-containing protein 1 isoform a |
| 71533173 |
|
Magi1 |
|
0 |
0 |
28 |
0 |
0 |
|
n.v. |
n.v. |
-0.02 |
n.v. |
n.v. |
|
membrane-associated guanylate kinase, WW and PDZ
domain-containing protein 1 isoform c |
| 19527074 |
|
Magi3 |
|
0 |
0 |
0 |
147 |
589 |
|
n.v. |
n.v. |
n.v. |
0.5 |
0.08 |
|
membrane-associated guanylate kinase, WW and PDZ
domain-containing protein 3 isoform 2 |
| 226823238 |
|
Magi3 |
|
0 |
0 |
0 |
147 |
589 |
|
n.v. |
n.v. |
n.v. |
0.5 |
0.08 |
|
membrane-associated guanylate kinase, WW and PDZ
domain-containing protein 3 isoform 1 |
| 6754616 |
|
Magoh |
|
65114 |
1484 |
6559 |
3888 |
5655 |
|
-0.14 |
0.1 |
0.01 |
0.2 |
0.22 |
|
protein mago nashi homolog |
| 256985211 |
|
Magohb |
|
65114 |
1484 |
6559 |
3880 |
5655 |
|
-0.14 |
0.1 |
0.01 |
0.2 |
0.22 |
|
protein mago nashi homolog 2 |
| 298676496 |
|
Magt1 |
|
0 |
758 |
560 |
0 |
0 |
|
n.v. |
-0.67 |
-0.36 |
n.v. |
n.v. |
|
magnesium transporter protein 1 |
| 224809525 |
|
Mak |
|
0 |
2261 |
3440 |
4330 |
34420 |
|
n.v. |
0.15 |
-0.03 |
0.42 |
0.29 |
|
serine/threonine-protein kinase MAK isoform 2 |
| 224809542 |
|
Mak |
|
0 |
2261 |
3440 |
4330 |
34420 |
|
n.v. |
0.15 |
-0.03 |
0.42 |
0.29 |
|
serine/threonine-protein kinase MAK isoform 3 |
| 224809552 |
|
Mak |
|
0 |
2261 |
3440 |
4330 |
34420 |
|
n.v. |
0.15 |
-0.03 |
0.42 |
0.29 |
|
serine/threonine-protein kinase MAK isoform 1 |
| 30725780 |
|
Mal2 |
|
673130 |
52125 |
83307 |
90966 |
0 |
|
0 |
0 |
-0.17 |
-0.85 |
n.v. |
|
protein MAL2 |
| 254939620 |
|
Malsu1 |
|
0 |
163 |
0 |
0 |
0 |
|
n.v. |
-0.05 |
n.v. |
n.v. |
n.v. |
|
mitochondrial assembly of ribosomal large subunit protein
1 |
| 6754620 |
|
Man1a2 |
|
0 |
234 |
0 |
0 |
0 |
|
n.v. |
-0.34 |
n.v. |
n.v. |
n.v. |
|
mannosyl-oligosaccharide 1,2-alpha-mannosidase IB |
| 71534295 |
|
Man1b1 |
|
0 |
84 |
0 |
0 |
0 |
|
n.v. |
-0.48 |
n.v. |
n.v. |
n.v. |
|
endoplasmic reticulum mannosyl-oligosaccharide
1,2-alpha-mannosidase |
| 226246610 |
|
Man2a1 |
|
0 |
1789 |
34 |
0 |
0 |
|
n.v. |
-0.23 |
-0.53 |
n.v. |
n.v. |
|
alpha-mannosidase 2 |
| 113195690 |
|
Man2b1 |
|
0 |
3271 |
1535 |
3823 |
3384 |
|
n.v. |
0.06 |
-0.26 |
0.13 |
-0.14 |
|
lysosomal alpha-mannosidase precursor |
| 227330625 |
|
Man2b2 |
|
2526 |
6918 |
1346 |
319 |
6469 |
|
0.13 |
-0.07 |
-0.31 |
1.48 |
-0.29 |
|
epididymis-specific alpha-mannosidase precursor |
| 30794150 |
|
Man2c1 |
|
604 |
0 |
325 |
20087 |
3727 |
|
-0.08 |
n.v. |
0.3 |
0.16 |
-0.11 |
|
alpha-mannosidase 2C1 |
| 158533990 |
|
Manba |
|
51806 |
6413 |
15014 |
6254 |
23218 |
|
0.13 |
-0.04 |
-0.24 |
-0.11 |
-0.13 |
|
beta-mannosidase precursor |
| 254540070 |
|
Manbal |
|
1336 |
0 |
10 |
0 |
0 |
|
0 |
n.v. |
-0.5 |
n.v. |
n.v. |
|
protein MANBAL |
| 110625813 |
|
Manf |
|
275 |
2292 |
331 |
0 |
2934 |
|
-0.13 |
0.18 |
0.15 |
n.v. |
-0.27 |
|
mesencephalic astrocyte-derived neurotrophic factor
precursor |
| 255759902 |
|
Maoa |
|
0 |
4567 |
1084 |
0 |
0 |
|
n.v. |
0.06 |
-0.29 |
n.v. |
n.v. |
|
amine oxidase [flavin-containing] A |
| 124244033 |
|
Map1a |
|
0 |
0 |
190 |
1310 |
0 |
|
n.v. |
n.v. |
0.15 |
0.2 |
n.v. |
|
microtubule-associated protein 1A isoform 1 |
| 291045426 |
|
Map1a |
|
0 |
0 |
190 |
1310 |
0 |
|
n.v. |
n.v. |
0.15 |
0.2 |
n.v. |
|
microtubule-associated protein 1A isoform 2 |
| 171543853 |
|
Map1b |
|
0 |
77 |
686 |
1825 |
236 |
|
n.v. |
0.74 |
0.16 |
0.41 |
0.45 |
|
microtubule-associated protein 1B |
| 23956148 |
|
Map1lc3a |
|
0 |
0 |
0 |
0 |
11631 |
|
n.v. |
n.v. |
n.v. |
n.v. |
0.22 |
|
microtubule-associated proteins 1A/1B light chain 3A |
| 13385664 |
|
Map1lc3b |
|
0 |
0 |
0 |
417 |
11631 |
|
n.v. |
n.v. |
n.v. |
-0.98 |
0.22 |
|
microtubule-associated proteins 1A/1B light chain 3B |
| 162287131 |
|
Map1s |
|
0 |
0 |
180 |
3667 |
0 |
|
n.v. |
n.v. |
0.12 |
0.32 |
n.v. |
|
microtubule-associated protein 1S |
| 68341935 |
|
Map2 |
|
0 |
0 |
647 |
4175 |
0 |
|
n.v. |
n.v. |
0.55 |
0.15 |
n.v. |
|
microtubule-associated protein 2 isoform 2 |
| 90186270 |
|
Map2 |
|
0 |
0 |
647 |
4175 |
0 |
|
n.v. |
n.v. |
0.55 |
0.15 |
n.v. |
|
microtubule-associated protein 2 isoform 1 |
| 6678794 |
|
Map2k1 |
|
0 |
2643 |
5076 |
8333 |
74035 |
|
n.v. |
0.39 |
0.13 |
-0.02 |
0.22 |
|
dual specificity mitogen-activated protein kinase kinase
1 |
| 31560267 |
|
Map2k2 |
|
0 |
4390 |
4255 |
2595 |
76241 |
|
n.v. |
0.31 |
-0.06 |
-0.02 |
0.23 |
|
dual specificity mitogen-activated protein kinase kinase
2 |
| 22094081 |
|
Map2k3 |
|
0 |
19 |
40 |
1244 |
1681 |
|
n.v. |
0.13 |
-0.98 |
0.06 |
0.11 |
|
dual specificity mitogen-activated protein kinase kinase
3 |
| 22095023 |
|
Map2k4 |
|
0 |
278 |
0 |
311 |
18260 |
|
n.v. |
-0.18 |
n.v. |
-0.42 |
-0.02 |
|
dual specificity mitogen-activated protein kinase kinase
4 |
| 110347549 |
|
Map2k7 |
|
0 |
6 |
0 |
0 |
0 |
|
n.v. |
1.1 |
n.v. |
n.v. |
n.v. |
|
dual specificity mitogen-activated protein kinase kinase
7 isoform 1 |
| 110347551 |
|
Map2k7 |
|
0 |
6 |
0 |
0 |
0 |
|
n.v. |
1.1 |
n.v. |
n.v. |
n.v. |
|
dual specificity mitogen-activated protein kinase kinase
7 isoform 2 |
| 255918231 |
|
Map2k7 |
|
0 |
6 |
0 |
0 |
0 |
|
n.v. |
1.1 |
n.v. |
n.v. |
n.v. |
|
dual specificity mitogen-activated protein kinase kinase
7 isoform 3 |
| 124486847 |
|
Map3k10 |
|
0 |
0 |
1351 |
0 |
0 |
|
n.v. |
n.v. |
0.01 |
n.v. |
n.v. |
|
mitogen-activated protein kinase kinase kinase 10 |
| 31543234 |
|
Map3k11 |
|
0 |
0 |
1351 |
0 |
0 |
|
n.v. |
n.v. |
0.01 |
n.v. |
n.v. |
|
mitogen-activated protein kinase kinase kinase 11 |
| 8393835 |
|
Map3k14 |
|
0 |
2 |
0 |
0 |
0 |
|
n.v. |
0.35 |
n.v. |
n.v. |
n.v. |
|
mitogen-activated protein kinase kinase kinase 14 |
| 282847404 |
|
Map3k15 |
|
0 |
0 |
0 |
467 |
0 |
|
n.v. |
n.v. |
n.v. |
0.7 |
n.v. |
|
mitogen-activated protein kinase kinase kinase 15 |
| 89257354 |
|
Map3k2 |
|
0 |
0 |
0 |
0 |
600 |
|
n.v. |
n.v. |
n.v. |
n.v. |
0.33 |
|
mitogen-activated protein kinase kinase kinase 2 |
| 33468949 |
|
Map3k3 |
|
0 |
0 |
887 |
0 |
4980 |
|
n.v. |
n.v. |
0.63 |
n.v. |
0.48 |
|
mitogen-activated protein kinase kinase kinase 3 |
| 93102421 |
|
Map3k4 |
|
0 |
0 |
0 |
41 |
0 |
|
n.v. |
n.v. |
n.v. |
0.39 |
n.v. |
|
mitogen-activated protein kinase kinase kinase 4 |
| 171846249 |
|
Map3k5 |
|
0 |
61 |
439 |
6016 |
0 |
|
n.v. |
-0.65 |
-0.21 |
0.2 |
n.v. |
|
mitogen-activated protein kinase kinase kinase 5 |
| 291575174 |
|
Map3k9 |
|
0 |
0 |
1351 |
0 |
0 |
|
n.v. |
n.v. |
0.01 |
n.v. |
n.v. |
|
mitogen-activated protein kinase kinase kinase 9 isoform
1 |
| 52421792 |
|
Map3k9 |
|
0 |
0 |
1351 |
0 |
0 |
|
n.v. |
n.v. |
0.01 |
n.v. |
n.v. |
|
mitogen-activated protein kinase kinase kinase 9 isoform
2 |
| 328927080 |
|
Map4 |
|
0 |
0 |
189 |
0 |
7122 |
|
n.v. |
n.v. |
0.42 |
n.v. |
0 |
|
microtubule-associated protein 4 isoform 3 |
| 328927083 |
|
Map4 |
|
0 |
296 |
13145 |
37015 |
71946 |
|
n.v. |
0.5 |
0.14 |
0.22 |
-0.03 |
|
microtubule-associated protein 4 isoform 4 |
| 148747189 |
|
Map4 |
|
330 |
296 |
13584 |
37015 |
71946 |
|
0.51 |
0.5 |
0.21 |
0.22 |
-0.03 |
|
microtubule-associated protein 4 isoform 2 |
| 328927075 |
|
Map4 |
|
330 |
296 |
13584 |
37187 |
71946 |
|
0.51 |
0.5 |
0.21 |
0.22 |
-0.03 |
|
microtubule-associated protein 4 isoform 1 |
| 6678800 |
|
Map4k2 |
|
0 |
0 |
151 |
311 |
664 |
|
n.v. |
n.v. |
0.4 |
0.88 |
0.94 |
|
mitogen-activated protein kinase kinase kinase kinase
2 |
| 124486875 |
|
Map4k3 |
|
0 |
0 |
0 |
25 |
0 |
|
n.v. |
n.v. |
n.v. |
0.19 |
n.v. |
|
mitogen-activated protein kinase kinase kinase kinase
3 |
| 145279237 |
|
Map4k4 |
|
0 |
0 |
247 |
0 |
0 |
|
n.v. |
n.v. |
0.21 |
n.v. |
n.v. |
|
mitogen-activated protein kinase kinase kinase kinase 4
isoform 2 |
| 356582264 |
|
Map4k4 |
|
0 |
0 |
247 |
0 |
0 |
|
n.v. |
n.v. |
0.21 |
n.v. |
n.v. |
|
mitogen-activated protein kinase kinase kinase kinase 4
isoform 1 |
| 356582266 |
|
Map4k4 |
|
0 |
0 |
247 |
0 |
0 |
|
n.v. |
n.v. |
0.21 |
n.v. |
n.v. |
|
mitogen-activated protein kinase kinase kinase kinase 4
isoform 3 |
| 356582268 |
|
Map4k4 |
|
0 |
0 |
247 |
0 |
0 |
|
n.v. |
n.v. |
0.21 |
n.v. |
n.v. |
|
mitogen-activated protein kinase kinase kinase kinase 4
isoform 4 |
| 77736537 |
|
Map4k5 |
|
0 |
1332 |
2327 |
9315 |
6147 |
|
n.v. |
0.05 |
-0.05 |
-0.18 |
0.77 |
|
mitogen-activated protein kinase kinase kinase kinase
5 |
| 113204613 |
|
Map6 |
|
73 |
0 |
0 |
0 |
86 |
|
1.11 |
n.v. |
n.v. |
n.v. |
-0.08 |
|
microtubule-associated protein 6 isoform 1 |
| 114520592 |
|
Map6 |
|
73 |
0 |
0 |
0 |
86 |
|
1.11 |
n.v. |
n.v. |
n.v. |
-0.08 |
|
microtubule-associated protein 6 isoform 2 |
| 114520594 |
|
Map6 |
|
73 |
0 |
0 |
0 |
86 |
|
1.11 |
n.v. |
n.v. |
n.v. |
-0.08 |
|
microtubule-associated protein 6 isoform 3 |
| 310772196 |
|
Map7 |
|
0 |
0 |
735 |
0 |
0 |
|
n.v. |
n.v. |
0.06 |
n.v. |
n.v. |
|
ensconsin isoform 2 |
| 159110787 |
|
Map7 |
|
0 |
0 |
850 |
524 |
0 |
|
n.v. |
n.v. |
0.08 |
0.79 |
n.v. |
|
ensconsin isoform 1 |
| 225543273 |
|
Map7d1 |
|
0 |
0 |
0 |
98 |
0 |
|
n.v. |
n.v. |
n.v. |
-0.19 |
n.v. |
|
MAP7 domain-containing protein 1 isoform 1 |
| 225543276 |
|
Map7d1 |
|
0 |
0 |
0 |
98 |
0 |
|
n.v. |
n.v. |
n.v. |
-0.19 |
n.v. |
|
MAP7 domain-containing protein 1 isoform 2 |
| 124486997 |
|
Map9 |
|
0 |
0 |
114 |
0 |
0 |
|
n.v. |
n.v. |
0 |
n.v. |
n.v. |
|
microtubule-associated protein 9 |
| 6754632 |
|
Mapk1 |
|
10325 |
2849 |
27181 |
136650 |
302908 |
|
0.04 |
0.19 |
0.02 |
0.17 |
0.08 |
|
mitogen-activated protein kinase 1 |
| 125858479 |
|
Mapk10 |
|
0 |
1937 |
3541 |
9086 |
42806 |
|
n.v. |
0.02 |
-0.01 |
-0.02 |
-0.08 |
|
mitogen-activated protein kinase 10 isoform 2 |
| 125858511 |
|
Mapk10 |
|
0 |
1937 |
3541 |
9086 |
42806 |
|
n.v. |
0.02 |
-0.01 |
-0.02 |
-0.08 |
|
mitogen-activated protein kinase 10 isoform 1 |
| 168693637 |
|
Mapk11 |
|
0 |
1937 |
3541 |
8865 |
42742 |
|
n.v. |
0.02 |
-0.01 |
-0.03 |
-0.07 |
|
mitogen-activated protein kinase 11 |
| 7305253 |
|
Mapk12 |
|
0 |
3369 |
4465 |
8865 |
80932 |
|
n.v. |
0.35 |
0.02 |
-0.03 |
0.01 |
|
mitogen-activated protein kinase 12 |
| 226246627 |
|
Mapk13 |
|
0 |
4246 |
6771 |
12262 |
51888 |
|
n.v. |
0.25 |
0.05 |
-0.03 |
-0.07 |
|
mitogen-activated protein kinase 13 |
| 10092590 |
|
Mapk14 |
|
0 |
1937 |
3546 |
10674 |
84241 |
|
n.v. |
0.02 |
0 |
0.07 |
0.07 |
|
mitogen-activated protein kinase 14 isoform 1 |
| 270341370 |
|
Mapk14 |
|
0 |
1937 |
3546 |
10207 |
78726 |
|
n.v. |
0.02 |
0 |
-0.02 |
0.07 |
|
mitogen-activated protein kinase 14 isoform 2 |
| 270341386 |
|
Mapk14 |
|
0 |
1937 |
3546 |
10674 |
84241 |
|
n.v. |
0.02 |
0 |
0.07 |
0.07 |
|
mitogen-activated protein kinase 14 isoform 3 |
| 29244575 |
|
Mapk15 |
|
0 |
202 |
6785 |
36254 |
73039 |
|
n.v. |
0.05 |
-0.02 |
0.01 |
-0.01 |
|
mitogen-activated protein kinase 15 |
| 21489933 |
|
Mapk3 |
|
9794 |
4622 |
24228 |
118658 |
285226 |
|
-0.06 |
0.12 |
0.06 |
0.17 |
0.13 |
|
mitogen-activated protein kinase 3 |
| 89337268 |
|
Mapk4 |
|
0 |
182 |
1223 |
532 |
1017 |
|
n.v. |
0.18 |
-0.08 |
0.17 |
0.04 |
|
mitogen-activated protein kinase 4 |
| 76573879 |
|
Mapk6 |
|
0 |
182 |
1223 |
532 |
1017 |
|
n.v. |
0.18 |
-0.08 |
0.17 |
0.04 |
|
mitogen-activated protein kinase 6 |
| 6754634 |
|
Mapk7 |
|
0 |
0 |
22 |
0 |
846 |
|
n.v. |
n.v. |
-0.17 |
n.v. |
0.4 |
|
mitogen-activated protein kinase 7 |
| 7710060 |
|
Mapk8 |
|
0 |
1937 |
3541 |
8865 |
42742 |
|
n.v. |
0.02 |
-0.01 |
-0.03 |
-0.07 |
|
mitogen-activated protein kinase 8 |
| 254540192 |
|
Mapk8ip3 |
|
0 |
0 |
0 |
0 |
5783 |
|
n.v. |
n.v. |
n.v. |
n.v. |
0.27 |
|
C-Jun-amino-terminal kinase-interacting protein 3 isoform
a |
| 254540198 |
|
Mapk8ip3 |
|
0 |
0 |
0 |
0 |
5783 |
|
n.v. |
n.v. |
n.v. |
n.v. |
0.27 |
|
C-Jun-amino-terminal kinase-interacting protein 3 isoform
b |
| 254540200 |
|
Mapk8ip3 |
|
0 |
0 |
0 |
0 |
5783 |
|
n.v. |
n.v. |
n.v. |
n.v. |
0.27 |
|
C-Jun-amino-terminal kinase-interacting protein 3 isoform
c |
| 254540202 |
|
Mapk8ip3 |
|
0 |
0 |
0 |
0 |
5783 |
|
n.v. |
n.v. |
n.v. |
n.v. |
0.27 |
|
C-Jun-amino-terminal kinase-interacting protein 3 isoform
d |
| 254540204 |
|
Mapk8ip3 |
|
0 |
0 |
0 |
0 |
5783 |
|
n.v. |
n.v. |
n.v. |
n.v. |
0.27 |
|
C-Jun-amino-terminal kinase-interacting protein 3 isoform
e |
| 254540206 |
|
Mapk8ip3 |
|
0 |
0 |
0 |
0 |
5783 |
|
n.v. |
n.v. |
n.v. |
n.v. |
0.27 |
|
C-Jun-amino-terminal kinase-interacting protein 3 isoform
f |
| 254540212 |
|
Mapk8ip3 |
|
0 |
0 |
0 |
0 |
5783 |
|
n.v. |
n.v. |
n.v. |
n.v. |
0.27 |
|
C-Jun-amino-terminal kinase-interacting protein 3 isoform
g |
| 254750709 |
|
Mapk9 |
|
0 |
1937 |
3541 |
9086 |
43705 |
|
n.v. |
0.02 |
-0.01 |
-0.02 |
-0.07 |
|
mitogen-activated protein kinase 9 isoform alpha2 |
| 254750733 |
|
Mapk9 |
|
0 |
1937 |
3541 |
9086 |
43705 |
|
n.v. |
0.02 |
-0.01 |
-0.02 |
-0.07 |
|
mitogen-activated protein kinase 9 isoform beta2 |
| 254750739 |
|
Mapk9 |
|
0 |
1937 |
3541 |
9086 |
43705 |
|
n.v. |
0.02 |
-0.01 |
-0.02 |
-0.07 |
|
mitogen-activated protein kinase 9 isoform alpha1 |
| 8393749 |
|
Mapk9 |
|
0 |
1937 |
3541 |
9086 |
43705 |
|
n.v. |
0.02 |
-0.01 |
-0.02 |
-0.07 |
|
mitogen-activated protein kinase 9 isoform beta1 |
| 28893485 |
|
Mapkap1 |
|
0 |
543 |
941 |
1948 |
0 |
|
n.v. |
-0.01 |
0.23 |
0.18 |
n.v. |
|
target of rapamycin complex 2 subunit MAPKAP1 |
| 45544580 |
|
Mapkapk2 |
|
0 |
0 |
0 |
0 |
6608 |
|
n.v. |
n.v. |
n.v. |
n.v. |
0.21 |
|
MAP kinase-activated protein kinase 2 |
| 31542089 |
|
Mapkapk3 |
|
0 |
0 |
0 |
0 |
8300 |
|
n.v. |
n.v. |
n.v. |
n.v. |
0.19 |
|
MAP kinase-activated protein kinase 3 |
| 6754636 |
|
Mapkapk5 |
|
0 |
0 |
0 |
0 |
2527 |
|
n.v. |
n.v. |
n.v. |
n.v. |
0.08 |
|
MAP kinase-activated protein kinase 5 |
| 7106301 |
|
Mapre1 |
|
0 |
5937 |
2191 |
21192 |
71636 |
|
n.v. |
0.32 |
0.22 |
0.14 |
0.04 |
|
microtubule-associated protein RP/EB family member 1 |
| 253314540 |
|
Mapre2 |
|
0 |
0 |
0 |
1105 |
0 |
|
n.v. |
n.v. |
n.v. |
0.15 |
n.v. |
|
microtubule-associated protein RP/EB family member 2
isoform 1 |
| 253314542 |
|
Mapre2 |
|
0 |
0 |
0 |
1105 |
0 |
|
n.v. |
n.v. |
n.v. |
0.15 |
n.v. |
|
microtubule-associated protein RP/EB family member 2
isoform 2 |
| 253314544 |
|
Mapre2 |
|
0 |
0 |
0 |
1105 |
0 |
|
n.v. |
n.v. |
n.v. |
0.15 |
n.v. |
|
microtubule-associated protein RP/EB family member 2
isoform 3 |
| 39930509 |
|
Mapre3 |
|
0 |
0 |
0 |
0 |
12766 |
|
n.v. |
n.v. |
n.v. |
n.v. |
0.12 |
|
microtubule-associated protein RP/EB family member 3 |
| 19526848 |
|
Marc2 |
|
26306 |
8191 |
951 |
0 |
0 |
|
0.08 |
-0.13 |
-0.16 |
n.v. |
n.v. |
|
MOSC domain-containing protein 2, mitochondrial precursor |
| 256773297 |
|
March5 |
|
934 |
2904 |
547 |
0 |
0 |
|
-0.3 |
-0.24 |
-1.26 |
n.v. |
n.v. |
|
E3 ubiquitin-protein ligase 41703 isoform 1 |
| 256773301 |
|
March5 |
|
934 |
2904 |
547 |
0 |
0 |
|
-0.3 |
-0.24 |
-1.26 |
n.v. |
n.v. |
|
E3 ubiquitin-protein ligase 41703 isoform 2 |
| 256773303 |
|
March5 |
|
934 |
754 |
281 |
0 |
0 |
|
-0.3 |
-0.08 |
-1.72 |
n.v. |
n.v. |
|
E3 ubiquitin-protein ligase 41703 isoform 3 |
| 6678768 |
|
Marcks |
|
30809 |
9843 |
25412 |
16903 |
1724 |
|
0.31 |
0.21 |
0.12 |
-0.05 |
-0.14 |
|
myristoylated alanine-rich C-kinase substrate |
| 6754706 |
|
Marcksl1 |
|
13052 |
1413 |
10033 |
5386 |
1831 |
|
0.17 |
-0.11 |
-0.03 |
-0.29 |
-0.22 |
|
MARCKS-related protein |
| 124487213 |
|
Marf1 |
|
0 |
0 |
1058 |
13637 |
0 |
|
n.v. |
n.v. |
0.3 |
-0.13 |
n.v. |
|
meiosis arrest female protein 1 |
| 224922757 |
|
Mark1 |
|
0 |
1409 |
5130 |
3020 |
0 |
|
n.v. |
0.28 |
0.09 |
0.34 |
n.v. |
|
serine/threonine-protein kinase MARK1 |
| 122937355 |
|
Mark2 |
|
2966 |
5200 |
18846 |
25523 |
514 |
|
0.41 |
0.28 |
0.08 |
0.15 |
0.23 |
|
serine/threonine-protein kinase MARK2 isoform 2 |
| 122937357 |
|
Mark2 |
|
2966 |
5200 |
18846 |
25523 |
514 |
|
0.41 |
0.28 |
0.08 |
0.15 |
0.23 |
|
serine/threonine-protein kinase MARK2 isoform 4 |
| 122937359 |
|
Mark2 |
|
2966 |
5200 |
18846 |
25523 |
514 |
|
0.41 |
0.28 |
0.08 |
0.15 |
0.23 |
|
serine/threonine-protein kinase MARK2 isoform 1 |
| 122937363 |
|
Mark2 |
|
2966 |
5200 |
18846 |
25523 |
514 |
|
0.41 |
0.28 |
0.08 |
0.15 |
0.23 |
|
serine/threonine-protein kinase MARK2 isoform 3 |
| 251823810 |
|
Mark3 |
|
0 |
1570 |
7696 |
7457 |
0 |
|
n.v. |
0.06 |
0.15 |
0.27 |
n.v. |
|
MAP/microtubule affinity-regulating kinase 3 isoform 1 |
| 251823812 |
|
Mark3 |
|
0 |
1570 |
7696 |
7457 |
0 |
|
n.v. |
0.06 |
0.15 |
0.27 |
n.v. |
|
MAP/microtubule affinity-regulating kinase 3 isoform 2 |
| 26986591 |
|
Mark4 |
|
0 |
685 |
2041 |
2161 |
0 |
|
n.v. |
0.64 |
0.08 |
0.4 |
n.v. |
|
MAP/microtubule affinity-regulating kinase 4 |
| 284172357 |
|
Mars |
|
0 |
3799 |
4838 |
292675 |
3384 |
|
n.v. |
0.33 |
0.02 |
0.02 |
0.05 |
|
methionine--tRNA ligase, cytoplasmic isoform 1 |
| 51491852 |
|
Mars |
|
0 |
3799 |
4838 |
292675 |
3384 |
|
n.v. |
0.33 |
0.02 |
0.02 |
0.05 |
|
methionine--tRNA ligase, cytoplasmic isoform 2 |
| 30425166 |
|
Mars2 |
|
0 |
539 |
0 |
0 |
0 |
|
n.v. |
-0.12 |
n.v. |
n.v. |
n.v. |
|
methionine--tRNA ligase, mitochondrial precursor |
| 21704144 |
|
Mat2a |
|
2069 |
6064 |
5164 |
31015 |
90335 |
|
-0.69 |
0.28 |
0.01 |
0.27 |
0.12 |
|
S-adenosylmethionine synthase isoform type-2 |
| 19527234 |
|
Mat2b |
|
0 |
3298 |
3088 |
40207 |
66120 |
|
n.v. |
0.14 |
0.07 |
0.22 |
0.09 |
|
methionine adenosyltransferase 2 subunit beta isoform
1 |
| 313482787 |
|
Mat2b |
|
0 |
3298 |
3088 |
40207 |
66120 |
|
n.v. |
0.14 |
0.07 |
0.22 |
0.09 |
|
methionine adenosyltransferase 2 subunit beta isoform
2 |
| 6754646 |
|
Matk |
|
0 |
171 |
0 |
0 |
0 |
|
n.v. |
-0.43 |
n.v. |
n.v. |
n.v. |
|
megakaryocyte-associated tyrosine-protein kinase |
| 25141233 |
|
Matr3 |
|
109799 |
0 |
3693 |
6246 |
0 |
|
-0.08 |
n.v. |
0.39 |
0.24 |
n.v. |
|
matrin-3 |
| 269308211 |
|
Mau2 |
|
0 |
0 |
57 |
0 |
0 |
|
n.v. |
n.v. |
-0.3 |
n.v. |
n.v. |
|
MAU2 chromatid cohesion factor homolog isoform 2 |
| 269308215 |
|
Mau2 |
|
0 |
0 |
57 |
0 |
0 |
|
n.v. |
n.v. |
-0.3 |
n.v. |
n.v. |
|
MAU2 chromatid cohesion factor homolog isoform 1 |
| 21450263 |
|
Mavs |
|
3387 |
109 |
88 |
0 |
4059 |
|
-0.06 |
-0.19 |
-0.08 |
n.v. |
-0.37 |
|
mitochondrial antiviral-signaling protein isoform 1 |
| 329755284 |
|
Mavs |
|
2563 |
77 |
88 |
0 |
4059 |
|
-0.18 |
-0.2 |
-0.08 |
n.v. |
-0.37 |
|
mitochondrial antiviral-signaling protein isoform 2 |
| 226051832 |
|
Max |
|
0 |
0 |
0 |
0 |
1574 |
|
n.v. |
n.v. |
n.v. |
n.v. |
-0.12 |
|
protein max isoform 1 |
| 226051848 |
|
Max |
|
0 |
0 |
0 |
0 |
1574 |
|
n.v. |
n.v. |
n.v. |
n.v. |
-0.12 |
|
protein max isoform 2 |
| 116812912 |
|
Mb21d1 |
|
0 |
0 |
0 |
1007 |
0 |
|
n.v. |
n.v. |
n.v. |
-0.35 |
n.v. |
|
protein MB21D1 |
| 7305261 |
|
Mbd3 |
|
1464 |
13 |
0 |
2341 |
0 |
|
0.23 |
-0.7 |
n.v. |
-0.04 |
n.v. |
|
methyl-CpG-binding domain protein 3 |
| 29244490 |
|
Mblac1 |
|
0 |
0 |
0 |
0 |
9178 |
|
n.v. |
n.v. |
n.v. |
n.v. |
0.05 |
|
metallo-beta-lactamase domain-containing protein 1 |
| 358679352 |
|
Mbnl1 |
|
0 |
0 |
540 |
0 |
0 |
|
n.v. |
n.v. |
0.05 |
n.v. |
n.v. |
|
muscleblind-like protein 1 isoform 2 |
| 46411182 |
|
Mbnl1 |
|
0 |
0 |
540 |
0 |
0 |
|
n.v. |
n.v. |
0.05 |
n.v. |
n.v. |
|
muscleblind-like protein 1 isoform 1 |
| 30425032 |
|
Mbnl2 |
|
0 |
0 |
795 |
0 |
0 |
|
n.v. |
n.v. |
0.06 |
n.v. |
n.v. |
|
muscleblind-like protein 2 isoform 1 |
| 46411185 |
|
Mbnl2 |
|
0 |
0 |
577 |
0 |
0 |
|
n.v. |
n.v. |
0.06 |
n.v. |
n.v. |
|
muscleblind-like protein 2 isoform 2 |
| 19527398 |
|
Mbnl3 |
|
0 |
0 |
247 |
0 |
0 |
|
n.v. |
n.v. |
0.08 |
n.v. |
n.v. |
|
muscleblind-like protein 3 |
| 23956314 |
|
Mboat1 |
|
0 |
0 |
7 |
0 |
0 |
|
n.v. |
n.v. |
-0.62 |
n.v. |
n.v. |
|
lysophospholipid acyltransferase 1 |
| 31542014 |
|
Mboat7 |
|
0 |
357 |
433 |
0 |
0 |
|
n.v. |
-1.26 |
-0.49 |
n.v. |
n.v. |
|
lysophospholipid acyltransferase 7 |
| 71725343 |
|
Mcat |
|
0 |
21 |
0 |
0 |
0 |
|
n.v. |
-0.64 |
n.v. |
n.v. |
n.v. |
|
malonyl-CoA-acyl carrier protein transacylase,
mitochondrial |
| 186700620 |
|
Mccc1 |
|
5657 |
10139 |
0 |
1334 |
0 |
|
-0.22 |
-0.1 |
n.v. |
-0.09 |
n.v. |
|
methylcrotonoyl-CoA carboxylase subunit alpha,
mitochondrial |
| 73622267 |
|
Mccc2 |
|
1483 |
6018 |
0 |
1711 |
0 |
|
-0.3 |
0.02 |
n.v. |
0.13 |
n.v. |
|
methylcrotonoyl-CoA carboxylase beta chain,
mitochondrial |
| 165972319 |
|
Mcf2 |
|
29894 |
4296 |
18251 |
4355 |
82046 |
|
0.14 |
0.12 |
0.06 |
0.2 |
0.14 |
|
mcf.2 transforming |
| 21314834 |
|
Mcfd2 |
|
0 |
601 |
329 |
0 |
0 |
|
n.v. |
0.11 |
0.08 |
n.v. |
n.v. |
|
multiple coagulation factor deficiency protein 2 homolog
precursor |
| 309262615 |
|
Mcg1038069 |
|
45857 |
47274 |
23859 |
135905 |
21290 |
|
0.03 |
0.09 |
-0.03 |
0 |
0.01 |
|
PREDICTED: ubiquitin-conjugating enzyme E2 N |
| 6678824 |
|
Mcl1 |
|
0 |
1576 |
0 |
0 |
0 |
|
n.v. |
0.12 |
n.v. |
n.v. |
n.v. |
|
induced myeloid leukemia cell differentiation protein
Mcl-1 homolog |
| 172088119 |
|
Mcm2 |
|
309060 |
12391 |
44274 |
655631 |
243491 |
|
0 |
-0.24 |
-0.09 |
0.02 |
-0.04 |
|
DNA replication licensing factor MCM2 |
| 33859484 |
|
Mcm3 |
|
321051 |
20334 |
30725 |
666108 |
148123 |
|
0.01 |
0.04 |
-0.02 |
0.01 |
0.03 |
|
DNA replication licensing factor MCM3 |
| 255918149 |
|
Mcm4 |
|
333865 |
12498 |
19423 |
508487 |
82270 |
|
0.02 |
0.08 |
-0.06 |
0.02 |
-0.18 |
|
DNA replication licensing factor MCM4 |
| 112293273 |
|
Mcm5 |
|
384554 |
12828 |
30166 |
703901 |
107309 |
|
-0.02 |
0 |
-0.06 |
-0.02 |
-0.03 |
|
DNA replication licensing factor MCM5 |
| 6678832 |
|
Mcm6 |
|
551121 |
20349 |
30136 |
658692 |
128193 |
|
0.02 |
0.11 |
-0.03 |
0.06 |
-0.09 |
|
DNA replication licensing factor MCM6 |
| 10242373 |
|
Mcm7 |
|
448534 |
8928 |
35793 |
662327 |
74452 |
|
0.01 |
0.18 |
-0.05 |
0.07 |
-0.06 |
|
DNA replication licensing factor MCM7 |
| 22122389 |
|
Mcmbp |
|
0 |
860 |
1696 |
10101 |
21537 |
|
n.v. |
0.45 |
-0.07 |
0.02 |
0.03 |
|
mini-chromosome maintenance complex-binding protein |
| 21389327 |
|
Mcoln2 |
|
60703 |
1367 |
421 |
1473 |
4712 |
|
-0.03 |
-0.17 |
-0.47 |
0.05 |
-0.19 |
|
mucolipin-2 isoform 1 |
| 54292128 |
|
Mcoln2 |
|
60703 |
1367 |
421 |
1473 |
4712 |
|
-0.03 |
-0.17 |
-0.47 |
0.05 |
-0.19 |
|
mucolipin-2 isoform 2 |
| 21312175 |
|
Mcts1 |
|
0 |
887 |
221 |
8816 |
225 |
|
n.v. |
0.1 |
0.09 |
0.04 |
-0.32 |
|
malignant T-cell-amplified sequence 1 |
| 13384966 |
|
Mcts2 |
|
0 |
729 |
221 |
7359 |
225 |
|
n.v. |
0.16 |
0.09 |
-0.02 |
-0.32 |
|
malignant T-cell-amplified sequence 2 |
| 168823441 |
|
Mcu |
|
36392 |
9874 |
48 |
0 |
0 |
|
-0.35 |
-0.14 |
-0.36 |
n.v. |
n.v. |
|
calcium uniporter protein, mitochondrial precursor |
| 124486696 |
|
Mcur1 |
|
0 |
129 |
0 |
0 |
0 |
|
n.v. |
1.04 |
n.v. |
n.v. |
n.v. |
|
coiled-coil domain-containing protein 90A, mitochondrial
precursor |
| 132626693 |
|
Mdc1 |
|
513 |
0 |
0 |
0 |
0 |
|
-0.12 |
n.v. |
n.v. |
n.v. |
n.v. |
|
mediator of DNA damage checkpoint protein 1 |
| 124487209 |
|
Mdga1 |
|
0 |
0 |
0 |
0 |
3020 |
|
n.v. |
n.v. |
n.v. |
n.v. |
0.37 |
|
MAM domain-containing glycosylphosphatidylinositol anchor
protein 1 precursor |
| 254540027 |
|
Mdh1 |
|
74963 |
32075 |
49983 |
65935 |
480086 |
|
0.13 |
0.1 |
0.03 |
0.11 |
-0.01 |
|
malate dehydrogenase, cytoplasmic |
| 31982186 |
|
Mdh2 |
|
1699256 |
185156 |
31350 |
3274 |
208086 |
|
-0.03 |
-0.16 |
-0.3 |
-0.11 |
-0.23 |
|
malate dehydrogenase, mitochondrial precursor |
| 31543245 |
|
Mdm4 |
|
3661 |
668 |
5201 |
6917 |
17360 |
|
-0.03 |
0.19 |
-0.04 |
0.08 |
0.1 |
|
protein Mdm4 |
| 124487133 |
|
Mdn1 |
|
0 |
0 |
925 |
761 |
0 |
|
n.v. |
n.v. |
-0.26 |
-0.33 |
n.v. |
|
midasin |
| 12963663 |
|
Mdp1 |
|
0 |
1328 |
146 |
139 |
31764 |
|
n.v. |
0.25 |
-0.34 |
0.3 |
0.08 |
|
magnesium-dependent phosphatase 1 |
| 162139827 |
|
Me1 |
|
0 |
1536 |
1841 |
83853 |
17157 |
|
n.v. |
0.07 |
0.07 |
0.16 |
-0.07 |
|
NADP-dependent malic enzyme isoform 1 |
| 312147392 |
|
Me1 |
|
0 |
1536 |
1841 |
82396 |
17157 |
|
n.v. |
0.07 |
0.07 |
0.18 |
-0.07 |
|
NADP-dependent malic enzyme isoform 2 |
| 21703972 |
|
Me2 |
|
7231 |
6133 |
0 |
0 |
0 |
|
0.54 |
-0.09 |
n.v. |
n.v. |
n.v. |
|
NAD-dependent malic enzyme, mitochondrial precursor |
| 227116358 |
|
Mecr |
|
0 |
2188 |
0 |
0 |
0 |
|
n.v. |
-0.23 |
n.v. |
n.v. |
n.v. |
|
trans-2-enoyl-CoA reductase, mitochondrial precursor |
| 121582398 |
|
Med1 |
|
0 |
0 |
143 |
0 |
0 |
|
n.v. |
n.v. |
-0.27 |
n.v. |
n.v. |
|
mediator of RNA polymerase II transcription subunit 1
isoform 3 |
| 121582430 |
|
Med1 |
|
0 |
0 |
143 |
0 |
0 |
|
n.v. |
n.v. |
-0.27 |
n.v. |
n.v. |
|
mediator of RNA polymerase II transcription subunit 1
isoform 1 |
| 121583906 |
|
Med1 |
|
0 |
0 |
143 |
0 |
0 |
|
n.v. |
n.v. |
-0.27 |
n.v. |
n.v. |
|
mediator of RNA polymerase II transcription subunit 1
isoform 2 |
| 125628662 |
|
Med12 |
|
0 |
38 |
212 |
0 |
0 |
|
n.v. |
-0.01 |
-0.09 |
n.v. |
n.v. |
|
mediator of RNA polymerase II transcription subunit 12 |
| 242397421 |
|
Med12l |
|
0 |
0 |
26 |
0 |
0 |
|
n.v. |
n.v. |
1.23 |
n.v. |
n.v. |
|
mediator of RNA polymerase II transcription subunit
12-like protein |
| 115270972 |
|
Med14 |
|
0 |
0 |
266 |
0 |
0 |
|
n.v. |
n.v. |
-0.35 |
n.v. |
n.v. |
|
mediator of RNA polymerase II transcription subunit 14
isoform b |
| 115270977 |
|
Med14 |
|
0 |
0 |
266 |
0 |
0 |
|
n.v. |
n.v. |
-0.35 |
n.v. |
n.v. |
|
mediator of RNA polymerase II transcription subunit 14
isoform a |
| 100816770 |
|
Med15 |
|
0 |
0 |
25 |
0 |
0 |
|
n.v. |
n.v. |
-1.51 |
n.v. |
n.v. |
|
mediator of RNA polymerase II transcription subunit 15
isoform a |
| 100817039 |
|
Med15 |
|
0 |
0 |
25 |
0 |
0 |
|
n.v. |
n.v. |
-1.51 |
n.v. |
n.v. |
|
mediator of RNA polymerase II transcription subunit 15
isoform b |
| 21450345 |
|
Med17 |
|
0 |
0 |
860 |
0 |
0 |
|
n.v. |
n.v. |
-0.29 |
n.v. |
n.v. |
|
mediator of RNA polymerase II transcription subunit 17 |
| 21313064 |
|
Med18 |
|
0 |
0 |
133 |
0 |
0 |
|
n.v. |
n.v. |
0.15 |
n.v. |
n.v. |
|
mediator of RNA polymerase II transcription subunit 18 |
| 21313194 |
|
Med19 |
|
0 |
0 |
0 |
123 |
0 |
|
n.v. |
n.v. |
n.v. |
-0.07 |
n.v. |
|
mediator of RNA polymerase II transcription subunit 19 |
| 9910590 |
|
Med20 |
|
0 |
211 |
331 |
1310 |
996 |
|
n.v. |
0.05 |
-0.11 |
-0.13 |
0.08 |
|
mediator of RNA polymerase II transcription subunit 20 |
| 13384678 |
|
Med21 |
|
0 |
0 |
313 |
0 |
54 |
|
n.v. |
n.v. |
-0.11 |
n.v. |
1.07 |
|
mediator of RNA polymerase II transcription subunit 21 |
| 6755700 |
|
Med22 |
|
0 |
0 |
44 |
0 |
43 |
|
n.v. |
n.v. |
-0.02 |
n.v. |
0.45 |
|
mediator of RNA polymerase II transcription subunit 22
isoform 1 |
| 76781479 |
|
Med22 |
|
0 |
0 |
44 |
0 |
43 |
|
n.v. |
n.v. |
-0.02 |
n.v. |
0.45 |
|
mediator of RNA polymerase II transcription subunit 22
isoform 2 |
| 261878545 |
|
Med23 |
|
0 |
207 |
1381 |
106 |
107 |
|
n.v. |
0.11 |
-0.26 |
0.4 |
0.44 |
|
mediator of RNA polymerase II transcription subunit 23
isoform 1 |
| 261878547 |
|
Med23 |
|
0 |
207 |
1381 |
106 |
107 |
|
n.v. |
0.11 |
-0.26 |
0.4 |
0.44 |
|
mediator of RNA polymerase II transcription subunit 23
isoform 2 |
| 119220579 |
|
Med24 |
|
0 |
0 |
148 |
0 |
0 |
|
n.v. |
n.v. |
0.25 |
n.v. |
n.v. |
|
mediator of RNA polymerase II transcription subunit 24 |
| 76253678 |
|
Med27 |
|
0 |
478 |
31 |
909 |
0 |
|
n.v. |
-0.29 |
-0.52 |
-0.14 |
n.v. |
|
mediator of RNA polymerase II transcription subunit 27 |
| 13385388 |
|
Med28 |
|
0 |
0 |
20 |
0 |
311 |
|
n.v. |
n.v. |
-0.24 |
n.v. |
0.37 |
|
mediator of RNA polymerase II transcription subunit 28 |
| 19882231 |
|
Med30 |
|
0 |
443 |
635 |
655 |
2495 |
|
n.v. |
-0.41 |
-0.02 |
-0.41 |
0 |
|
mediator of RNA polymerase II transcription subunit 30 |
| 56119162 |
|
Med31 |
|
0 |
56 |
168 |
278 |
407 |
|
n.v. |
0.45 |
-0.14 |
-0.21 |
0.09 |
|
mediator of RNA polymerase II transcription subunit 31 |
| 157266302;157266322 |
|
Med7 |
|
0 |
0 |
4 |
172 |
0 |
|
n.v. |
n.v. |
0.02 |
-0.11 |
n.v. |
|
mediator of RNA polymerase II transcription subunit 7 |
| 255982602 |
|
Mei1 |
|
0 |
0 |
878 |
0 |
0 |
|
n.v. |
n.v. |
-0.13 |
n.v. |
n.v. |
|
meiosis inhibitor protein 1 |
| 19526994 |
|
Memo1 |
|
0 |
1019 |
243 |
0 |
15036 |
|
n.v. |
0.28 |
0.17 |
n.v. |
0.05 |
|
protein MEMO1 |
| 119672920 |
|
Mepce |
|
0 |
0 |
18 |
4322 |
825 |
|
n.v. |
n.v. |
-0.1 |
0.21 |
0.08 |
|
7SK snRNA methylphosphate capping enzyme |
| 228480219 |
|
Mesdc2 |
|
0 |
633 |
455 |
0 |
0 |
|
n.v. |
0.69 |
-0.19 |
n.v. |
n.v. |
|
LDLR chaperone MESD precursor |
| 146198696 |
|
Met |
|
0 |
1271 |
7879 |
0 |
2313 |
|
n.v. |
0.02 |
-0.17 |
n.v. |
-0.62 |
|
hepatocyte growth factor receptor precursor |
| 28202007 |
|
Metap1 |
|
0 |
2620 |
43629 |
14136 |
10067 |
|
n.v. |
0.16 |
0.06 |
0.23 |
-0.05 |
|
methionine aminopeptidase 1 |
| 17975502 |
|
Metap1d |
|
0 |
338 |
0 |
0 |
0 |
|
n.v. |
-0.12 |
n.v. |
n.v. |
n.v. |
|
methionine aminopeptidase 1D, mitochondrial
precursor |
| 9789873 |
|
Metap2 |
|
696 |
2703 |
15444 |
79883 |
11 |
|
0.13 |
0.33 |
0.06 |
0.08 |
0.6 |
|
methionine aminopeptidase 2 |
| 6754682 |
|
Mettl1 |
|
0 |
873 |
0 |
712 |
4776 |
|
n.v. |
-2.29 |
n.v. |
-0.71 |
0.32 |
|
tRNA (guanine-N(7)-)-methyltransferase |
| 47059504 |
|
Mettl10 |
|
0 |
0 |
0 |
0 |
2206 |
|
n.v. |
n.v. |
n.v. |
n.v. |
0 |
|
methyltransferase-like protein 10 |
| 21536262 |
|
Mettl13 |
|
0 |
455 |
565 |
1162 |
942 |
|
n.v. |
0.17 |
0.07 |
0.7 |
0.72 |
|
methyltransferase-like protein 13 |
| 21312938 |
|
Mettl16 |
|
0 |
0 |
669 |
1645 |
1028 |
|
n.v. |
n.v. |
0.44 |
0.41 |
0.25 |
|
methyltransferase-like protein 16 |
| 255683413 |
|
Mettl2 |
|
0 |
0 |
0 |
0 |
664 |
|
n.v. |
n.v. |
n.v. |
n.v. |
0.51 |
|
methyltransferase-like protein 2 |
| 77627973 |
|
Mettl3 |
|
0 |
0 |
0 |
0 |
835 |
|
n.v. |
n.v. |
n.v. |
n.v. |
0.32 |
|
N6-adenosine-methyltransferase 70 kDa subunit |
| 33563290 |
|
Mettl7a1 |
|
10709 |
8392 |
9948 |
1424 |
0 |
|
-0.44 |
-0.05 |
-0.14 |
-0.9 |
n.v. |
|
methyltransferase-like protein 7A |
| 61098178 |
|
Mettl7a2 |
|
10709 |
6972 |
7870 |
1424 |
0 |
|
-0.44 |
-0.4 |
-0.15 |
-0.9 |
n.v. |
|
methyltransferase like 7A2 |
| 67003561 |
|
Mettl7a2Higd1c |
|
10709 |
6972 |
7870 |
1424 |
0 |
|
-0.44 |
-0.4 |
-0.15 |
-0.9 |
n.v. |
|
Mettl7a2-Higd1c readthrough transcript |
| 125490373 |
|
Mettl7a3 |
|
879 |
4791 |
6442 |
966 |
0 |
|
1.12 |
-0.4 |
0.1 |
-0.64 |
n.v. |
|
UbiE3 protein |
| 34328259 |
|
Mettl9 |
|
0 |
132 |
22 |
0 |
0 |
|
n.v. |
-0.2 |
-0.06 |
n.v. |
n.v. |
|
methyltransferase-like protein 9 precursor |
| 126517472 |
|
Mfap1b |
|
0 |
27 |
1 |
0 |
0 |
|
n.v. |
0.02 |
0.08 |
n.v. |
n.v. |
|
microfibrillar-associated protein 1B |
| 113865977 |
|
Mfge8 |
|
0 |
29110 |
66243 |
884 |
0 |
|
n.v. |
0.03 |
0.17 |
-0.57 |
n.v. |
|
lactadherin isoform 2 precursor |
| 113865979 |
|
Mfge8 |
|
0 |
29110 |
66243 |
884 |
0 |
|
n.v. |
0.03 |
0.17 |
-0.57 |
n.v. |
|
lactadherin isoform 1 precursor |
| 124486881 |
|
Mfhas1 |
|
0 |
0 |
0 |
5239 |
72493 |
|
n.v. |
n.v. |
n.v. |
0.1 |
-0.05 |
|
malignant fibrous histiocytoma-amplified sequence 1
homolog |
| 244793488 |
|
Mfn1 |
|
2270 |
3682 |
199 |
0 |
0 |
|
-0.03 |
-0.06 |
-0.26 |
n.v. |
n.v. |
|
mitofusin-1 |
| 21313266 |
|
Mfsd1 |
|
0 |
1046 |
4172 |
0 |
0 |
|
n.v. |
-0.24 |
-0.22 |
n.v. |
n.v. |
|
major facilitator superfamily domain-containing protein 1 |
| 13386144 |
|
Mfsd10 |
|
7066 |
1641 |
776 |
106 |
0 |
|
-0.05 |
-0.23 |
-0.34 |
-0.25 |
n.v. |
|
major facilitator superfamily domain-containing protein
10 |
| 148540196 |
|
Mfsd12 |
|
0 |
2 |
18 |
0 |
0 |
|
n.v. |
-0.24 |
0.1 |
n.v. |
n.v. |
|
major facilitator superfamily domain-containing protein
12 |
| 19527330 |
|
Mfsd5 |
|
0 |
294 |
0 |
0 |
0 |
|
n.v. |
-1.51 |
n.v. |
n.v. |
n.v. |
|
major facilitator superfamily domain-containing protein 5
precursor |
| 160707919 |
|
Mfsd6 |
|
0 |
27 |
0 |
246 |
0 |
|
n.v. |
-0.02 |
n.v. |
-0.04 |
n.v. |
|
major facilitator superfamily domain-containing protein 6
isoform 1 |
| 31541926 |
|
Mfsd8 |
|
0 |
242 |
0 |
0 |
0 |
|
n.v. |
-0.2 |
n.v. |
n.v. |
n.v. |
|
major facilitator superfamily domain-containing protein 8 |
| 158711696 |
|
Mgat1 |
|
0 |
0 |
0 |
442 |
0 |
|
n.v. |
n.v. |
n.v. |
-0.28 |
n.v. |
|
alpha-1,3-mannosyl-glycoprotein
2-beta-N-acetylglucosaminyltransferase |
| 22122521 |
|
Mgat2 |
|
0 |
1478 |
0 |
0 |
0 |
|
n.v. |
0.29 |
n.v. |
n.v. |
n.v. |
|
alpha-1,6-mannosyl-glycoprotein
2-beta-N-acetylglucosaminyltransferase |
| 253683470 |
|
Mgat4b |
|
0 |
58 |
0 |
0 |
0 |
|
n.v. |
0.08 |
n.v. |
n.v. |
n.v. |
|
alpha-1,3-mannosyl-glycoprotein
4-beta-N-acetylglucosaminyltransferase B precursor |
| 326633239 |
|
Mgat4c |
|
0 |
0 |
704 |
0 |
0 |
|
n.v. |
n.v. |
-0.04 |
n.v. |
n.v. |
|
alpha-1,3-mannosyl-glycoprotein
4-beta-N-acetylglucosaminyltransferase C |
| 15011884 |
|
Mgea5 |
|
0 |
0 |
837 |
188 |
40439 |
|
n.v. |
n.v. |
-0.04 |
0.74 |
0.13 |
|
bifunctional protein NCOAT |
| 21312780 |
|
Mgme1 |
|
0 |
432 |
0 |
0 |
0 |
|
n.v. |
0.03 |
n.v. |
n.v. |
n.v. |
|
uncharacterized protein C20orf72 homolog |
| 27229238 |
|
Mgrn1 |
|
0 |
0 |
6 |
1203 |
857 |
|
n.v. |
n.v. |
-0.03 |
0.32 |
0.1 |
|
E3 ubiquitin-protein ligase MGRN1 isoform 2 |
| 356995926 |
|
Mgrn1 |
|
0 |
0 |
6 |
1203 |
857 |
|
n.v. |
n.v. |
-0.03 |
0.32 |
0.1 |
|
E3 ubiquitin-protein ligase MGRN1 isoform 1 |
| 31981068 |
|
Mgst1 |
|
12704 |
5870 |
1697 |
0 |
0 |
|
0.47 |
-0.17 |
-0.66 |
n.v. |
n.v. |
|
microsomal glutathione S-transferase 1 |
| 13385010 |
|
Mgst3 |
|
7414 |
1889 |
1109 |
671 |
0 |
|
-0.13 |
-0.4 |
-0.49 |
-0.34 |
n.v. |
|
microsomal glutathione S-transferase 3 |
| 124001582 |
|
Mia3 |
|
0 |
511 |
0 |
0 |
0 |
|
n.v. |
-0.1 |
n.v. |
n.v. |
n.v. |
|
melanoma inhibitory activity protein 3 precursor |
| 32189428 |
|
Mib1 |
|
0 |
0 |
2488 |
0 |
1660 |
|
n.v. |
n.v. |
-0.16 |
n.v. |
0.07 |
|
E3 ubiquitin-protein ligase MIB1 |
| 170932490 |
|
Mical3 |
|
0 |
0 |
0 |
794 |
2024 |
|
n.v. |
n.v. |
n.v. |
-1.11 |
-0.93 |
|
protein-methionine sulfoxide oxidase MICAL3 isoform 2 |
| 394582113 |
|
Mical3 |
|
3094 |
0 |
0 |
794 |
2024 |
|
-0.02 |
n.v. |
n.v. |
-1.11 |
-0.93 |
|
protein-methionine sulfoxide oxidase MICAL3 isoform 1 |
| 168229165 |
|
Micall1 |
|
0 |
0 |
0 |
0 |
332 |
|
n.v. |
n.v. |
n.v. |
n.v. |
-2 |
|
MICAL-like protein 1 |
| 21450201 |
|
Micu1 |
|
476 |
1616 |
28 |
0 |
0 |
|
-0.52 |
-0.29 |
-1.07 |
n.v. |
n.v. |
|
calcium uptake protein 1, mitochondrial |
| 27477043 |
|
Micu2 |
|
6865 |
2014 |
70 |
0 |
0 |
|
-0.14 |
-0.3 |
-0.28 |
n.v. |
n.v. |
|
calcium uptake protein 2, mitochondrial |
| 10947008 |
|
Midn |
|
13327 |
0 |
1652 |
3749 |
0 |
|
-0.07 |
n.v. |
0.06 |
0.16 |
n.v. |
|
midnolin |
| 13384990 |
|
Mien1 |
|
0 |
426 |
373 |
704 |
2249 |
|
n.v. |
0.09 |
0 |
0.17 |
0.23 |
|
migration and invasion enhancer 1 |
| 555290129 |
|
Mier1 |
|
604 |
0 |
0 |
0 |
0 |
|
-0.01 |
n.v. |
n.v. |
n.v. |
n.v. |
|
mesoderm induction early response protein 1 isoform d |
| 555290144 |
|
Mier1 |
|
604 |
0 |
0 |
0 |
0 |
|
-0.01 |
n.v. |
n.v. |
n.v. |
n.v. |
|
mesoderm induction early response protein 1 isoform c
precursor |
| 84872225 |
|
Mier1 |
|
604 |
420 |
0 |
0 |
278 |
|
-0.01 |
-0.18 |
n.v. |
n.v. |
-0.26 |
|
mesoderm induction early response protein 1 isoform b |
| 84872227 |
|
Mier1 |
|
604 |
420 |
0 |
0 |
278 |
|
-0.01 |
-0.18 |
n.v. |
n.v. |
-0.26 |
|
mesoderm induction early response protein 1 isoform a
precursor |
| 6754696 |
|
Mif |
|
62057 |
5561 |
32442 |
4461 |
16825 |
|
0.09 |
0.2 |
-0.01 |
-0.04 |
0.09 |
|
macrophage migration inhibitory factor |
| 343790914;262073012 |
|
Mif4gd |
|
0 |
0 |
0 |
0 |
750 |
|
n.v. |
n.v. |
n.v. |
n.v. |
-0.39 |
|
MIF4G domain-containing protein isoform 1 |
| 343790916 |
|
Mif4gd |
|
0 |
0 |
0 |
0 |
750 |
|
n.v. |
n.v. |
n.v. |
n.v. |
-0.39 |
|
MIF4G domain-containing protein isoform 2 |
| 256355182 |
|
Mina |
|
0 |
0 |
1610 |
5730 |
0 |
|
n.v. |
n.v. |
-0.07 |
0.09 |
n.v. |
|
bifunctional lysine-specific demethylase and
histidyl-hydroxylase MINA |
| 114052104 |
|
Mink1 |
|
0 |
0 |
247 |
0 |
0 |
|
n.v. |
n.v. |
0.21 |
n.v. |
n.v. |
|
misshapen-like kinase 1 isoform 4 |
| 114052416 |
|
Mink1 |
|
0 |
0 |
247 |
0 |
0 |
|
n.v. |
n.v. |
0.21 |
n.v. |
n.v. |
|
misshapen-like kinase 1 isoform 2 |
| 114052442 |
|
Mink1 |
|
0 |
0 |
247 |
0 |
0 |
|
n.v. |
n.v. |
0.21 |
n.v. |
n.v. |
|
misshapen-like kinase 1 isoform 1 |
| 114052522 |
|
Mink1 |
|
0 |
0 |
247 |
0 |
0 |
|
n.v. |
n.v. |
0.21 |
n.v. |
n.v. |
|
misshapen-like kinase 1 isoform 3 |
| 244791232 |
|
Minos1 |
|
952 |
253 |
417 |
0 |
0 |
|
-0.12 |
-0.1 |
-0.57 |
n.v. |
n.v. |
|
mitochondrial inner membrane organizing system protein
1 |
| 6754698 |
|
Minpp1 |
|
0 |
61 |
15 |
0 |
1124 |
|
n.v. |
-0.65 |
-0.32 |
n.v. |
-0.19 |
|
multiple inositol polyphosphate phosphatase 1 precursor |
| 213021192 |
|
Mios |
|
0 |
125 |
2893 |
0 |
0 |
|
n.v. |
-0.36 |
-0.19 |
n.v. |
n.v. |
|
WD repeat-containing protein mio |
| 256418961 |
|
Mipol1 |
|
0 |
0 |
70 |
8963 |
0 |
|
n.v. |
n.v. |
-0.62 |
0.1 |
n.v. |
|
mirror-image polydactyly gene 1 protein homolog |
| 70909369 |
|
Mis18a |
|
0 |
10 |
0 |
8 |
321 |
|
n.v. |
0.2 |
n.v. |
1.26 |
-0.55 |
|
protein Mis18-alpha |
| 110625710 |
|
Mitd1 |
|
0 |
0 |
75 |
876 |
0 |
|
n.v. |
n.v. |
-0.13 |
-0.37 |
n.v. |
|
MIT domain-containing protein 1 |
| 127138894 |
|
Mkl1 |
|
0 |
1000 |
0 |
41 |
5719 |
|
n.v. |
-0.16 |
n.v. |
0.61 |
0.11 |
|
MKL/myocardin-like protein 1 isoform 1 |
| 127139379 |
|
Mkl1 |
|
0 |
1000 |
0 |
41 |
5719 |
|
n.v. |
-0.16 |
n.v. |
0.61 |
0.11 |
|
MKL/myocardin-like protein 1 isoform 2 |
| 169881261 |
|
Mkl2 |
|
0 |
0 |
0 |
835 |
8054 |
|
n.v. |
n.v. |
n.v. |
0.08 |
0.37 |
|
MKL/myocardin-like protein 2 isoform 3 |
| 237820633 |
|
Mkl2 |
|
0 |
0 |
0 |
835 |
8054 |
|
n.v. |
n.v. |
n.v. |
0.08 |
0.37 |
|
MKL/myocardin-like protein 2 isoform 1 |
| 7305271 |
|
Mkln1 |
|
0 |
0 |
0 |
2939 |
139 |
|
n.v. |
n.v. |
n.v. |
0.27 |
-0.5 |
|
muskelin |
| 10946852 |
|
Mknk2 |
|
0 |
0 |
130 |
622 |
0 |
|
n.v. |
n.v. |
0.14 |
0.57 |
n.v. |
|
MAP kinase-interacting serine/threonine-protein kinase
2 |
| 88853570 |
|
Mkrn2 |
|
604 |
0 |
0 |
0 |
0 |
|
-0.08 |
n.v. |
n.v. |
n.v. |
n.v. |
|
probable E3 ubiquitin-protein ligase makorin-2 |
| 188497650 |
|
Mlec |
|
63796 |
15381 |
5370 |
1383 |
0 |
|
0.01 |
-0.13 |
-0.39 |
-0.23 |
n.v. |
|
malectin precursor |
| 21703770 |
|
Mlf2 |
|
0 |
33 |
0 |
417 |
2784 |
|
n.v. |
0.95 |
n.v. |
0.33 |
0.08 |
|
myeloid leukemia factor 2 |
| 110626037 |
|
Mlkl |
|
0 |
0 |
0 |
589 |
7689 |
|
n.v. |
n.v. |
n.v. |
-0.01 |
-0.17 |
|
mixed lineage kinase domain-like protein |
| 11612511 |
|
Mllt1 |
|
0 |
261 |
0 |
0 |
0 |
|
n.v. |
-0.18 |
n.v. |
n.v. |
n.v. |
|
protein ENL |
| 145587092 |
|
Mllt4 |
|
7030 |
4501 |
5000 |
11845 |
47732 |
|
0.58 |
0.21 |
0.04 |
-0.3 |
-0.31 |
|
afadin |
| 357197121;357197118 |
|
Mlst8 |
|
0 |
0 |
1397 |
0 |
0 |
|
n.v. |
n.v. |
0.23 |
n.v. |
n.v. |
|
target of rapamycin complex subunit LST8 isoform 1 |
| 357197118 |
|
Mlst8 |
|
0 |
524 |
0 |
3553 |
0 |
|
n.v. |
0.39 |
n.v. |
-0.62 |
n.v. |
|
target of rapamycin complex subunit LST8 isoform 1 |
| 357197123 |
|
Mlst8 |
|
0 |
524 |
1299 |
2734 |
0 |
|
n.v. |
0.39 |
0.25 |
-0.49 |
n.v. |
|
target of rapamycin complex subunit LST8 isoform 2 |
| 56797739 |
|
Mlycd |
|
0 |
134 |
0 |
0 |
0 |
|
n.v. |
0.02 |
n.v. |
n.v. |
n.v. |
|
malonyl-CoA decarboxylase, mitochondrial |
| 21313396 |
|
Mmab |
|
0 |
628 |
0 |
0 |
0 |
|
n.v. |
-0.1 |
n.v. |
n.v. |
n.v. |
|
cob(I)yrinic acid a,c-diamide adenosyltransferase,
mitochondrial precursor |
| 31543255 |
|
Mme |
|
0 |
209 |
2971 |
0 |
0 |
|
n.v. |
-0.36 |
0.04 |
n.v. |
n.v. |
|
neprilysin |
| 22122803 |
|
Mmgt1 |
|
0 |
228 |
67 |
0 |
0 |
|
n.v. |
-0.05 |
0.02 |
n.v. |
n.v. |
|
membrane magnesium transporter 1 precursor |
| 188528637 |
|
Mmp14 |
|
0 |
4 |
9 |
0 |
0 |
|
n.v. |
-1.07 |
0.06 |
n.v. |
n.v. |
|
matrix metalloproteinase-14 precursor |
| 23308683 |
|
Mmp21 |
|
0 |
0 |
890 |
0 |
0 |
|
n.v. |
n.v. |
-0.06 |
n.v. |
n.v. |
|
matrix metalloproteinase-21 precursor |
| 15100156 |
|
Mms19 |
|
0 |
1115 |
689 |
29550 |
4605 |
|
n.v. |
0.46 |
0.02 |
0.05 |
0.23 |
|
MMS19 nucleotide excision repair protein homolog |
| 253970429 |
|
Mms22l |
|
0 |
0 |
15 |
16 |
0 |
|
n.v. |
n.v. |
-0.05 |
0.6 |
n.v. |
|
protein MMS22-like |
| 89363038 |
|
Mnat1 |
|
0 |
0 |
0 |
0 |
3341 |
|
n.v. |
n.v. |
n.v. |
n.v. |
-0.09 |
|
CDK-activating kinase assembly factor MAT1 |
| 84781795 |
|
Mnda |
|
29894 |
4296 |
18251 |
4355 |
82046 |
|
0.14 |
0.12 |
0.06 |
0.2 |
0.14 |
|
interferon-activable protein 205-B |
| 21704148 |
|
Mob1a |
|
0 |
4586 |
2136 |
6295 |
9692 |
|
n.v. |
0.17 |
0.18 |
0.01 |
0.02 |
|
MOB kinase activator 1A |
| 62412947 |
|
Mob1b |
|
0 |
4586 |
2136 |
6295 |
9692 |
|
n.v. |
0.17 |
0.18 |
0.01 |
0.02 |
|
MOB kinase activator 1B |
| 20149310 |
|
Mob2 |
|
0 |
0 |
0 |
0 |
1692 |
|
n.v. |
n.v. |
n.v. |
n.v. |
-0.1 |
|
MOB kinase activator 2 |
| 40254521 |
|
Mob4 |
|
0 |
1342 |
231 |
11992 |
3159 |
|
n.v. |
-0.03 |
-0.02 |
-0.08 |
-0.09 |
|
MOB-like protein phocein |
| 161484628 |
|
Mocs1 |
|
0 |
96 |
0 |
0 |
0 |
|
n.v. |
-0.21 |
n.v. |
n.v. |
n.v. |
|
molybdenum cofactor biosynthesis protein 1 isoform 1 |
| 237820699 |
|
Mocs3 |
|
0 |
0 |
509 |
17419 |
27052 |
|
n.v. |
n.v. |
-0.15 |
0.18 |
-0.01 |
|
adenylyltransferase and sulfurtransferase MOCS3 |
| 31981106 |
|
Mogs |
|
21821 |
3764 |
1220 |
0 |
0 |
|
-0.07 |
-0.26 |
-0.32 |
n.v. |
n.v. |
|
mannosyl-oligosaccharide glucosidase |
| 21312179 |
|
Mon1a |
|
0 |
0 |
29 |
0 |
0 |
|
n.v. |
n.v. |
0.32 |
n.v. |
n.v. |
|
vacuolar fusion protein MON1 homolog A |
| 27370524 |
|
Mon1b |
|
0 |
61 |
20 |
0 |
0 |
|
n.v. |
-0.12 |
-0.32 |
n.v. |
n.v. |
|
vacuolar fusion protein MON1 homolog B |
| 253683420 |
|
Mon2 |
|
128 |
1357 |
4309 |
47010 |
49756 |
|
0 |
0.12 |
0.08 |
0.13 |
0.16 |
|
protein MON2 homolog isoform 3 |
| 253683422 |
|
Mon2 |
|
128 |
1357 |
4309 |
45299 |
49756 |
|
0 |
0.12 |
0.08 |
0.15 |
0.16 |
|
protein MON2 homolog isoform 1 |
| 253683424 |
|
Mon2 |
|
128 |
1357 |
4309 |
47010 |
48825 |
|
0 |
0.12 |
0.08 |
0.13 |
0.16 |
|
protein MON2 homolog isoform 2 |
| 13277348 |
|
Morf4l1 |
|
0 |
0 |
186 |
33 |
21 |
|
n.v. |
n.v. |
0.06 |
-0.38 |
0.47 |
|
mortality factor 4-like protein 1 isoform b |
| 85540473 |
|
Morf4l1 |
|
0 |
0 |
186 |
33 |
21 |
|
n.v. |
n.v. |
0.06 |
-0.38 |
0.47 |
|
mortality factor 4-like protein 1 isoform a |
| 167234396 |
|
Mospd2 |
|
0 |
1123 |
306 |
0 |
0 |
|
n.v. |
-0.13 |
-0.29 |
n.v. |
n.v. |
|
motile sperm domain-containing protein 2 |
| 254540179 |
|
Mov10 |
|
0 |
0 |
19409 |
19302 |
0 |
|
n.v. |
n.v. |
0.16 |
0.02 |
n.v. |
|
putative helicase MOV-10 isoform b |
| 254540181 |
|
Mov10 |
|
0 |
0 |
19409 |
19302 |
0 |
|
n.v. |
n.v. |
0.16 |
0.02 |
n.v. |
|
putative helicase MOV-10 isoform a |
| 9055178 |
|
Mpc1 |
|
805 |
0 |
0 |
0 |
0 |
|
-0.02 |
n.v. |
n.v. |
n.v. |
n.v. |
|
mitochondrial pyruvate carrier 1 |
| 21312594 |
|
Mpc2 |
|
952 |
2179 |
111 |
0 |
0 |
|
0.15 |
-0.02 |
-0.32 |
n.v. |
n.v. |
|
mitochondrial pyruvate carrier 2 |
| 31981340 |
|
Mpdu1 |
|
2215 |
4117 |
3231 |
90 |
0 |
|
0.05 |
-0.28 |
-0.44 |
-0.69 |
n.v. |
|
mannose-P-dolichol utilization defect 1 protein |
| 124053457 |
|
Mpdz |
|
0 |
0 |
102 |
24082 |
0 |
|
n.v. |
n.v. |
0.79 |
-0.07 |
n.v. |
|
multiple PDZ domain protein |
| 268370034 |
|
Mpg |
|
0 |
0 |
0 |
25 |
0 |
|
n.v. |
n.v. |
n.v. |
-0.13 |
n.v. |
|
DNA-3-methyladenine glycosylase |
| 21312048 |
|
Mphosph6 |
|
0 |
0 |
0 |
2775 |
64 |
|
n.v. |
n.v. |
n.v. |
-0.2 |
-0.18 |
|
M-phase phosphoprotein 6 |
| 91206392 |
|
Mpi |
|
0 |
115 |
40 |
0 |
59320 |
|
n.v. |
-0.33 |
0.33 |
n.v. |
-0.04 |
|
mannose-6-phosphate isomerase |
| 7710062 |
|
Mpp2 |
|
0 |
0 |
1430 |
0 |
0 |
|
n.v. |
n.v. |
-0.29 |
n.v. |
n.v. |
|
MAGUK p55 subfamily member 2 |
| 118026923 |
|
Mpp3 |
|
0 |
0 |
334 |
0 |
0 |
|
n.v. |
n.v. |
-0.2 |
n.v. |
n.v. |
|
MAGUK p55 subfamily member 3 |
| 9625023 |
|
Mpp5 |
|
0 |
0 |
9573 |
0 |
0 |
|
n.v. |
n.v. |
0.05 |
n.v. |
n.v. |
|
MAGUK p55 subfamily member 5 |
| 257900522 |
|
Mpp6 |
|
0 |
4233 |
0 |
0 |
0 |
|
n.v. |
-0.15 |
n.v. |
n.v. |
n.v. |
|
MAGUK p55 subfamily member 6 isoform a |
| 257900524;257900522 |
|
Mpp6 |
|
0 |
0 |
13742 |
0 |
0 |
|
n.v. |
n.v. |
-0.27 |
n.v. |
n.v. |
|
MAGUK p55 subfamily member 6 isoform a |
| 257900520 |
|
Mpp6 |
|
0 |
4233 |
13742 |
0 |
0 |
|
n.v. |
-0.15 |
-0.27 |
n.v. |
n.v. |
|
MAGUK p55 subfamily member 6 isoform b |
| 239051572 |
|
Mpp7 |
|
8256 |
13776 |
21679 |
598 |
0 |
|
0.04 |
-0.04 |
-0.18 |
0.05 |
n.v. |
|
MAGUK p55 subfamily member 7 isoform 1 |
| 239051602 |
|
Mpp7 |
|
8256 |
3870 |
6841 |
598 |
0 |
|
0.04 |
0.04 |
-0.16 |
0.05 |
n.v. |
|
MAGUK p55 subfamily member 7 isoform 2 |
| 244789999 |
|
Mpst |
|
31248 |
3841 |
29 |
0 |
3513 |
|
-0.08 |
-0.15 |
-0.06 |
n.v. |
0.27 |
|
3-mercaptopyruvate sulfurtransferase |
| 6678926 |
|
Mpv17 |
|
0 |
472 |
0 |
0 |
0 |
|
n.v. |
0.62 |
n.v. |
n.v. |
n.v. |
|
protein Mpv17 |
| 31542623 |
|
Mpzl2 |
|
0 |
1173 |
391 |
0 |
0 |
|
n.v. |
-0.15 |
-0.48 |
n.v. |
n.v. |
|
myelin protein zero-like protein 2 precursor |
| 6678930 |
|
Mras |
|
0 |
0 |
670 |
0 |
0 |
|
n.v. |
n.v. |
-0.15 |
n.v. |
n.v. |
|
ras-related protein M-Ras precursor |
| 9055282 |
|
Mre11a |
|
696 |
0 |
47 |
2210 |
814 |
|
0.3 |
n.v. |
-0.39 |
-0.37 |
-0.22 |
|
double-strand break repair protein MRE11A |
| 13385746 |
|
Mrfap1 |
|
0 |
0 |
0 |
0 |
782 |
|
n.v. |
n.v. |
n.v. |
n.v. |
-1 |
|
MORF4 family-associated protein 1 |
| 268838020 |
|
Mri1 |
|
0 |
672 |
2783 |
5673 |
47090 |
|
n.v. |
-0.53 |
-0.08 |
0.17 |
0.13 |
|
methylthioribose-1-phosphate isomerase |
| 89337263 |
|
Mrm1 |
|
0 |
511 |
0 |
0 |
0 |
|
n.v. |
-0.55 |
n.v. |
n.v. |
n.v. |
|
rRNA methyltransferase 1, mitochondrial precursor |
| 241982824 |
|
Mroh1 |
|
0 |
192 |
7198 |
9307 |
7497 |
|
n.v. |
0.08 |
-0.14 |
0.05 |
0.13 |
|
HEAT repeat containing 7A isoform 2 |
| 283046757 |
|
Mroh1 |
|
0 |
273 |
13277 |
11091 |
13730 |
|
n.v. |
0.13 |
-0.16 |
0.01 |
0.17 |
|
HEAT repeat containing 7A isoform 1 |
| 527317377 |
|
Mroh2a |
|
1831 |
0 |
0 |
0 |
0 |
|
-0.05 |
n.v. |
n.v. |
n.v. |
n.v. |
|
maestro heat-like repeat-containing protein family member
2A |
| 294460010 |
|
Mroh4 |
|
0 |
6567 |
0 |
0 |
102747 |
|
n.v. |
0.22 |
n.v. |
n.v. |
0.1 |
|
uncharacterized protein LOC69439 |
| 254692919 |
|
Mroh9 |
|
3661 |
668 |
5201 |
6917 |
17360 |
|
-0.03 |
0.19 |
-0.04 |
0.08 |
0.1 |
|
uncharacterized protein LOC78258 |
| 13385888 |
|
Mrp63 |
|
0 |
566 |
0 |
0 |
0 |
|
n.v. |
-0.29 |
n.v. |
n.v. |
n.v. |
|
ribosomal protein 63, mitochondrial |
| 84875528 |
|
Mrpl1 |
|
0 |
5745 |
0 |
352 |
0 |
|
n.v. |
-0.06 |
n.v. |
-0.72 |
n.v. |
|
39S ribosomal protein L1, mitochondrial isoform 1 |
| 84875532 |
|
Mrpl1 |
|
0 |
5745 |
0 |
352 |
0 |
|
n.v. |
-0.06 |
n.v. |
-0.72 |
n.v. |
|
39S ribosomal protein L1, mitochondrial isoform 2 |
| 13385658 |
|
Mrpl10 |
|
0 |
257 |
1 |
0 |
0 |
|
n.v. |
-0.04 |
-0.74 |
n.v. |
n.v. |
|
39S ribosomal protein L10, mitochondrial precursor |
| 13384980 |
|
Mrpl11 |
|
6389 |
3722 |
0 |
1162 |
0 |
|
0.02 |
-0.13 |
n.v. |
-0.82 |
n.v. |
|
39S ribosomal protein L11, mitochondrial |
| 22164792 |
|
Mrpl12 |
|
36539 |
9571 |
1241 |
1072 |
589 |
|
0.02 |
-0.09 |
-0.22 |
-0.57 |
0.09 |
|
39S ribosomal protein L12, mitochondrial precursor |
| 21312936 |
|
Mrpl13 |
|
1574 |
3858 |
0 |
426 |
0 |
|
0.11 |
-0.12 |
n.v. |
0.26 |
n.v. |
|
39S ribosomal protein L13, mitochondrial |
| 21312028 |
|
Mrpl14 |
|
0 |
113 |
16 |
254 |
0 |
|
n.v. |
0.27 |
-1.32 |
-0.27 |
n.v. |
|
39S ribosomal protein L14, mitochondrial precursor |
| 295054166 |
|
Mrpl15 |
|
330 |
3879 |
0 |
82 |
0 |
|
0.19 |
-0.25 |
n.v. |
-0.86 |
n.v. |
|
39S ribosomal protein L15, mitochondrial isoform 1
precursor |
| 33468983 |
|
Mrpl15 |
|
330 |
3484 |
0 |
82 |
0 |
|
0.19 |
-0.27 |
n.v. |
-0.86 |
n.v. |
|
39S ribosomal protein L15, mitochondrial isoform 2
precursor |
| 19424352 |
|
Mrpl16 |
|
732 |
428 |
0 |
0 |
0 |
|
0.38 |
-0.27 |
n.v. |
n.v. |
n.v. |
|
39S ribosomal protein L16, mitochondrial precursor |
| 13384658 |
|
Mrpl17 |
|
0 |
870 |
0 |
0 |
0 |
|
n.v. |
-0.17 |
n.v. |
n.v. |
n.v. |
|
39S ribosomal protein L17, mitochondrial precursor |
| 13385808 |
|
Mrpl18 |
|
3332 |
5240 |
31 |
655 |
0 |
|
0.05 |
-0.14 |
-0.81 |
-0.42 |
n.v. |
|
39S ribosomal protein L18, mitochondrial |
| 13385976 |
|
Mrpl19 |
|
0 |
2599 |
0 |
0 |
0 |
|
n.v. |
-0.24 |
n.v. |
n.v. |
n.v. |
|
39S ribosomal protein L19, mitochondrial |
| 13384660 |
|
Mrpl2 |
|
14132 |
1779 |
0 |
0 |
3727 |
|
-3.14 |
-0.3 |
n.v. |
n.v. |
-5.61 |
|
39S ribosomal protein L2, mitochondrial precursor |
| 20270194 |
|
Mrpl20 |
|
0 |
960 |
3 |
303 |
0 |
|
n.v. |
0.02 |
0.13 |
-0.35 |
n.v. |
|
39S ribosomal protein L20, mitochondrial precursor |
| 31982032 |
|
Mrpl21 |
|
2014 |
2171 |
15 |
516 |
0 |
|
-0.22 |
-0.13 |
0.05 |
-0.28 |
n.v. |
|
39S ribosomal protein L21, mitochondrial |
| 262263310 |
|
Mrpl22 |
|
6865 |
4611 |
0 |
2685 |
0 |
|
0.18 |
-0.38 |
n.v. |
-0.32 |
n.v. |
|
39S ribosomal protein L22, mitochondrial precursor |
| 6755352 |
|
Mrpl23 |
|
3734 |
1286 |
0 |
1490 |
0 |
|
-0.02 |
-0.23 |
n.v. |
-0.25 |
n.v. |
|
39S ribosomal protein L23, mitochondrial |
| 153792729 |
|
Mrpl24 |
|
714 |
1768 |
0 |
0 |
0 |
|
-0.42 |
-0.16 |
n.v. |
n.v. |
n.v. |
|
39S ribosomal protein L24, mitochondrial precursor |
| 16716447 |
|
Mrpl27 |
|
1190 |
879 |
70 |
941 |
0 |
|
-0.22 |
-0.02 |
-0.54 |
-1.1 |
n.v. |
|
39S ribosomal protein L27, mitochondrial |
| 26787989 |
|
Mrpl28 |
|
0 |
3014 |
0 |
0 |
0 |
|
n.v. |
-0.16 |
n.v. |
n.v. |
n.v. |
|
39S ribosomal protein L28, mitochondrial |
| 31981470 |
|
Mrpl3 |
|
0 |
6233 |
0 |
712 |
0 |
|
n.v. |
-0.09 |
n.v. |
0.05 |
n.v. |
|
39S ribosomal protein L3, mitochondrial |
| 21312302 |
|
Mrpl30 |
|
0 |
904 |
0 |
295 |
0 |
|
n.v. |
-0.21 |
n.v. |
-0.44 |
n.v. |
|
39S ribosomal protein L30, mitochondrial precursor |
| 21312948 |
|
Mrpl32 |
|
201 |
69 |
0 |
0 |
0 |
|
1.04 |
-0.14 |
n.v. |
n.v. |
n.v. |
|
39S ribosomal protein L32, mitochondrial |
| 269784741 |
|
Mrpl33 |
|
0 |
697 |
0 |
0 |
0 |
|
n.v. |
-0.07 |
n.v. |
n.v. |
n.v. |
|
39S ribosomal protein L33, mitochondrial |
| 16716449 |
|
Mrpl34 |
|
0 |
1411 |
7 |
90 |
0 |
|
n.v. |
-0.07 |
-0.28 |
-0.25 |
n.v. |
|
39S ribosomal protein L34, mitochondrial |
| 22128625 |
|
Mrpl37 |
|
4503 |
6732 |
0 |
0 |
0 |
|
-0.47 |
-0.09 |
n.v. |
n.v. |
n.v. |
|
39S ribosomal protein L37, mitochondrial precursor |
| 124430535 |
|
Mrpl38 |
|
3698 |
2 |
0 |
0 |
0 |
|
0.08 |
-0.34 |
n.v. |
n.v. |
n.v. |
|
39S ribosomal protein L38, mitochondrial precursor |
| 364023817 |
|
Mrpl39 |
|
0 |
641 |
0 |
0 |
0 |
|
n.v. |
-0.43 |
n.v. |
n.v. |
n.v. |
|
39S ribosomal protein L39, mitochondrial |
| 119508437 |
|
Mrpl4 |
|
0 |
3083 |
0 |
589 |
0 |
|
n.v. |
-0.14 |
n.v. |
0.09 |
n.v. |
|
39S ribosomal protein L4, mitochondrial |
| 255003746 |
|
Mrpl40 |
|
1172 |
582 |
0 |
8 |
0 |
|
0.2 |
0.03 |
n.v. |
0.06 |
n.v. |
|
39S ribosomal protein L40, mitochondrial precursor |
| 113461980 |
|
Mrpl41 |
|
366 |
4140 |
0 |
0 |
0 |
|
-0.05 |
-0.37 |
n.v. |
n.v. |
n.v. |
|
39S ribosomal protein L41, mitochondrial precursor |
| 13385564 |
|
Mrpl42 |
|
0 |
434 |
0 |
0 |
0 |
|
n.v. |
-0.13 |
n.v. |
n.v. |
n.v. |
|
39S ribosomal protein L42, mitochondrial precursor |
| 17298676 |
|
Mrpl43 |
|
586 |
2555 |
0 |
0 |
0 |
|
-0.09 |
-0.08 |
n.v. |
n.v. |
n.v. |
|
39S ribosomal protein L43, mitochondrial |
| 124487075 |
|
Mrpl44 |
|
128 |
4085 |
108 |
0 |
0 |
|
0.25 |
-0.14 |
-0.49 |
n.v. |
n.v. |
|
39S ribosomal protein L44, mitochondrial precursor |
| 13385418 |
|
Mrpl45 |
|
0 |
1705 |
0 |
0 |
0 |
|
n.v. |
0.03 |
n.v. |
n.v. |
n.v. |
|
39S ribosomal protein L45, mitochondrial |
| 12963643 |
|
Mrpl46 |
|
5016 |
3856 |
117 |
688 |
0 |
|
-0.1 |
-0.17 |
-0.56 |
-0.61 |
n.v. |
|
39S ribosomal protein L46, mitochondrial |
| 29826332 |
|
Mrpl47 |
|
2947 |
1100 |
0 |
0 |
0 |
|
0.01 |
-0.14 |
n.v. |
n.v. |
n.v. |
|
39S ribosomal protein L47, mitochondrial |
| 148368964 |
|
Mrpl48 |
|
1281 |
2762 |
25 |
237 |
0 |
|
-0.1 |
-0.1 |
-0.46 |
-0.28 |
n.v. |
|
39S ribosomal protein L48, mitochondrial precursor |
| 13385752 |
|
Mrpl49 |
|
4540 |
2480 |
0 |
761 |
0 |
|
0.11 |
-0.37 |
n.v. |
-0.48 |
n.v. |
|
39S ribosomal protein L49, mitochondrial |
| 30519921 |
|
Mrpl50 |
|
0 |
92 |
0 |
0 |
0 |
|
n.v. |
-1.47 |
n.v. |
n.v. |
n.v. |
|
39S ribosomal protein L50, mitochondrial |
| 13385050 |
|
Mrpl51 |
|
0 |
173 |
0 |
0 |
0 |
|
n.v. |
-0.23 |
n.v. |
n.v. |
n.v. |
|
39S ribosomal protein L51, mitochondrial precursor |
| 21313040 |
|
Mrpl53 |
|
1574 |
2854 |
18 |
0 |
0 |
|
-0.05 |
-0.09 |
-0.54 |
n.v. |
n.v. |
|
39S ribosomal protein L53, mitochondrial |
| 21313400 |
|
Mrpl55 |
|
0 |
1687 |
0 |
0 |
0 |
|
n.v. |
-0.05 |
n.v. |
n.v. |
n.v. |
|
39S ribosomal protein L55, mitochondrial precursor |
| 29789253 |
|
Mrpl9 |
|
4393 |
1401 |
0 |
0 |
0 |
|
0.06 |
0.03 |
n.v. |
n.v. |
n.v. |
|
39S ribosomal protein L9, mitochondrial |
| 226246598 |
|
Mrps10 |
|
586 |
3313 |
0 |
65 |
0 |
|
0.05 |
0.04 |
n.v. |
-1.39 |
n.v. |
|
28S ribosomal protein S10, mitochondrial isoform 3 |
| 226246600 |
|
Mrps10 |
|
586 |
3313 |
0 |
65 |
0 |
|
0.05 |
0.04 |
n.v. |
-1.39 |
n.v. |
|
28S ribosomal protein S10, mitochondrial isoform 2 |
| 226246602 |
|
Mrps10 |
|
586 |
3313 |
0 |
65 |
0 |
|
0.05 |
0.04 |
n.v. |
-1.39 |
n.v. |
|
28S ribosomal protein S10, mitochondrial isoform 1 |
| 170650663 |
|
Mrps11 |
|
0 |
1488 |
0 |
819 |
0 |
|
n.v. |
0.05 |
n.v. |
-0.61 |
n.v. |
|
28S ribosomal protein S11, mitochondrial |
| 6755360 |
|
Mrps12 |
|
0 |
88 |
0 |
0 |
0 |
|
n.v. |
0.01 |
n.v. |
n.v. |
n.v. |
|
28S ribosomal protein S12, mitochondrial precursor |
| 13384894 |
|
Mrps14 |
|
0 |
574 |
0 |
778 |
0 |
|
n.v. |
-0.19 |
n.v. |
-0.3 |
n.v. |
|
28S ribosomal protein S14, mitochondrial |
| 48526512 |
|
Mrps15 |
|
1574 |
2142 |
0 |
0 |
0 |
|
0.14 |
0.05 |
n.v. |
n.v. |
n.v. |
|
28S ribosomal protein S15, mitochondrial precursor |
| 13384844 |
|
Mrps16 |
|
0 |
2705 |
0 |
0 |
0 |
|
n.v. |
-0.11 |
n.v. |
n.v. |
n.v. |
|
28S ribosomal protein S16, mitochondrial precursor |
| 13384854 |
|
Mrps17 |
|
1318 |
3108 |
0 |
622 |
0 |
|
0.18 |
-0.22 |
n.v. |
0.5 |
n.v. |
|
28S ribosomal protein S17, mitochondrial precursor |
| 17505206 |
|
Mrps18a |
|
531 |
985 |
0 |
262 |
0 |
|
-0.19 |
-0.13 |
n.v. |
-0.34 |
n.v. |
|
28S ribosomal protein S18a, mitochondrial precursor |
| 23956152 |
|
Mrps18b |
|
0 |
357 |
0 |
0 |
0 |
|
n.v. |
0.07 |
n.v. |
n.v. |
n.v. |
|
28S ribosomal protein S18b, mitochondrial |
| 260593696 |
|
Mrps2 |
|
5309 |
2257 |
0 |
303 |
0 |
|
-0.01 |
-0.01 |
n.v. |
0.04 |
n.v. |
|
28S ribosomal protein S2, mitochondrial isoform 1 |
| 260593698 |
|
Mrps2 |
|
5309 |
1240 |
0 |
303 |
0 |
|
-0.01 |
0.01 |
n.v. |
0.04 |
n.v. |
|
28S ribosomal protein S2, mitochondrial isoform 2 |
| 17505220 |
|
Mrps21 |
|
787 |
1428 |
0 |
278 |
0 |
|
0.16 |
-0.28 |
n.v. |
-0.31 |
n.v. |
|
28S ribosomal protein S21, mitochondrial |
| 13384904 |
|
Mrps22 |
|
4265 |
188 |
0 |
2840 |
0 |
|
-0.01 |
-0.11 |
n.v. |
-0.33 |
n.v. |
|
28S ribosomal protein S22, mitochondrial |
| 27228982 |
|
Mrps23 |
|
4961 |
4649 |
0 |
3978 |
0 |
|
-0.11 |
-0.06 |
n.v. |
-0.22 |
n.v. |
|
28S ribosomal protein S23, mitochondrial |
| 13385578 |
|
Mrps24 |
|
641 |
2209 |
0 |
254 |
0 |
|
0.06 |
-0.12 |
n.v. |
0.07 |
n.v. |
|
28S ribosomal protein S24, mitochondrial precursor |
| 31981257 |
|
Mrps25 |
|
275 |
100 |
0 |
0 |
0 |
|
0.15 |
-0.03 |
n.v. |
n.v. |
n.v. |
|
28S ribosomal protein S25, mitochondrial |
| 46402169 |
|
Mrps26 |
|
1574 |
3004 |
0 |
0 |
0 |
|
0.33 |
-0.22 |
n.v. |
n.v. |
n.v. |
|
28S ribosomal protein S26, mitochondrial precursor |
| 50980303 |
|
Mrps27 |
|
4284 |
4770 |
0 |
0 |
0 |
|
-0.5 |
-0.26 |
n.v. |
n.v. |
n.v. |
|
28S ribosomal protein S27, mitochondrial |
| 254587936 |
|
Mrps28 |
|
787 |
1476 |
0 |
65 |
0 |
|
0.06 |
-0.05 |
n.v. |
0.76 |
n.v. |
|
28S ribosomal protein S28, mitochondrial |
| 29789128 |
|
Mrps30 |
|
989 |
6269 |
0 |
0 |
0 |
|
-0.27 |
-0.21 |
n.v. |
n.v. |
n.v. |
|
28S ribosomal protein S30, mitochondrial |
| 10181116 |
|
Mrps31 |
|
1245 |
0 |
0 |
0 |
0 |
|
0.18 |
n.v. |
n.v. |
n.v. |
n.v. |
|
28S ribosomal protein S31, mitochondrial precursor |
| 33859564 |
|
Mrps33 |
|
2014 |
0 |
0 |
696 |
0 |
|
0.02 |
n.v. |
n.v. |
0.06 |
n.v. |
|
28S ribosomal protein S33, mitochondrial isoform 1 |
| 13385670 |
|
Mrps34 |
|
5986 |
9262 |
0 |
2046 |
0 |
|
-0.17 |
-0.11 |
n.v. |
-0.14 |
n.v. |
|
28S ribosomal protein S34, mitochondrial |
| 148235701 |
|
Mrps35 |
|
1355 |
273 |
0 |
336 |
0 |
|
0.07 |
0.17 |
n.v. |
-0.06 |
n.v. |
|
28S ribosomal protein S35, mitochondrial |
| 13384742 |
|
Mrps36 |
|
0 |
219 |
0 |
0 |
0 |
|
n.v. |
-0.09 |
n.v. |
n.v. |
n.v. |
|
28S ribosomal protein S36, mitochondrial isoform 1 |
| 298286543 |
|
Mrps36 |
|
0 |
48 |
0 |
0 |
0 |
|
n.v. |
0.07 |
n.v. |
n.v. |
n.v. |
|
28S ribosomal protein S36, mitochondrial isoform 2 |
| 17157985 |
|
Mrps5 |
|
3039 |
221 |
0 |
450 |
0 |
|
0.28 |
-0.43 |
n.v. |
0.18 |
n.v. |
|
28S ribosomal protein S5, mitochondrial |
| 23956244 |
|
Mrps6 |
|
2673 |
612 |
0 |
0 |
0 |
|
0.07 |
-0.13 |
n.v. |
n.v. |
n.v. |
|
28S ribosomal protein S6, mitochondrial |
| 30794474 |
|
Mrps7 |
|
12357 |
6288 |
82 |
1244 |
0 |
|
-0.05 |
-0.11 |
-0.18 |
-0.07 |
n.v. |
|
28S ribosomal protein S7, mitochondrial precursor |
| 169790909 |
|
Mrps9 |
|
16530 |
1628 |
0 |
720 |
0 |
|
-0.12 |
-0.02 |
n.v. |
-0.35 |
n.v. |
|
28S ribosomal protein S9, mitochondrial precursor |
| 21312752 |
|
Mrrf |
|
531 |
4131 |
0 |
0 |
0 |
|
0.37 |
-0.32 |
n.v. |
n.v. |
n.v. |
|
ribosome-recycling factor, mitochondrial precursor |
| 37537520 |
|
Mrto4 |
|
494 |
342 |
604 |
8652 |
0 |
|
0.16 |
0.2 |
0.13 |
0.03 |
n.v. |
|
mRNA turnover protein 4 homolog |
| 6678938 |
|
Msh2 |
|
8128 |
3532 |
5524 |
104980 |
61194 |
|
-0.28 |
0.11 |
-0.03 |
0.04 |
0.09 |
|
DNA mismatch repair protein Msh2 |
| 6754744 |
|
Msh6 |
|
5455 |
0 |
5631 |
152653 |
76369 |
|
-0.23 |
n.v. |
0.01 |
0 |
-0.02 |
|
DNA mismatch repair protein Msh6 |
| 6678940 |
|
Msi1 |
|
0 |
0 |
152 |
5337 |
0 |
|
n.v. |
n.v. |
0.52 |
0.17 |
n.v. |
|
RNA-binding protein Musashi homolog 1 |
| 17157989 |
|
Msi2 |
|
12119 |
1566 |
13533 |
22911 |
857 |
|
-0.17 |
0.3 |
0.15 |
0.29 |
-0.11 |
|
RNA-binding protein Musashi homolog 2 isoform 1 |
| 318843692 |
|
Msi2 |
|
12119 |
800 |
4744 |
9561 |
857 |
|
-0.17 |
0.1 |
0.25 |
0.28 |
-0.11 |
|
RNA-binding protein Musashi homolog 2 isoform 2 |
| 70778915 |
|
Msn |
|
719243 |
110956 |
284550 |
162704 |
257596 |
|
0.15 |
0.05 |
-0.21 |
0.01 |
0.01 |
|
moesin |
| 31981013 |
|
Msra |
|
0 |
0 |
0 |
0 |
8418 |
|
n.v. |
n.v. |
n.v. |
n.v. |
-0.09 |
|
mitochondrial peptide methionine sulfoxide reductase
isoform 1 |
| 358679363 |
|
Msra |
|
0 |
0 |
0 |
0 |
8418 |
|
n.v. |
n.v. |
n.v. |
n.v. |
-0.09 |
|
mitochondrial peptide methionine sulfoxide reductase
isoform 2 |
| 358679365 |
|
Msra |
|
0 |
0 |
0 |
0 |
8418 |
|
n.v. |
n.v. |
n.v. |
n.v. |
-0.09 |
|
mitochondrial peptide methionine sulfoxide reductase
isoform 3 |
| 358679367 |
|
Msra |
|
0 |
0 |
0 |
0 |
2228 |
|
n.v. |
n.v. |
n.v. |
n.v. |
-0.17 |
|
mitochondrial peptide methionine sulfoxide reductase
isoform 4 |
| 254826769 |
|
Mst1r |
|
0 |
1271 |
7879 |
0 |
2313 |
|
n.v. |
0.02 |
-0.17 |
n.v. |
-0.62 |
|
macrophage-stimulating protein receptor precursor |
| 254692960 |
|
Msto1 |
|
0 |
2841 |
1311 |
26988 |
38544 |
|
n.v. |
0.06 |
-0.08 |
0.12 |
0.18 |
|
protein misato homolog 1 |
| 7305285 |
|
Mt1 |
|
7872 |
6 |
701 |
0 |
2581 |
|
0.01 |
0.39 |
0 |
n.v. |
0.22 |
|
metallothionein-1 |
| 33468863 |
|
Mt2 |
|
9629 |
8 |
958 |
0 |
2067 |
|
0.04 |
0.52 |
-0.05 |
0.58 |
0.05 |
|
metallothionein-2 |
| 51491880 |
|
Mta2 |
|
259067 |
0 |
214 |
9610 |
739 |
|
-2.06 |
n.v. |
-0.23 |
-0.15 |
-0.16 |
|
metastasis-associated protein MTA2 |
| 45544618 |
|
Mtap |
|
0 |
2568 |
2114 |
9111 |
39529 |
|
n.v. |
0.16 |
0.17 |
0.29 |
0.05 |
|
S-methyl-5'-thioadenosine phosphorylase |
| 9845273 |
|
Mtch1 |
|
0 |
5041 |
88 |
0 |
0 |
|
n.v. |
-0.14 |
-0.21 |
n.v. |
n.v. |
|
mitochondrial carrier homolog 1 |
| 9790055 |
|
Mtch2 |
|
39047 |
41494 |
615 |
0 |
0 |
|
-0.02 |
-0.11 |
-0.24 |
n.v. |
n.v. |
|
mitochondrial carrier homolog 2 |
| 31982233 |
|
Mtdh |
|
5126 |
1319 |
0 |
0 |
0 |
|
0.2 |
-0.21 |
n.v. |
n.v. |
n.v. |
|
protein LYRIC |
| 46518496 |
|
Mterfd3 |
|
0 |
372 |
0 |
4355 |
0 |
|
n.v. |
0.16 |
n.v. |
0 |
n.v. |
|
mTERF domain-containing protein 3, mitochondrial
precursor |
| 70887769 |
|
Mtf2 |
|
4503 |
524 |
17863 |
0 |
0 |
|
-0.03 |
0.32 |
0.19 |
n.v. |
n.v. |
|
metal-response element-binding transcription factor 2
isoform 1 |
| 261878543 |
|
Mthfd1 |
|
28136 |
23075 |
134365 |
520970 |
282699 |
|
-0.05 |
0.1 |
0.08 |
0.11 |
0.03 |
|
C-1-tetrahydrofolate synthase, cytoplasmic |
| 283135110 |
|
Mthfd1l |
|
54680 |
13796 |
743 |
0 |
5537 |
|
-0.01 |
-0.21 |
-0.55 |
n.v. |
0.17 |
|
monofunctional C1-tetrahydrofolate synthase,
mitochondrial precursor |
| 262050633 |
|
Mthfsd |
|
0 |
0 |
101 |
1580 |
0 |
|
n.v. |
n.v. |
-0.07 |
-0.55 |
n.v. |
|
methenyltetrahydrofolate synthase domain-containing
protein isoform 1 |
| 27370130 |
|
Mthfsd |
|
0 |
0 |
101 |
1580 |
0 |
|
n.v. |
n.v. |
-0.07 |
-0.55 |
n.v. |
|
methenyltetrahydrofolate synthase domain-containing
protein isoform 2 |
| 110625866 |
|
Mtif2 |
|
0 |
714 |
0 |
0 |
0 |
|
n.v. |
-0.05 |
n.v. |
n.v. |
n.v. |
|
translation initiation factor IF-2, mitochondrial
precursor |
| 255958296 |
|
Mtm1 |
|
0 |
0 |
23 |
0 |
0 |
|
n.v. |
n.v. |
-0.07 |
n.v. |
n.v. |
|
myotubularin isoform 1 |
| 255958302 |
|
Mtm1 |
|
0 |
0 |
23 |
0 |
0 |
|
n.v. |
n.v. |
-0.07 |
n.v. |
n.v. |
|
myotubularin isoform 2 |
| 124028523 |
|
Mtmr10 |
|
0 |
0 |
54 |
0 |
0 |
|
n.v. |
n.v. |
-0.58 |
n.v. |
n.v. |
|
myotubularin-related protein 10 |
| 27370470 |
|
Mtmr12 |
|
0 |
0 |
0 |
3921 |
0 |
|
n.v. |
n.v. |
n.v. |
0.22 |
n.v. |
|
myotubularin-related protein 12 |
| 163937863 |
|
Mtmr14 |
|
0 |
109 |
129 |
98 |
0 |
|
n.v. |
0.04 |
-0.17 |
0.19 |
n.v. |
|
myotubularin-related protein 14 |
| 194394153 |
|
Mtmr2 |
|
0 |
0 |
0 |
1752 |
0 |
|
n.v. |
n.v. |
n.v. |
0.33 |
n.v. |
|
myotubularin-related protein 2 |
| 21450239 |
|
Mtmr6 |
|
0 |
0 |
114 |
0 |
0 |
|
n.v. |
n.v. |
0.38 |
n.v. |
n.v. |
|
myotubularin-related protein 6 |
| 171460946 |
|
Mto1 |
|
0 |
69 |
0 |
0 |
0 |
|
n.v. |
-0.19 |
n.v. |
n.v. |
n.v. |
|
protein MTO1 homolog, mitochondrial precursor |
| 227330586 |
|
Mtor |
|
0 |
1862 |
8433 |
10723 |
0 |
|
n.v. |
0.52 |
0.25 |
-0.14 |
n.v. |
|
serine/threonine-protein kinase mTOR |
| 6679961 |
|
Mtpn |
|
3533 |
916 |
2254 |
278 |
16782 |
|
-0.27 |
0.2 |
0.04 |
0.3 |
0.1 |
|
myotrophin |
| 241982740 |
|
Mtx1 |
|
7084 |
5254 |
484 |
0 |
118 |
|
-0.06 |
-0.27 |
-0.55 |
n.v. |
0.32 |
|
metaxin-1 isoform 1 |
| 241982742 |
|
Mtx1 |
|
7084 |
5569 |
484 |
0 |
118 |
|
-0.06 |
-0.27 |
-0.55 |
n.v. |
0.32 |
|
metaxin-1 isoform 2 |
| 228480241 |
|
Mtx2 |
|
4046 |
8304 |
724 |
0 |
0 |
|
0.11 |
-0.13 |
-0.39 |
n.v. |
n.v. |
|
metaxin-2 |
| 7305293 |
|
Muc1 |
|
0 |
1067 |
4623 |
0 |
900 |
|
n.v. |
-0.61 |
-0.49 |
n.v. |
-1.24 |
|
mucin-1 precursor |
| 167736365 |
|
Muc4 |
|
0 |
10 |
1661 |
909 |
1478 |
|
n.v. |
0.19 |
-0.48 |
-0.41 |
-0.22 |
|
mucin-4 precursor |
| 31982171 |
|
Mug1 |
|
0 |
0 |
111 |
3233 |
0 |
|
n.v. |
n.v. |
-0.07 |
-0.19 |
n.v. |
|
murinoglobulin-1 precursor |
| 153945747 |
|
Mug2 |
|
0 |
0 |
111 |
3233 |
0 |
|
n.v. |
n.v. |
-0.07 |
-0.19 |
n.v. |
|
murinoglobulin-2 precursor |
| 244792753 |
|
Mup1 |
|
0 |
4 |
18 |
2055 |
0 |
|
n.v. |
-0.52 |
-0.1 |
0.16 |
n.v. |
|
major urinary protein 1 isoform b precursor |
| 244792827 |
|
Mup1 |
|
0 |
4 |
18 |
2055 |
0 |
|
n.v. |
-0.52 |
-0.1 |
0.16 |
n.v. |
|
major urinary protein 1 isoform a precursor |
| 317008598 |
|
Mup12 |
|
0 |
4 |
18 |
2055 |
0 |
|
n.v. |
-0.52 |
-0.1 |
0.16 |
n.v. |
|
major urinary protein 12 precursor |
| 317008616 |
|
Mup15 |
|
0 |
4 |
18 |
2055 |
0 |
|
n.v. |
-0.52 |
-0.1 |
0.16 |
n.v. |
|
major urinary protein 15 precursor |
| 197927289 |
|
Mup7 |
|
0 |
4 |
18 |
2055 |
0 |
|
n.v. |
-0.52 |
-0.1 |
0.16 |
n.v. |
|
major urinary protein 7 precursor |
| 148540106 |
|
Mut |
|
0 |
2586 |
0 |
0 |
0 |
|
n.v. |
-0.3 |
n.v. |
n.v. |
n.v. |
|
methylmalonyl-CoA mutase, mitochondrial precursor |
| 21312058 |
|
Mvb12a |
|
0 |
919 |
190 |
2447 |
632 |
|
n.v. |
0.16 |
0.34 |
-0.33 |
0.23 |
|
multivesicular body subunit 12A |
| 256985114 |
|
Mvd |
|
0 |
144 |
372 |
0 |
12519 |
|
n.v. |
-0.24 |
0.15 |
n.v. |
0.15 |
|
diphosphomevalonate decarboxylase |
| 12963731 |
|
Mvk |
|
0 |
0 |
0 |
0 |
3898 |
|
n.v. |
n.v. |
n.v. |
n.v. |
0.13 |
|
mevalonate kinase |
| 239052674 |
|
Mvp |
|
1208 |
800 |
12406 |
284383 |
0 |
|
0.11 |
-0.17 |
0.16 |
0.12 |
n.v. |
|
major vault protein |
| 148271069 |
|
Myadm |
|
0 |
956 |
8524 |
1539 |
0 |
|
n.v. |
0.19 |
-0.03 |
-0.47 |
n.v. |
|
myeloid-associated differentiation marker |
| 31982724 |
|
Mybbp1a |
|
311513 |
50 |
9122 |
14578 |
0 |
|
-0.06 |
-0.08 |
-0.28 |
-0.5 |
n.v. |
|
myb-binding protein 1A |
| 84871978 |
|
Mycbp |
|
1153 |
566 |
4352 |
13555 |
31068 |
|
0 |
0.06 |
0.2 |
-0.01 |
-0.18 |
|
C-Myc-binding protein |
| 127141012 |
|
Mycbp2 |
|
0 |
211 |
597 |
3225 |
0 |
|
n.v. |
-0.68 |
0.13 |
0.05 |
n.v. |
|
probable E3 ubiquitin-protein ligase MYCBP2 |
| 168229259 |
|
Mycbpap |
|
0 |
0 |
0 |
0 |
1167 |
|
n.v. |
n.v. |
n.v. |
n.v. |
0.09 |
|
MYCBP-associated protein |
| 6754772 |
|
Myd88 |
|
0 |
186 |
47 |
0 |
964 |
|
n.v. |
0.42 |
-0.18 |
n.v. |
0.13 |
|
myeloid differentiation primary response protein MyD88 |
| 244790087 |
|
Myef2 |
|
6627 |
2392 |
196 |
1523 |
0 |
|
0.19 |
-0.31 |
-0.07 |
-0.55 |
n.v. |
|
myelin expression factor 2 isoform 1 |
| 244790091 |
|
Myef2 |
|
6627 |
2392 |
196 |
1523 |
0 |
|
0.19 |
-0.31 |
-0.07 |
-0.55 |
n.v. |
|
myelin expression factor 2 isoform 2 |
| 244790095 |
|
Myef2 |
|
6627 |
2392 |
196 |
1523 |
0 |
|
0.19 |
-0.31 |
-0.07 |
-0.55 |
n.v. |
|
myelin expression factor 2 isoform 3 |
| 11096332 |
|
Myg1 |
|
0 |
6874 |
11904 |
5026 |
171352 |
|
n.v. |
-0.1 |
-0.05 |
0.07 |
0.01 |
|
UPF0160 protein MYG1, mitochondrial precursor |
| 82524274 |
|
Myh1 |
|
1538 |
2092 |
1544 |
85138 |
21740 |
|
0.02 |
0.27 |
0.03 |
0.07 |
0.11 |
|
myosin-1 |
| 33598964 |
|
Myh10 |
|
240468 |
62012 |
88670 |
1524700 |
685408 |
|
-0.05 |
0.3 |
0.14 |
0.15 |
-0.04 |
|
myosin-10 |
| 241982716 |
|
Myh11 |
|
152654 |
33283 |
62018 |
746679 |
409232 |
|
-0.06 |
0.25 |
0.08 |
0.11 |
0.02 |
|
myosin-11 isoform 1 |
| 241982718 |
|
Myh11 |
|
152654 |
33283 |
62018 |
752442 |
409307 |
|
-0.06 |
0.25 |
0.08 |
0.11 |
0.01 |
|
myosin-11 isoform 2 |
| 124486959 |
|
Myh13 |
|
1538 |
2092 |
1544 |
85138 |
21740 |
|
0.02 |
0.27 |
0.03 |
0.07 |
0.11 |
|
myosin-13 |
| 29336026 |
|
Myh14 |
|
58945 |
19024 |
37888 |
516550 |
244937 |
|
-0.05 |
0.19 |
0.09 |
0.13 |
-0.07 |
|
myosin-14 isoform 3 |
| 408821450 |
|
Myh14 |
|
58945 |
19024 |
37888 |
501505 |
288396 |
|
-0.05 |
0.19 |
0.09 |
0.13 |
-0.07 |
|
myosin-14 isoform 1 |
| 408821455 |
|
Myh14 |
|
58945 |
19024 |
37888 |
509813 |
284145 |
|
-0.05 |
0.19 |
0.09 |
0.13 |
-0.05 |
|
myosin-14 isoform 2 |
| 261245016 |
|
Myh15 |
|
1538 |
2092 |
1697 |
85138 |
21740 |
|
0.02 |
0.27 |
0.02 |
0.07 |
0.11 |
|
myosin-15 |
| 205830428 |
|
Myh2 |
|
1538 |
2092 |
1544 |
85138 |
21740 |
|
0.02 |
0.27 |
0.03 |
0.07 |
0.11 |
|
myosin heavy chain IIa |
| 153792649 |
|
Myh3 |
|
1538 |
2092 |
1544 |
85138 |
21740 |
|
0.02 |
0.27 |
0.03 |
0.07 |
0.11 |
|
myosin-3 |
| 67189167 |
|
Myh4 |
|
1538 |
2092 |
1544 |
85138 |
21740 |
|
0.02 |
0.27 |
0.03 |
0.07 |
0.11 |
|
myosin-4 |
| 255918225 |
|
Myh6 |
|
1538 |
2092 |
1544 |
85138 |
21740 |
|
0.02 |
0.27 |
0.03 |
0.07 |
0.11 |
|
myosin-6 |
| 18859641 |
|
Myh7 |
|
1538 |
2092 |
1544 |
87545 |
21740 |
|
0.02 |
0.27 |
0.03 |
0.07 |
0.11 |
|
myosin-7 |
| 145864471 |
|
Myh7b |
|
8512 |
2092 |
1544 |
85138 |
21740 |
|
0.02 |
0.27 |
0.03 |
0.07 |
0.11 |
|
myosin-7B |
| 71143152 |
|
Myh8 |
|
1538 |
2092 |
1544 |
85138 |
21740 |
|
0.02 |
0.27 |
0.03 |
0.07 |
0.11 |
|
myosin-8 |
| 114326446 |
|
Myh9 |
|
1003920 |
239989 |
471176 |
7573676 |
3296889 |
|
-0.03 |
0.21 |
0.09 |
0.13 |
-0.05 |
|
myosin-9 isoform 1 |
| 164664497 |
|
Myl1 |
|
751 |
5653 |
9361 |
40748 |
38329 |
|
0.09 |
0.5 |
0.21 |
0.2 |
0 |
|
myosin light chain 1/3, skeletal muscle isoform isoform
3f |
| 29789016 |
|
Myl1 |
|
751 |
5653 |
9361 |
40748 |
38329 |
|
0.09 |
0.5 |
0.21 |
0.2 |
0 |
|
myosin light chain 1/3, skeletal muscle isoform isoform
1f |
| 146229342 |
|
Myl10 |
|
0 |
0 |
0 |
0 |
835 |
|
n.v. |
n.v. |
n.v. |
n.v. |
0.03 |
|
myosin regulatory light chain 10 isoform 1 |
| 71037403 |
|
Myl12a |
|
126275 |
12849 |
47454 |
70330 |
109922 |
|
0.05 |
0.28 |
0.09 |
0.14 |
-0.11 |
|
myosin light chain, regulatory B-like |
| 21728376 |
|
Myl12b |
|
125689 |
12849 |
47447 |
70109 |
109912 |
|
0.05 |
0.28 |
0.08 |
0.15 |
-0.11 |
|
myosin regulatory light chain 12B |
| 33563264 |
|
Myl3 |
|
751 |
5653 |
9361 |
40748 |
38329 |
|
0.09 |
0.5 |
0.21 |
0.2 |
0 |
|
myosin light chain 3 |
| 33620739 |
|
Myl6 |
|
152800 |
51336 |
98328 |
220642 |
304386 |
|
0.08 |
0.28 |
0.13 |
0.11 |
-0.06 |
|
myosin light polypeptide 6 |
| 26986555 |
|
Myl6b |
|
72528 |
17475 |
32091 |
7989 |
12669 |
|
0.01 |
0.17 |
0.03 |
-0.32 |
-0.26 |
|
myosin light chain 6B |
| 198278553 |
|
Myl9 |
|
52795 |
6922 |
31603 |
50415 |
88439 |
|
0.01 |
0.16 |
0.07 |
0.08 |
-0.11 |
|
myosin regulatory light polypeptide 9 |
| 126157499 |
|
Mylk |
|
17537 |
2891 |
5872 |
8906 |
130581 |
|
0.03 |
0.57 |
0.31 |
-0.02 |
-0.15 |
|
myosin light chain kinase, smooth muscle |
| 163644275 |
|
Mylk2 |
|
0 |
1937 |
3541 |
8865 |
42742 |
|
n.v. |
0.02 |
-0.01 |
-0.03 |
-0.07 |
|
myosin light chain kinase 2, skeletal/cardiac muscle |
| 83776559 |
|
Mylk3 |
|
0 |
1937 |
3541 |
8865 |
42742 |
|
n.v. |
0.02 |
-0.01 |
-0.03 |
-0.07 |
|
putative myosin light chain kinase 3 |
| 260447058 |
|
Mylk4 |
|
0 |
1937 |
3541 |
8865 |
42742 |
|
n.v. |
0.02 |
-0.01 |
-0.03 |
-0.07 |
|
myosin light chain kinase family member 4 |
| 130507685 |
|
Myo10 |
|
0 |
0 |
179 |
0 |
4037 |
|
n.v. |
n.v. |
-0.04 |
n.v. |
-0.2 |
|
unconventional myosin-X |
| 157041244 |
|
Myo15 |
|
81114 |
4062 |
32161 |
330312 |
0 |
|
0.03 |
0.03 |
0.19 |
-0.23 |
n.v. |
|
unconventional myosin-XV isoform 1 |
| 157041246 |
|
Myo15 |
|
81114 |
4062 |
32161 |
330312 |
0 |
|
0.03 |
0.03 |
0.19 |
-0.23 |
n.v. |
|
unconventional myosin-XV isoform 2a |
| 157041248 |
|
Myo15 |
|
81114 |
4062 |
32161 |
330312 |
0 |
|
0.03 |
0.03 |
0.19 |
-0.23 |
n.v. |
|
unconventional myosin-XV isoform 3 |
| 22094119 |
|
Myo18a |
|
1959 |
13011 |
9017 |
124118 |
0 |
|
0.39 |
0.07 |
-0.15 |
-0.06 |
n.v. |
|
unconventional myosin-XVIIIa |
| 254939539 |
|
Myo19 |
|
0 |
81 |
0 |
0 |
0 |
|
n.v. |
-0.77 |
n.v. |
n.v. |
n.v. |
|
unconventional myosin-XIX |
| 124487037 |
|
Myo1a |
|
0 |
0 |
75 |
0 |
0 |
|
n.v. |
n.v. |
-0.32 |
n.v. |
n.v. |
|
unconventional myosin-Ia |
| 240120042 |
|
Myo1b |
|
0 |
0 |
1307 |
0 |
0 |
|
n.v. |
n.v. |
-0.14 |
n.v. |
n.v. |
|
unconventional myosin-Ib isoform 1 |
| 86990450 |
|
Myo1b |
|
0 |
0 |
1307 |
0 |
0 |
|
n.v. |
n.v. |
-0.14 |
n.v. |
n.v. |
|
unconventional myosin-Ib isoform 2 |
| 124494244;6678986 |
|
Myo1c |
|
36264 |
0 |
56745 |
0 |
0 |
|
0.22 |
n.v. |
-0.03 |
n.v. |
n.v. |
|
unconventional myosin-Ic isoform b |
| 6678986 |
|
Myo1c |
|
0 |
5244 |
0 |
39004 |
45890 |
|
n.v. |
0.1 |
n.v. |
0.06 |
-0.01 |
|
unconventional myosin-Ic isoform b |
| 124494242 |
|
Myo1c |
|
36264 |
5244 |
58571 |
39004 |
45890 |
|
0.22 |
0.1 |
-0.03 |
0.06 |
-0.01 |
|
unconventional myosin-Ic isoform a |
| 118026911 |
|
Myo1d |
|
659 |
33 |
20333 |
696 |
0 |
|
0.19 |
0.1 |
-0.24 |
-0.42 |
n.v. |
|
unconventional myosin-Id |
| 407261730 |
|
Myo1e |
|
0 |
251 |
947 |
40764 |
19352 |
|
n.v. |
0.24 |
-0.05 |
0.06 |
-0.13 |
|
PREDICTED: unconventional myosin-Ie |
| 68299824 |
|
Myo1e |
|
0 |
251 |
947 |
41828 |
19352 |
|
n.v. |
0.24 |
-0.05 |
0.06 |
-0.13 |
|
unconventional myosin-Ie |
| 255069756 |
|
Myo1f |
|
0 |
25 |
395 |
11124 |
8311 |
|
n.v. |
0.43 |
-0.11 |
0.05 |
-0.12 |
|
unconventional myosin-If |
| 266458101 |
|
Myo1g |
|
0 |
0 |
872 |
0 |
0 |
|
n.v. |
n.v. |
-0.43 |
n.v. |
n.v. |
|
unconventional myosin-Ig |
| 111120334 |
|
Myo3b |
|
0 |
0 |
111 |
0 |
0 |
|
n.v. |
n.v. |
-0.03 |
n.v. |
n.v. |
|
myosin-IIIb |
| 115511052 |
|
Myo5a |
|
0 |
61 |
1174 |
254 |
0 |
|
n.v. |
0.2 |
-0.01 |
0.34 |
n.v. |
|
unconventional myosin-Va |
| 46399202 |
|
Myo5b |
|
0 |
61 |
1074 |
254 |
0 |
|
n.v. |
0.2 |
-0.01 |
0.34 |
n.v. |
|
unconventional myosin-Vb |
| 124486759 |
|
Myo5c |
|
0 |
136 |
3562 |
3954 |
129 |
|
n.v. |
0.07 |
0.17 |
0.02 |
0.13 |
|
myosin-Vc |
| 261823961 |
|
Myo6 |
|
32457 |
15022 |
40130 |
191452 |
593713 |
|
0.26 |
0.22 |
0.02 |
0.18 |
0.02 |
|
unconventional myosin-VI |
| 115511010 |
|
Myo7a |
|
0 |
0 |
66 |
0 |
0 |
|
n.v. |
n.v. |
-0.14 |
n.v. |
n.v. |
|
unconventional myosin-VIIa isoform 2 |
| 367460064 |
|
Myo7a |
|
0 |
0 |
66 |
0 |
0 |
|
n.v. |
n.v. |
-0.14 |
n.v. |
n.v. |
|
unconventional myosin-VIIa isoform 1 |
| 367460066 |
|
Myo7a |
|
0 |
0 |
66 |
0 |
0 |
|
n.v. |
n.v. |
-0.14 |
n.v. |
n.v. |
|
unconventional myosin-VIIa isoform 3 |
| 367460068 |
|
Myo7a |
|
0 |
0 |
66 |
0 |
0 |
|
n.v. |
n.v. |
-0.14 |
n.v. |
n.v. |
|
unconventional myosin-VIIa isoform 4 |
| 124053459 |
|
Myo9b |
|
0 |
0 |
31 |
8 |
0 |
|
n.v. |
n.v. |
0.06 |
2.76 |
n.v. |
|
unconventional myosin-IXb isoform 3 |
| 215272382 |
|
Myo9b |
|
0 |
0 |
31 |
8 |
0 |
|
n.v. |
n.v. |
0.06 |
2.76 |
n.v. |
|
unconventional myosin-IXb isoform 1 |
| 215272384 |
|
Myo9b |
|
0 |
0 |
31 |
8 |
0 |
|
n.v. |
n.v. |
0.06 |
2.76 |
n.v. |
|
unconventional myosin-IXb isoform 2 |
| 153791796 |
|
Myof |
|
101031 |
52962 |
142821 |
44153 |
0 |
|
0.11 |
0.1 |
0.05 |
-0.19 |
n.v. |
|
myoferlin |
| 85701616 |
|
Myzap |
|
0 |
8 |
0 |
0 |
0 |
|
n.v. |
0.54 |
n.v. |
0.6 |
1.18 |
|
myocardial zonula adherens protein precursor |
| 30424884 |
|
Mzt1 |
|
18 |
0 |
258 |
0 |
0 |
|
0.18 |
n.v. |
0.17 |
n.v. |
n.v. |
|
mitotic-spindle organizing protein 1 |
| 21312988 |
|
Mzt2 |
|
0 |
23 |
26 |
1089 |
0 |
|
n.v. |
1.04 |
0.79 |
0.4 |
n.v. |
|
mitotic-spindle organizing protein 2 |
| 67906816 |
|
N4bp2 |
|
0 |
0 |
32 |
74 |
0 |
|
n.v. |
n.v. |
-0.17 |
0.3 |
n.v. |
|
Nedd4 binding protein 2 |
| 158186629 |
|
N4bp2l2 |
|
2087 |
0 |
559 |
3070 |
0 |
|
-0.09 |
n.v. |
-0.03 |
0.18 |
n.v. |
|
NEDD4-binding protein 2-like 2 |
| 39540506 |
|
N6amt1 |
|
0 |
63 |
48 |
0 |
6608 |
|
n.v. |
0.33 |
0.09 |
n.v. |
0.16 |
|
N6-DNA methyltransferase A isoform 1 |
| 13386022 |
|
N6amt2 |
|
0 |
0 |
0 |
0 |
685 |
|
n.v. |
n.v. |
n.v. |
n.v. |
0.5 |
|
N(6)-adenine-specific DNA methyltransferase 2 |
| 9845236 |
|
Naa10 |
|
0 |
0 |
4356 |
21765 |
2013 |
|
n.v. |
n.v. |
-0.03 |
-0.05 |
0.61 |
|
N-alpha-acetyltransferase 10 isoform 1 |
| 295789090 |
|
Naa10 |
|
1062 |
2 |
3695 |
6491 |
289 |
|
-0.14 |
-0.05 |
-0.01 |
-0.03 |
0.14 |
|
N-alpha-acetyltransferase 10 isoform 2 |
| 85701706 |
|
Naa11 |
|
0 |
0 |
2729 |
6475 |
203 |
|
n.v. |
n.v. |
-0.02 |
0.03 |
0.82 |
|
N-alpha-acetyltransferase 11 |
| 225543482 |
|
Naa15 |
|
0 |
5146 |
58439 |
67040 |
6458 |
|
n.v. |
0.19 |
0.04 |
0.03 |
-0.11 |
|
N-alpha-acetyltransferase 15, NatA auxiliary subunit |
| 21313242 |
|
Naa16 |
|
0 |
570 |
12527 |
18532 |
375 |
|
n.v. |
0.27 |
0.01 |
0.03 |
-0.14 |
|
N-alpha-acetyltransferase 16, NatA auxiliary subunit |
| 13385922 |
|
Naa20 |
|
0 |
305 |
2562 |
4592 |
1189 |
|
n.v. |
0.14 |
-0.07 |
0.03 |
0.01 |
|
N-alpha-acetyltransferase 20 isoform 2 |
| 213972579 |
|
Naa20 |
|
0 |
305 |
2562 |
4592 |
1189 |
|
n.v. |
0.14 |
-0.07 |
0.03 |
0.01 |
|
N-alpha-acetyltransferase 20 isoform 1 |
| 55742803 |
|
Naa25 |
|
0 |
0 |
32025 |
3340 |
4295 |
|
n.v. |
n.v. |
0 |
-0.07 |
0.1 |
|
N-alpha-acetyltransferase 25, NatB auxiliary subunit |
| 124487477 |
|
Naa30 |
|
0 |
0 |
3701 |
778 |
2356 |
|
n.v. |
n.v. |
0.13 |
-0.12 |
0.05 |
|
N-alpha-acetyltransferase 30 |
| 172072615 |
|
Naa35 |
|
0 |
0 |
11907 |
1760 |
0 |
|
n.v. |
n.v. |
-0.03 |
0.1 |
n.v. |
|
N-alpha-acetyltransferase 35, NatC auxiliary subunit |
| 19527156 |
|
Naa38 |
|
2069 |
205 |
536 |
23730 |
0 |
|
-0.04 |
0.13 |
-0.03 |
0.01 |
n.v. |
|
N-alpha-acetyltransferase 38, NatC auxiliary subunit |
| 254588079 |
|
Naa40 |
|
29216 |
0 |
449 |
516 |
0 |
|
-0.16 |
n.v. |
0.03 |
-0.19 |
n.v. |
|
N-alpha-acetyltransferase 40 |
| 21312422 |
|
Naa50 |
|
696 |
2246 |
17753 |
43334 |
10067 |
|
0 |
0.24 |
0.03 |
0.06 |
-0.08 |
|
N-alpha-acetyltransferase 50 |
| 255683418 |
|
Naaa |
|
0 |
8 |
0 |
0 |
0 |
|
n.v. |
-0.62 |
n.v. |
n.v. |
n.v. |
|
N-acylethanolamine-hydrolyzing acid amidase isoform 1
precursor |
| 255683420 |
|
Naaa |
|
0 |
8 |
0 |
0 |
0 |
|
n.v. |
-0.62 |
n.v. |
n.v. |
n.v. |
|
N-acylethanolamine-hydrolyzing acid amidase isoform 2
precursor |
| 309264701 |
|
Naaladl2 |
|
549 |
0 |
4014 |
0 |
0 |
|
0.22 |
n.v. |
0.14 |
n.v. |
n.v. |
|
PREDICTED: N-acetylated alpha-linked acidic
dipeptidase-like 2 isoform 2 |
| 28076937 |
|
Nabp2 |
|
0 |
0 |
0 |
1432 |
0 |
|
n.v. |
n.v. |
n.v. |
-0.11 |
n.v. |
|
SOSS complex subunit B1 |
| 163965357 |
|
Naca |
|
87393 |
34060 |
122544 |
197100 |
150704 |
|
0.03 |
0.13 |
-0.03 |
-0.08 |
-0.06 |
|
nascent polypeptide-associated complex subunit alpha
isoform a |
| 41350312 |
|
Naca |
|
87393 |
34060 |
122278 |
194792 |
150704 |
|
0.03 |
0.13 |
-0.03 |
-0.08 |
-0.06 |
|
nascent polypeptide-associated complex subunit alpha
isoform b |
| 146134392 |
|
Nadk2 |
|
0 |
1791 |
0 |
0 |
0 |
|
n.v. |
-0.21 |
n.v. |
n.v. |
n.v. |
|
NAD kinase domain-containing protein 1 isoform 1 |
| 146134519 |
|
Nadk2 |
|
0 |
1791 |
0 |
0 |
0 |
|
n.v. |
-0.21 |
n.v. |
n.v. |
n.v. |
|
NAD kinase domain-containing protein 1 isoform 2 |
| 21313534 |
|
Nadsyn1 |
|
0 |
0 |
0 |
3217 |
0 |
|
n.v. |
n.v. |
n.v. |
0.25 |
n.v. |
|
glutamine-dependent NAD(+) synthetase |
| 21450341 |
|
Nae1 |
|
0 |
207 |
1678 |
0 |
13965 |
|
n.v. |
0 |
0.19 |
n.v. |
0.07 |
|
NEDD8-activating enzyme E1 regulatory subunit |
| 168693635 |
|
Naga |
|
207407 |
59824 |
34877 |
17943 |
66463 |
|
0.07 |
-0.02 |
-0.19 |
-0.15 |
-0.17 |
|
alpha-N-acetylgalactosaminidase precursor |
| 255958271 |
|
Nagk |
|
0 |
0 |
483 |
164 |
17703 |
|
n.v. |
n.v. |
0.05 |
-0.47 |
0.11 |
|
N-acetyl-D-glucosamine kinase isoform 2 |
| 9506739 |
|
Nagk |
|
0 |
0 |
483 |
164 |
17703 |
|
n.v. |
n.v. |
0.05 |
-0.47 |
0.11 |
|
N-acetyl-D-glucosamine kinase isoform 1 |
| 254910995 |
|
Naglu |
|
49426 |
21090 |
17907 |
60966 |
600 |
|
-0.04 |
-0.05 |
-0.24 |
-0.12 |
0.18 |
|
alpha-N-acetylglucosaminidase precursor |
| 187133241 |
|
Naip2 |
|
0 |
215 |
0 |
3070 |
0 |
|
n.v. |
0.36 |
n.v. |
0.04 |
n.v. |
|
baculoviral IAP repeat-containing protein 1b |
| 257153454 |
|
Nampt |
|
3442 |
16815 |
10596 |
43261 |
358779 |
|
0.3 |
0.23 |
0.08 |
0.25 |
0.01 |
|
nicotinamide phosphoribosyltransferase |
| 13385586 |
|
Nanp |
|
0 |
0 |
80 |
0 |
4337 |
|
n.v. |
n.v. |
-1.19 |
n.v. |
0.04 |
|
N-acylneuraminate-9-phosphatase |
| 16716467 |
|
Nans |
|
0 |
35 |
4643 |
8341 |
78008 |
|
n.v. |
0.41 |
0.01 |
0.14 |
0.11 |
|
sialic acid synthase |
| 226443026 |
|
Nap1l1 |
|
2160 |
1660 |
4579 |
12025 |
102629 |
|
-0.11 |
0.32 |
0.02 |
0.2 |
0.04 |
|
nucleosome assembly protein 1-like 1 isoform 1 |
| 7657357 |
|
Nap1l1 |
|
2160 |
1660 |
4579 |
12819 |
102629 |
|
-0.11 |
0.32 |
0.02 |
0.21 |
0.04 |
|
nucleosome assembly protein 1-like 1 isoform 2 |
| 6679012 |
|
Nap1l4 |
|
0 |
2816 |
3461 |
19072 |
120514 |
|
n.v. |
0.14 |
0.07 |
0.13 |
0.04 |
|
nucleosome assembly protein 1-like 4 |
| 13385392 |
|
Napa |
|
19844 |
26463 |
14847 |
29419 |
0 |
|
0.07 |
-0.02 |
-0.05 |
0.01 |
n.v. |
|
alpha-soluble NSF attachment protein |
| 29789104 |
|
Napb |
|
6700 |
1841 |
1737 |
3986 |
0 |
|
0.02 |
0.03 |
0.02 |
0.02 |
n.v. |
|
beta-soluble NSF attachment protein |
| 110625902 |
|
Napg |
|
0 |
38 |
3148 |
0 |
0 |
|
n.v. |
-0.17 |
-0.09 |
n.v. |
n.v. |
|
gamma-soluble NSF attachment protein |
| 6680552 |
|
Napsa |
|
0 |
6924 |
3756 |
0 |
0 |
|
n.v. |
0.06 |
-0.27 |
n.v. |
n.v. |
|
napsin-A precursor |
| 163954939 |
|
Narf |
|
0 |
0 |
0 |
0 |
1863 |
|
n.v. |
n.v. |
n.v. |
n.v. |
0.82 |
|
nuclear prelamin A recognition factor |
| 254911120 |
|
Narfl |
|
0 |
0 |
0 |
0 |
8257 |
|
n.v. |
n.v. |
n.v. |
n.v. |
0.17 |
|
cytosolic Fe-S cluster assembly factor NARFL |
| 219275596 |
|
Nars |
|
0 |
13571 |
10567 |
82666 |
17585 |
|
n.v. |
0.06 |
0.03 |
0.15 |
-0.01 |
|
asparagine--tRNA ligase, cytoplasmic isoform 2 |
| 219276601 |
|
Nars |
|
0 |
13571 |
10567 |
82666 |
17585 |
|
n.v. |
0.06 |
0.03 |
0.15 |
-0.01 |
|
asparagine--tRNA ligase, cytoplasmic isoform 1 |
| 125490378 |
|
Nasp |
|
0 |
545 |
1190 |
0 |
225874 |
|
n.v. |
0.13 |
0.16 |
n.v. |
0.01 |
|
nuclear autoantigenic sperm protein isoform 2 |
| 126090505 |
|
Nasp |
|
0 |
194 |
748 |
0 |
115845 |
|
n.v. |
-0.11 |
0.19 |
n.v. |
0.01 |
|
nuclear autoantigenic sperm protein isoform 1 |
| 23346561 |
|
Nat10 |
|
1831 |
0 |
101 |
458 |
0 |
|
-0.26 |
n.v. |
-0.38 |
-0.53 |
n.v. |
|
N-acetyltransferase 10 |
| 6754794 |
|
Nat2 |
|
0 |
0 |
0 |
0 |
396 |
|
n.v. |
n.v. |
n.v. |
n.v. |
-0.1 |
|
arylamine N-acetyltransferase 2 |
| 13384782 |
|
Nat9 |
|
0 |
0 |
0 |
0 |
675 |
|
n.v. |
n.v. |
n.v. |
n.v. |
0.44 |
|
N-acetyltransferase 9 |
| 167466222 |
|
Nav2 |
|
0 |
0 |
0 |
0 |
18538 |
|
n.v. |
n.v. |
n.v. |
n.v. |
0.17 |
|
neuron navigator 2 isoform 1 |
| 167466226 |
|
Nav2 |
|
0 |
0 |
0 |
0 |
18538 |
|
n.v. |
n.v. |
n.v. |
n.v. |
0.17 |
|
neuron navigator 2 isoform 2 |
| 255003837 |
|
Nbas |
|
0 |
687 |
25 |
0 |
0 |
|
n.v. |
-0.25 |
-0.36 |
n.v. |
n.v. |
|
neuroblastoma-amplified protein |
| 158854037 |
|
Nbea |
|
3808 |
4659 |
8443 |
51512 |
133965 |
|
-0.3 |
0.09 |
-0.05 |
-0.02 |
0.07 |
|
neurobeachin |
| 153791557 |
|
Nbeal1 |
|
0 |
0 |
26 |
229 |
17596 |
|
n.v. |
n.v. |
-0.79 |
-1.16 |
-1.59 |
|
neurobeachin like 1 |
| 254911027 |
|
Nbeal2 |
|
0 |
236 |
1453 |
21684 |
19502 |
|
n.v. |
0.48 |
0.12 |
0.17 |
0.07 |
|
neurobeachin-like protein 2 |
| 31324569 |
|
Ncald |
|
0 |
655 |
517 |
589 |
0 |
|
n.v. |
0.11 |
0.01 |
0.27 |
n.v. |
|
neurocalcin-delta |
| 22165392 |
|
Ncapd2 |
|
0 |
0 |
1320 |
15160 |
10870 |
|
n.v. |
n.v. |
0.1 |
0.18 |
-0.18 |
|
condensin complex subunit 1 |
| 161016797 |
|
Ncapd3 |
|
55 |
0 |
10179 |
2431 |
0 |
|
0.47 |
n.v. |
0.04 |
0.16 |
n.v. |
|
condensin-2 complex subunit D3 |
| 169234780 |
|
Ncapg |
|
4503 |
524 |
15505 |
16756 |
3127 |
|
-0.03 |
0.32 |
0.19 |
0.04 |
-0.07 |
|
condensin complex subunit 3 |
| 91208439 |
|
Ncapg2 |
|
0 |
142 |
9718 |
4551 |
0 |
|
n.v. |
0.13 |
-0.05 |
-0.03 |
n.v. |
|
condensin-2 complex subunit G2 |
| 295389521 |
|
Ncaph |
|
0 |
6 |
41 |
2104 |
332 |
|
n.v. |
0.5 |
0.3 |
0.17 |
-0.24 |
|
condensin complex subunit 2 |
| 169646203 |
|
Ncaph2 |
|
0 |
0 |
10755 |
1318 |
118 |
|
n.v. |
n.v. |
-0.05 |
0.26 |
-0.31 |
|
condensin-2 complex subunit H2 isoform a |
| 409971409 |
|
Ncaph2 |
|
0 |
0 |
10755 |
1318 |
118 |
|
n.v. |
n.v. |
-0.05 |
0.26 |
-0.31 |
|
condensin-2 complex subunit H2 isoform d |
| 409971411 |
|
Ncaph2 |
|
0 |
0 |
10755 |
1318 |
118 |
|
n.v. |
n.v. |
-0.05 |
0.26 |
-0.31 |
|
condensin-2 complex subunit H2 isoform c |
| 144922627 |
|
Ncbp1 |
|
1153 |
0 |
4693 |
20570 |
5194 |
|
-0.18 |
n.v. |
-0.03 |
0.15 |
0.34 |
|
nuclear cap-binding protein subunit 1 |
| 13386056 |
|
Ncbp2 |
|
0 |
610 |
534 |
859 |
4316 |
|
n.v. |
0.17 |
0.04 |
0.08 |
0.3 |
|
nuclear cap-binding protein subunit 2 |
| 172072590 |
|
Ncdn |
|
0 |
0 |
45 |
16 |
21 |
|
n.v. |
n.v. |
-0.03 |
0.58 |
0.4 |
|
neurochondrin |
| 30520239 |
|
Nceh1 |
|
97718 |
17387 |
11254 |
1334 |
0 |
|
0.08 |
-0.17 |
-0.24 |
-0.02 |
n.v. |
|
neutral cholesterol ester hydrolase 1 |
| 34328187 |
|
Nck1 |
|
0 |
246 |
391 |
0 |
1521 |
|
n.v. |
-0.34 |
0.13 |
n.v. |
0.51 |
|
cytoplasmic protein NCK1 |
| 190610036 |
|
Nck2 |
|
0 |
618 |
581 |
0 |
0 |
|
n.v. |
0.1 |
0.08 |
n.v. |
n.v. |
|
cytoplasmic protein NCK2 |
| 28395023 |
|
Nckap1 |
|
0 |
887 |
24243 |
10494 |
1971 |
|
n.v. |
-0.04 |
-0.06 |
-0.04 |
-0.28 |
|
nck-associated protein 1 |
| 23943795 |
|
Nckap1l |
|
0 |
0 |
471 |
0 |
0 |
|
n.v. |
n.v. |
-0.07 |
n.v. |
n.v. |
|
nck-associated protein 1-like |
| 49258190 |
|
Nckipsd |
|
0 |
0 |
92 |
0 |
0 |
|
n.v. |
n.v. |
0.22 |
n.v. |
n.v. |
|
NCK-interacting protein with SH3 domain |
| 84875537 |
|
Ncl |
|
360043 |
40099 |
216167 |
878655 |
73917 |
|
-0.01 |
0.1 |
-0.04 |
-0.13 |
-0.08 |
|
nucleolin |
| 33469043 |
|
Ncln |
|
421 |
3563 |
2460 |
0 |
0 |
|
-0.19 |
-0.23 |
-0.18 |
n.v. |
n.v. |
|
nicalin precursor |
| 118026940 |
|
Ncoa2 |
|
0 |
0 |
0 |
0 |
610 |
|
n.v. |
n.v. |
n.v. |
n.v. |
-0.03 |
|
nuclear receptor coactivator 2 isoform a |
| 118026944 |
|
Ncoa2 |
|
0 |
0 |
0 |
0 |
610 |
|
n.v. |
n.v. |
n.v. |
n.v. |
-0.03 |
|
nuclear receptor coactivator 2 isoform b |
| 118026946 |
|
Ncoa3 |
|
0 |
0 |
0 |
0 |
257 |
|
n.v. |
n.v. |
n.v. |
n.v. |
0.74 |
|
nuclear receptor coactivator 3 |
| 21450271 |
|
Ncoa5 |
|
1172 |
6 |
0 |
0 |
0 |
|
0.14 |
-0.32 |
n.v. |
n.v. |
n.v. |
|
nuclear receptor coactivator 5 |
| 224809376 |
|
Ncstn |
|
8769 |
1380 |
18347 |
573 |
0 |
|
-0.28 |
-0.11 |
-0.08 |
0.5 |
n.v. |
|
nicastrin precursor |
| 226453475 |
|
ND1 |
|
0 |
841 |
121 |
0 |
0 |
|
n.v. |
-0.36 |
-0.29 |
n.v. |
n.v. |
|
NADH dehydrogenase subunit 1musculus castaneus] |
| 167716837 |
|
ND1 |
|
3332 |
887 |
121 |
0 |
0 |
|
-0.46 |
-0.44 |
-0.29 |
n.v. |
n.v. |
|
NADH dehydrogenase subunit 1musculus |
| 34538598 |
|
ND1 |
|
3332 |
887 |
121 |
0 |
0 |
|
-0.46 |
-0.44 |
-0.29 |
n.v. |
n.v. |
|
NADH dehydrogenase subunit 1 |
| 62184369 |
|
ND1 |
|
3332 |
887 |
121 |
0 |
0 |
|
-0.46 |
-0.44 |
-0.29 |
n.v. |
n.v. |
|
NADH dehydrogenase subunit 1musculus molossinus] |
| 167716838 |
|
ND2 |
|
0 |
127 |
20 |
0 |
0 |
|
n.v. |
-0.09 |
-0.14 |
n.v. |
n.v. |
|
NADH dehydrogenase subunit 2musculus |
| 226453476 |
|
ND2 |
|
0 |
127 |
20 |
0 |
0 |
|
n.v. |
-0.09 |
-0.14 |
n.v. |
n.v. |
|
NADH dehydrogenase subunit 2musculus castaneus] |
| 34538599 |
|
ND2 |
|
0 |
127 |
20 |
0 |
0 |
|
n.v. |
-0.09 |
-0.14 |
n.v. |
n.v. |
|
NADH dehydrogenase subunit 2 |
| 62184370 |
|
ND2 |
|
0 |
127 |
20 |
0 |
0 |
|
n.v. |
-0.09 |
-0.14 |
n.v. |
n.v. |
|
NADH dehydrogenase subunit 2musculus molossinus] |
| 226453482 |
|
ND3 |
|
2545 |
756 |
1187 |
0 |
0 |
|
-0.12 |
-0.14 |
-0.33 |
n.v. |
n.v. |
|
NADH dehydrogenase subunit 3musculus castaneus] |
| 34538605 |
|
ND3 |
|
2545 |
756 |
1187 |
0 |
0 |
|
-0.12 |
-0.14 |
-0.33 |
n.v. |
n.v. |
|
NADH dehydrogenase subunit 3 |
| 167716846 |
|
ND4 |
|
55 |
0 |
0 |
0 |
0 |
|
0 |
n.v. |
n.v. |
n.v. |
n.v. |
|
NADH dehydrogenase subunit 4musculus |
| 226453484 |
|
ND4 |
|
55 |
0 |
0 |
0 |
0 |
|
0 |
n.v. |
n.v. |
n.v. |
n.v. |
|
NADH dehydrogenase subunit 4musculus castaneus] |
| 34538607 |
|
ND4 |
|
55 |
0 |
0 |
0 |
0 |
|
0 |
n.v. |
n.v. |
n.v. |
n.v. |
|
NADH dehydrogenase subunit 4 |
| 62184378 |
|
ND4 |
|
55 |
0 |
0 |
0 |
0 |
|
0 |
n.v. |
n.v. |
n.v. |
n.v. |
|
NADH dehydrogenase subunit 4musculus molossinus] |
| 167716847 |
|
ND5 |
|
0 |
10 |
0 |
0 |
0 |
|
n.v. |
0.34 |
n.v. |
n.v. |
n.v. |
|
NADH dehydrogenase subunit 5musculus |
| 226453485 |
|
ND5 |
|
0 |
10 |
0 |
0 |
0 |
|
n.v. |
0.34 |
n.v. |
n.v. |
n.v. |
|
NADH dehydrogenase subunit 5musculus castaneus] |
| 34538608 |
|
ND5 |
|
0 |
10 |
0 |
0 |
0 |
|
n.v. |
0.34 |
n.v. |
n.v. |
n.v. |
|
NADH dehydrogenase subunit 5 |
| 62184379 |
|
ND5 |
|
0 |
10 |
0 |
0 |
0 |
|
n.v. |
0.34 |
n.v. |
n.v. |
n.v. |
|
NADH dehydrogenase subunit 5musculus molossinus] |
| 166197652 |
|
Nde1 |
|
0 |
0 |
40 |
286 |
0 |
|
n.v. |
n.v. |
0.67 |
0.34 |
n.v. |
|
nuclear distribution protein nudE homolog 1 isoform a |
| 166197654 |
|
Nde1 |
|
0 |
0 |
40 |
286 |
0 |
|
n.v. |
n.v. |
0.67 |
0.34 |
n.v. |
|
nuclear distribution protein nudE homolog 1 isoform b |
| 238550188 |
|
Ndel1 |
|
0 |
0 |
40 |
286 |
0 |
|
n.v. |
n.v. |
0.67 |
0.34 |
n.v. |
|
nuclear distribution protein nudE-like 1 |
| 12963595 |
|
Ndnl2 |
|
330 |
50 |
0 |
0 |
0 |
|
0.37 |
-0.12 |
n.v. |
n.v. |
n.v. |
|
melanoma-associated antigen G1 |
| 118150658 |
|
Ndrg1 |
|
124060 |
41604 |
83981 |
9217 |
232203 |
|
-0.46 |
-0.23 |
-0.41 |
0.2 |
0.29 |
|
protein NDRG1 |
| 255918147 |
|
Ndrg3 |
|
0 |
401 |
57 |
0 |
27245 |
|
n.v. |
0.48 |
-0.37 |
n.v. |
0.12 |
|
protein NDRG3 isoform 1 |
| 7305307 |
|
Ndrg3 |
|
0 |
401 |
57 |
0 |
27245 |
|
n.v. |
0.48 |
-0.37 |
n.v. |
0.12 |
|
protein NDRG3 isoform 2 |
| 9506911 |
|
Ndufa1 |
|
0 |
1037 |
82 |
0 |
0 |
|
n.v. |
-0.09 |
-0.23 |
n.v. |
n.v. |
|
NADH dehydrogenase [ubiquinone] 1 alpha subcomplex
subunit 1 |
| 13195624 |
|
Ndufa10 |
|
34031 |
2113 |
1424 |
123 |
0 |
|
0.08 |
0.1 |
-0.34 |
-0.09 |
n.v. |
|
NADH dehydrogenase [ubiquinone] 1 alpha subcomplex
subunit 10, mitochondrial precursor |
| 226437665 |
|
Ndufa11 |
|
3020 |
2812 |
116 |
0 |
0 |
|
0.19 |
-0.1 |
-0.18 |
n.v. |
n.v. |
|
NADH dehydrogenase [ubiquinone] 1 alpha subcomplex
subunit 11 |
| 27228985 |
|
Ndufa12 |
|
19624 |
10667 |
1297 |
0 |
0 |
|
-0.07 |
-0.04 |
-0.34 |
n.v. |
n.v. |
|
NADH dehydrogenase [ubiquinone] 1 alpha subcomplex
subunit 12 |
| 12963633 |
|
Ndufa13 |
|
35935 |
31119 |
2366 |
0 |
0 |
|
-0.05 |
-0.06 |
-0.34 |
n.v. |
n.v. |
|
NADH dehydrogenase [ubiquinone] 1 alpha subcomplex
subunit 13 |
| 31981600 |
|
Ndufa2 |
|
12228 |
3219 |
1064 |
90 |
0 |
|
0.03 |
-0.12 |
-0.27 |
-1.05 |
n.v. |
|
NADH dehydrogenase [ubiquinone] 1 alpha subcomplex
subunit 2 |
| 21539587 |
|
Ndufa3 |
|
1593 |
3695 |
66 |
0 |
0 |
|
-0.11 |
-0.19 |
-0.29 |
n.v. |
n.v. |
|
NADH dehydrogenase [ubiquinone] 1 alpha subcomplex
subunit 3 |
| 33563266 |
|
Ndufa4 |
|
191518 |
18435 |
5577 |
0 |
0 |
|
-0.02 |
-0.12 |
-0.27 |
n.v. |
n.v. |
|
NADH dehydrogenase [ubiquinone] 1 alpha subcomplex
subunit 4 |
| 13386100 |
|
Ndufa5 |
|
10965 |
3046 |
871 |
90 |
0 |
|
0.06 |
-0.11 |
-0.4 |
-0.03 |
n.v. |
|
NADH dehydrogenase [ubiquinone] 1 alpha subcomplex
subunit 5 |
| 13385492 |
|
Ndufa6 |
|
16073 |
1666 |
382 |
352 |
0 |
|
-0.03 |
0.06 |
-0.38 |
-0.23 |
n.v. |
|
NADH dehydrogenase [ubiquinone] 1 alpha subcomplex
subunit 6 |
| 12963571 |
|
Ndufa7 |
|
1648 |
4039 |
639 |
0 |
0 |
|
-0.02 |
-0.25 |
-0.3 |
n.v. |
n.v. |
|
NADH dehydrogenase [ubiquinone] 1 alpha subcomplex
subunit 7 |
| 21312012 |
|
Ndufa8 |
|
53637 |
11369 |
1381 |
98 |
0 |
|
0.05 |
-0.11 |
-0.38 |
-1.03 |
n.v. |
|
NADH dehydrogenase [ubiquinone] 1 alpha subcomplex
subunit 8 |
| 254692859 |
|
Ndufa9 |
|
45930 |
15880 |
451 |
0 |
0 |
|
0.02 |
-0.09 |
-0.26 |
n.v. |
n.v. |
|
NADH dehydrogenase [ubiquinone] 1 alpha subcomplex
subunit 9, mitochondrial precursor |
| 27754007 |
|
Ndufab1 |
|
183 |
1298 |
0 |
0 |
0 |
|
0.03 |
-0.24 |
n.v. |
n.v. |
n.v. |
|
acyl carrier protein, mitochondrial precursor |
| 188035926 |
|
Ndufaf2 |
|
0 |
1420 |
0 |
0 |
0 |
|
n.v. |
0.01 |
n.v. |
n.v. |
n.v. |
|
mimitin, mitochondrial |
| 12963603 |
|
Ndufaf3 |
|
0 |
200 |
0 |
0 |
0 |
|
n.v. |
0.02 |
n.v. |
n.v. |
n.v. |
|
NADH dehydrogenase [ubiquinone] 1 alpha subcomplex
assembly factor 3 |
| 21624617 |
|
Ndufaf4 |
|
0 |
891 |
0 |
0 |
0 |
|
n.v. |
-0.13 |
n.v. |
n.v. |
n.v. |
|
NADH dehydrogenase [ubiquinone] 1 alpha subcomplex
assembly factor 4 |
| 166295190 |
|
Ndufaf5 |
|
0 |
184 |
0 |
0 |
0 |
|
n.v. |
0.02 |
n.v. |
n.v. |
n.v. |
|
NADH dehydrogenase [ubiquinone] 1 alpha subcomplex
assembly factor 5 precursor |
| 158937256 |
|
Ndufaf7 |
|
0 |
1657 |
0 |
0 |
0 |
|
n.v. |
-0.12 |
n.v. |
n.v. |
n.v. |
|
protein midA homolog, mitochondrial precursor |
| 58037109 |
|
Ndufb10 |
|
25372 |
12114 |
1248 |
0 |
0 |
|
0 |
-0.18 |
-0.41 |
n.v. |
n.v. |
|
NADH dehydrogenase [ubiquinone] 1 beta subcomplex subunit
10 |
| 158631246 |
|
Ndufb11 |
|
1190 |
1040 |
20 |
0 |
0 |
|
-0.09 |
-0.19 |
-0.29 |
n.v. |
n.v. |
|
NADH dehydrogenase [ubiquinone] 1 beta subcomplex subunit
11, mitochondrial |
| 13385054 |
|
Ndufb3 |
|
8732 |
7031 |
537 |
0 |
0 |
|
0.03 |
-0.12 |
-0.36 |
n.v. |
n.v. |
|
NADH dehydrogenase [ubiquinone] 1 beta subcomplex subunit
3 |
| 27754144 |
|
Ndufb5 |
|
45179 |
3152 |
288 |
0 |
0 |
|
-0.03 |
-0.09 |
-0.29 |
n.v. |
n.v. |
|
NADH dehydrogenase [ubiquinone] 1 beta subcomplex subunit
5, mitochondrial precursor |
| 84781779 |
|
Ndufb6 |
|
677 |
2996 |
0 |
0 |
0 |
|
0.12 |
-0.05 |
n.v. |
n.v. |
n.v. |
|
NADH dehydrogenase [ubiquinone] 1 beta subcomplex subunit
6 |
| 13385322 |
|
Ndufb7 |
|
12228 |
11383 |
350 |
0 |
0 |
|
-0.13 |
-0.17 |
-0.37 |
n.v. |
n.v. |
|
NADH dehydrogenase [ubiquinone] 1 beta subcomplex subunit
7 |
| 13385558 |
|
Ndufb8 |
|
3313 |
7336 |
60 |
0 |
0 |
|
-0.04 |
-0.12 |
-0.59 |
n.v. |
n.v. |
|
NADH dehydrogenase [ubiquinone] 1 beta subcomplex subunit
8, mitochondrial precursor |
| 29789148 |
|
Ndufb9 |
|
1190 |
3165 |
0 |
0 |
0 |
|
-0.25 |
-0.31 |
n.v. |
n.v. |
n.v. |
|
NADH dehydrogenase [ubiquinone] 1 beta subcomplex subunit
9 |
| 18859597 |
|
Ndufc2 |
|
8933 |
6480 |
190 |
0 |
0 |
|
-0.29 |
-0.16 |
-0.67 |
n.v. |
n.v. |
|
NADH dehydrogenase [ubiquinone] 1 subunit C2 |
| 229892316 |
|
Ndufs1 |
|
165816 |
24082 |
6079 |
0 |
0 |
|
0.05 |
-0.1 |
-0.28 |
n.v. |
n.v. |
|
NADH-ubiquinone oxidoreductase 75 kDa subunit,
mitochondrial precursor |
| 23346461 |
|
Ndufs2 |
|
915 |
28125 |
2871 |
0 |
0 |
|
0.06 |
-0.15 |
-0.36 |
n.v. |
n.v. |
|
NADH dehydrogenase [ubiquinone] iron-sulfur protein 2,
mitochondrial precursor |
| 58037117 |
|
Ndufs3 |
|
76263 |
8383 |
2318 |
368 |
0 |
|
0.03 |
-0.11 |
-0.25 |
0.26 |
n.v. |
|
NADH dehydrogenase [ubiquinone] iron-sulfur protein 3,
mitochondrial precursor |
| 281485615 |
|
Ndufs4 |
|
677 |
5931 |
31 |
0 |
0 |
|
0.27 |
-0.07 |
-0.46 |
n.v. |
n.v. |
|
NADH dehydrogenase [ubiquinone] iron-sulfur protein 4,
mitochondrial |
| 56711244 |
|
Ndufs6 |
|
8384 |
1081 |
10 |
0 |
0 |
|
-0.03 |
-0.19 |
-0.17 |
n.v. |
n.v. |
|
NADH dehydrogenase [ubiquinone] iron-sulfur protein 6,
mitochondrial precursor |
| 21312950 |
|
Ndufs7 |
|
34232 |
6985 |
511 |
0 |
0 |
|
-0.05 |
-0.13 |
-0.23 |
n.v. |
n.v. |
|
NADH dehydrogenase [ubiquinone] iron-sulfur protein 7,
mitochondrial precursor |
| 46195430 |
|
Ndufs8 |
|
5711 |
2090 |
446 |
0 |
0 |
|
-0.09 |
-0.14 |
-0.4 |
n.v. |
n.v. |
|
NADH dehydrogenase [ubiquinone] iron-sulfur protein 8,
mitochondrial |
| 19526814 |
|
Ndufv1 |
|
50561 |
13502 |
4721 |
0 |
0 |
|
0.02 |
-0.08 |
-0.28 |
n.v. |
n.v. |
|
NADH dehydrogenase [ubiquinone] flavoprotein 1,
mitochondrial precursor |
| 510025446 |
|
Ndufv2 |
|
10196 |
0 |
0 |
0 |
0 |
|
-0.03 |
n.v. |
n.v. |
n.v. |
n.v. |
|
NADH dehydrogenase [ubiquinone] flavoprotein 2,
mitochondrial isoform 2 |
| 110625954 |
|
Ndufv2 |
|
11588 |
12632 |
708 |
0 |
0 |
|
0.14 |
-0.21 |
-0.26 |
n.v. |
n.v. |
|
NADH dehydrogenase [ubiquinone] flavoprotein 2,
mitochondrial isoform 1 precursor |
| 140969946 |
|
Ndufv3 |
|
92 |
0 |
0 |
0 |
0 |
|
0.31 |
n.v. |
n.v. |
n.v. |
n.v. |
|
NADH dehydrogenase [ubiquinone] flavoprotein 3,
mitochondrial isoform 2 |
| 140972309 |
|
Ndufv3 |
|
751 |
2305 |
0 |
0 |
0 |
|
-0.13 |
-0.17 |
n.v. |
n.v. |
n.v. |
|
NADH dehydrogenase [ubiquinone] flavoprotein 3,
mitochondrial isoform 1 |
| 21311871 |
|
Nebl |
|
384 |
0 |
0 |
0 |
0 |
|
0.24 |
n.v. |
n.v. |
n.v. |
n.v. |
|
nebulette |
| 27229051 |
|
Necap1 |
|
0 |
0 |
0 |
0 |
1124 |
|
n.v. |
n.v. |
n.v. |
n.v. |
0.2 |
|
adaptin ear-binding coat-associated protein 1 |
| 13384758 |
|
Necap2 |
|
0 |
674 |
0 |
3593 |
2110 |
|
n.v. |
0.3 |
n.v. |
0.21 |
-0.09 |
|
adaptin ear-binding coat-associated protein 2 |
| 171543875 |
|
Nedd1 |
|
0 |
33 |
173 |
25 |
0 |
|
n.v. |
1.58 |
0.45 |
0.19 |
n.v. |
|
protein NEDD1 |
| 56699423 |
|
Nedd4 |
|
1428 |
1012 |
13275 |
19490 |
121724 |
|
0.21 |
0.03 |
-0.06 |
0.22 |
0.17 |
|
E3 ubiquitin-protein ligase NEDD4 |
| 167466243 |
|
Nedd4l |
|
0 |
21 |
5852 |
3733 |
2827 |
|
n.v. |
-0.28 |
-0.08 |
0.25 |
0.08 |
|
E3 ubiquitin-protein ligase NEDD4-like isoform 2 |
| 167466245 |
|
Nedd4l |
|
0 |
21 |
6257 |
5132 |
4776 |
|
n.v. |
-0.28 |
-0.08 |
0.26 |
0.01 |
|
E3 ubiquitin-protein ligase NEDD4-like isoform 1 |
| 6679034 |
|
Nedd8 |
|
37 |
157 |
265 |
0 |
0 |
|
0.65 |
-0.11 |
0.24 |
n.v. |
n.v. |
|
NEDD8 precursor |
| 22094129 |
|
Neil1 |
|
0 |
0 |
22 |
0 |
0 |
|
n.v. |
n.v. |
0.49 |
n.v. |
n.v. |
|
endonuclease 8-like 1 |
| 124107627 |
|
Nek1 |
|
4174 |
0 |
94 |
401 |
0 |
|
0.02 |
n.v. |
0.49 |
-0.2 |
n.v. |
|
serine/threonine-protein kinase Nek1 |
| 11037794 |
|
Nek6 |
|
0 |
0 |
294 |
1555 |
1810 |
|
n.v. |
n.v. |
-0.41 |
-0.34 |
0.06 |
|
serine/threonine-protein kinase Nek6 |
| 11037792 |
|
Nek7 |
|
0 |
3284 |
509 |
7776 |
6950 |
|
n.v. |
0.41 |
-0.05 |
0.35 |
0.01 |
|
serine/threonine-protein kinase Nek7 |
| 158631240 |
|
Nek9 |
|
0 |
0 |
742 |
2341 |
8942 |
|
n.v. |
n.v. |
-0.18 |
-0.2 |
0.21 |
|
serine/threonine-protein kinase Nek9 |
| 33859652 |
|
Nelfa |
|
0 |
0 |
560 |
2431 |
0 |
|
n.v. |
n.v. |
0.4 |
-0.5 |
n.v. |
|
negative elongation factor A |
| 165377251 |
|
Nelfb |
|
1336 |
386 |
2946 |
12417 |
5494 |
|
0.07 |
0.05 |
0.04 |
-0.06 |
-0.06 |
|
negative elongation factor B |
| 91982765 |
|
Nelfcd |
|
0 |
1722 |
3998 |
14652 |
0 |
|
n.v. |
0.19 |
0.06 |
-0.12 |
n.v. |
|
negative elongation factor D |
| 114052226 |
|
Nelfe |
|
0 |
0 |
376 |
434 |
8075 |
|
n.v. |
n.v. |
0.19 |
-0.45 |
0.07 |
|
negative elongation factor E |
| 32130521 |
|
Nemf |
|
0 |
528 |
2884 |
29075 |
0 |
|
n.v. |
-0.06 |
0.09 |
0.11 |
n.v. |
|
nuclear export mediator factor Nemf |
| 13384818 |
|
Nenf |
|
0 |
0 |
48 |
0 |
0 |
|
n.v. |
n.v. |
-0.59 |
n.v. |
n.v. |
|
neudesin precursor |
| 112363082 |
|
Neo1 |
|
0 |
0 |
0 |
0 |
493 |
|
n.v. |
n.v. |
n.v. |
n.v. |
-0.43 |
|
neogenin isoform 1 precursor |
| 112363084 |
|
Neo1 |
|
0 |
0 |
0 |
0 |
493 |
|
n.v. |
n.v. |
n.v. |
n.v. |
-0.43 |
|
neogenin isoform 2 precursor |
| 50363232 |
|
Nes |
|
0 |
0 |
0 |
0 |
31357 |
|
n.v. |
n.v. |
n.v. |
n.v. |
-0.09 |
|
nestin |
| 254939721 |
|
Neu1 |
|
146 |
4599 |
277 |
0 |
0 |
|
1.2 |
0.04 |
-0.36 |
n.v. |
n.v. |
|
sialidase-1 precursor |
| 240849436 |
|
Nexn |
|
2984 |
4559 |
366 |
3291 |
100327 |
|
0.1 |
0.11 |
-0.09 |
-0.24 |
0.07 |
|
nexilin |
| 34878892 |
|
Nf1 |
|
0 |
0 |
2747 |
467 |
0 |
|
n.v. |
n.v. |
-0.3 |
0.81 |
n.v. |
|
neurofibromin |
| 117606364 |
|
Nfkb1 |
|
0 |
150 |
60 |
982 |
20112 |
|
n.v. |
0.16 |
0.08 |
0.47 |
0.08 |
|
nuclear factor NF-kappa-B p105 subunit |
| 293651548 |
|
Nfkb2 |
|
0 |
0 |
133 |
3995 |
21526 |
|
n.v. |
n.v. |
0.1 |
0.31 |
0.11 |
|
nuclear factor NF-kappa-B p100 subunit isoform b |
| 9506921 |
|
Nfkb2 |
|
0 |
0 |
133 |
3995 |
21526 |
|
n.v. |
n.v. |
0.1 |
0.31 |
0.11 |
|
nuclear factor NF-kappa-B p100 subunit isoform a |
| 226052096 |
|
Nfkbia |
|
0 |
0 |
0 |
0 |
150 |
|
n.v. |
n.v. |
n.v. |
n.v. |
-0.17 |
|
NF-kappa-B inhibitor alpha |
| 24111253 |
|
Nfkbib |
|
0 |
0 |
9 |
0 |
0 |
|
n.v. |
n.v. |
0.25 |
n.v. |
n.v. |
|
NF-kappa-B inhibitor beta |
| 161016824 |
|
Nfs1 |
|
13070 |
5697 |
0 |
0 |
0 |
|
-0.04 |
-0.2 |
n.v. |
n.v. |
n.v. |
|
cysteine desulfurase, mitochondrial |
| 282154801 |
|
Nfu1 |
|
9775 |
4597 |
69 |
0 |
1435 |
|
-0.11 |
-0.04 |
-0.73 |
n.v. |
0.13 |
|
NFU1 iron-sulfur cluster scaffold homolog, mitochondrial
isoform 2 precursor |
| 282154803 |
|
Nfu1 |
|
9775 |
4597 |
69 |
0 |
1435 |
|
-0.11 |
-0.04 |
-0.73 |
n.v. |
0.13 |
|
NFU1 iron-sulfur cluster scaffold homolog, mitochondrial
isoform 1 precursor |
| 124301201 |
|
Nfxl1 |
|
165 |
13 |
164 |
0 |
0 |
|
-0.07 |
-0.02 |
-0.43 |
n.v. |
n.v. |
|
nuclear transcription factor, X-box binding-like 1 |
| 161016831 |
|
Nfya |
|
0 |
0 |
0 |
393 |
0 |
|
n.v. |
n.v. |
n.v. |
-0.11 |
n.v. |
|
nuclear transcription factor Y subunit alpha isoform a |
| 6754848 |
|
Nfya |
|
0 |
0 |
0 |
393 |
0 |
|
n.v. |
n.v. |
n.v. |
-0.11 |
n.v. |
|
nuclear transcription factor Y subunit alpha isoform b |
| 31560663 |
|
Nfyc |
|
0 |
0 |
56 |
0 |
0 |
|
n.v. |
n.v. |
-0.03 |
n.v. |
n.v. |
|
nuclear transcription factor Y subunit gamma |
| 162417957 |
|
Ngef |
|
0 |
0 |
73 |
0 |
0 |
|
n.v. |
n.v. |
0.15 |
n.v. |
n.v. |
|
ephexin-1 isoform 1 |
| 162417959 |
|
Ngef |
|
0 |
0 |
73 |
0 |
0 |
|
n.v. |
n.v. |
0.15 |
n.v. |
n.v. |
|
ephexin-1 isoform 2 |
| 158517917 |
|
Nhej1 |
|
0 |
0 |
3 |
0 |
0 |
|
n.v. |
n.v. |
-0.52 |
-2.1 |
n.v. |
|
non-homologous end-joining factor 1 |
| 29789158 |
|
Nhlrc2 |
|
0 |
0 |
347 |
0 |
14908 |
|
n.v. |
n.v. |
0.12 |
n.v. |
-0.19 |
|
NHL repeat-containing protein 2 |
| 27369692 |
|
Nhlrc3 |
|
2435 |
4398 |
0 |
0 |
0 |
|
0.06 |
-0.14 |
n.v. |
n.v. |
n.v. |
|
NHL repeat-containing protein 3 precursor |
| 13386120 |
|
Nhp2 |
|
5236 |
71 |
268 |
2186 |
236 |
|
-0.02 |
0.12 |
-0.17 |
-0.23 |
0.12 |
|
H/ACA ribonucleoprotein complex subunit 2 |
| 124486678 |
|
Nhs |
|
0 |
0 |
31 |
0 |
0 |
|
n.v. |
n.v. |
0.63 |
n.v. |
n.v. |
|
Nance-Horan syndrome protein |
| 41056093 |
|
Nif3l1 |
|
0 |
48 |
697 |
16813 |
22747 |
|
n.v. |
0.06 |
-0.11 |
0.14 |
0 |
|
NIF3-like protein 1 |
| 224809384 |
|
Nifk |
|
0 |
0 |
146 |
1514 |
0 |
|
n.v. |
n.v. |
-0.96 |
-0.6 |
n.v. |
|
MKI67 FHA domain-interacting nucleolar
phosphoprotein |
| 7305315 |
|
Ninj1 |
|
0 |
4 |
0 |
0 |
0 |
|
n.v. |
0.28 |
n.v. |
n.v. |
n.v. |
|
ninjurin-1 |
| 257153334 |
|
Nip7 |
|
0 |
0 |
0 |
3241 |
0 |
|
n.v. |
n.v. |
n.v. |
-0.53 |
n.v. |
|
60S ribosome subunit biogenesis protein NIP7 homolog
isoform 2 |
| 257153336 |
|
Nip7 |
|
0 |
0 |
0 |
3487 |
0 |
|
n.v. |
n.v. |
n.v. |
-0.49 |
n.v. |
|
60S ribosome subunit biogenesis protein NIP7 homolog
isoform 1 |
| 49169845 |
|
Nipbl |
|
1483 |
0 |
0 |
0 |
0 |
|
-0.39 |
n.v. |
n.v. |
n.v. |
n.v. |
|
nipped-B-like protein isoform A |
| 51371928 |
|
Nipbl |
|
1483 |
0 |
0 |
0 |
0 |
|
-0.39 |
n.v. |
n.v. |
n.v. |
n.v. |
|
nipped-B-like protein isoform B |
| 6679066 |
|
Nipsnap1 |
|
1428 |
5323 |
0 |
377 |
0 |
|
0.07 |
-0.05 |
n.v. |
-0.14 |
n.v. |
|
protein NipSnap homolog 1 |
| 13385084 |
|
Nipsnap3b |
|
0 |
1056 |
0 |
0 |
0 |
|
n.v. |
-0.23 |
n.v. |
n.v. |
n.v. |
|
protein NipSnap homolog 3B |
| 114158672 |
|
Nisch |
|
0 |
699 |
32 |
0 |
17189 |
|
n.v. |
0.07 |
0.15 |
n.v. |
0.12 |
|
nischarin |
| 336088630 |
|
Nit1 |
|
0 |
1184 |
618 |
3684 |
31775 |
|
n.v. |
0.02 |
0.25 |
0.16 |
-0.04 |
|
nitrilase homolog 1 isoform 2 |
| 6754856 |
|
Nit1 |
|
0 |
1184 |
618 |
3684 |
31775 |
|
n.v. |
0.02 |
0.25 |
0.16 |
-0.04 |
|
nitrilase homolog 1 isoform 1 |
| 12963555 |
|
Nit2 |
|
0 |
2960 |
2114 |
409 |
31925 |
|
n.v. |
-0.08 |
-0.03 |
-0.17 |
0.14 |
|
omega-amidase NIT2 |
| 257153408 |
|
Nkap |
|
0 |
150 |
183 |
638 |
0 |
|
n.v. |
0.37 |
0 |
-0.19 |
n.v. |
|
NF-kappa-B-activating protein |
| 254553396 |
|
Nkapl |
|
0 |
150 |
183 |
638 |
0 |
|
n.v. |
0.37 |
0 |
-0.19 |
n.v. |
|
NFKB activating protein-like |
| 21312616 |
|
Nkiras2 |
|
0 |
190 |
1162 |
2578 |
1124 |
|
n.v. |
-0.12 |
-0.05 |
0.01 |
-0.19 |
|
NF-kappa-B inhibitor-interacting Ras-like protein 2 |
| 62526130 |
|
Nktr |
|
0 |
0 |
22 |
990 |
0 |
|
n.v. |
n.v. |
-0.18 |
0.01 |
n.v. |
|
NK-tumor recognition protein |
| 21450629 |
|
Nkx6-1 |
|
0 |
7718 |
0 |
0 |
0 |
|
n.v. |
-0.06 |
n.v. |
n.v. |
n.v. |
|
homeobox protein Nkx-6.1 |
| 238624156 |
|
Nle1 |
|
0 |
0 |
83 |
0 |
2731 |
|
n.v. |
n.v. |
-2.03 |
n.v. |
-1.13 |
|
notchless protein homolog 1 |
| 149408132 |
|
Nlk |
|
0 |
202 |
6785 |
36254 |
73039 |
|
n.v. |
0.05 |
-0.02 |
0.01 |
-0.01 |
|
serine/threonine-protein kinase NLK |
| 28077051 |
|
Nln |
|
0 |
75 |
0 |
0 |
1071 |
|
n.v. |
0.08 |
n.v. |
n.v. |
0.44 |
|
neurolysin, mitochondrial precursor |
| 241666421 |
|
Nlrp1a |
|
13327 |
1353 |
1652 |
3749 |
0 |
|
-0.07 |
0.2 |
0.06 |
0.16 |
n.v. |
|
NLR family, pyrin domain containing 1A |
| 22003870 |
|
Nlrp3 |
|
0 |
0 |
606 |
0 |
0 |
|
n.v. |
n.v. |
-0.14 |
n.v. |
n.v. |
|
NACHT, LRR and PYD domains-containing protein 3 |
| 7106379 |
|
Nlrp5 |
|
0 |
0 |
0 |
16052 |
0 |
|
n.v. |
n.v. |
n.v. |
-0.17 |
n.v. |
|
NACHT, LRR and PYD domains-containing protein 5 isoform
a |
| 85362740 |
|
Nlrp5 |
|
0 |
0 |
0 |
16052 |
0 |
|
n.v. |
n.v. |
n.v. |
-0.17 |
n.v. |
|
NACHT, LRR and PYD domains-containing protein 5 isoform
b |
| 37700232 |
|
Nme1 |
|
11844 |
62598 |
71376 |
204664 |
609724 |
|
0.35 |
0.17 |
0.11 |
0.27 |
0.13 |
|
nucleoside diphosphate kinase A |
| 6679078 |
|
Nme2 |
|
51458 |
53138 |
87392 |
226961 |
715149 |
|
0.32 |
0.15 |
0.08 |
0.25 |
0.07 |
|
nucleoside diphosphate kinase B |
| 255308888 |
|
Nme3 |
|
4210 |
4355 |
755 |
917 |
910 |
|
-0.21 |
-0.05 |
-0.15 |
-0.1 |
-0.15 |
|
nucleoside diphosphate kinase 3 |
| 9055290 |
|
Nme6 |
|
0 |
184 |
0 |
0 |
0 |
|
n.v. |
-0.24 |
n.v. |
n.v. |
n.v. |
|
nucleoside diphosphate kinase 6 |
| 167000069 |
|
Nme8 |
|
0 |
152 |
0 |
8 |
0 |
|
n.v. |
0.15 |
n.v. |
-0.49 |
n.v. |
|
thioredoxin domain-containing protein 3 isoform 1 |
| 268836142 |
|
Nme8 |
|
0 |
152 |
0 |
8 |
0 |
|
n.v. |
0.15 |
n.v. |
-0.49 |
n.v. |
|
thioredoxin domain-containing protein 3 isoform 2 |
| 33469125 |
|
Nmi |
|
0 |
21 |
1632 |
10592 |
20145 |
|
n.v. |
0.13 |
0.06 |
0.19 |
0.04 |
|
N-myc-interactor |
| 57527870 |
|
Nmnat1 |
|
0 |
81 |
1010 |
589 |
0 |
|
n.v. |
0.36 |
-0.12 |
0.83 |
n.v. |
|
nicotinamide mononucleotide adenylyltransferase 1 |
| 21362329 |
|
Nmnat3 |
|
0 |
1889 |
10 |
0 |
0 |
|
n.v. |
-0.28 |
0.33 |
n.v. |
n.v. |
|
nicotinamide mononucleotide adenylyltransferase 3 |
| 24431937 |
|
Nmral1 |
|
0 |
589 |
269 |
123 |
43738 |
|
n.v. |
0.42 |
0.02 |
-0.2 |
0.11 |
|
nmrA-like family domain-containing protein 1 |
| 21703978 |
|
Nmrk1 |
|
0 |
123 |
54 |
0 |
3973 |
|
n.v. |
0.59 |
0.38 |
n.v. |
0.34 |
|
nicotinamide riboside kinase 1 |
| 6679082 |
|
Nmt1 |
|
6938 |
9308 |
66489 |
81700 |
96 |
|
0.3 |
0.19 |
0.02 |
0.12 |
-0.29 |
|
glycylpeptide N-tetradecanoyltransferase 1 |
| 6679084 |
|
Nmt2 |
|
6023 |
1280 |
26932 |
39806 |
0 |
|
0.3 |
0.19 |
0.04 |
0.12 |
n.v. |
|
glycylpeptide N-tetradecanoyltransferase 2 |
| 9790049 |
|
Noa1 |
|
0 |
357 |
0 |
0 |
0 |
|
n.v. |
-0.54 |
n.v. |
n.v. |
n.v. |
|
nitric oxide-associated protein 1 |
| 30794454 |
|
Nob1 |
|
0 |
0 |
56 |
82 |
0 |
|
n.v. |
n.v. |
0.08 |
0.69 |
n.v. |
|
RNA-binding protein NOB1 |
| 124301227 |
|
Noc2l |
|
0 |
0 |
0 |
237 |
0 |
|
n.v. |
n.v. |
n.v. |
-0.65 |
n.v. |
|
nucleolar complex protein 2 homolog |
| 83977454 |
|
Nod2 |
|
0 |
589 |
322 |
0 |
0 |
|
n.v. |
0.52 |
0.19 |
n.v. |
n.v. |
|
nucleotide-binding oligomerization domain-containing
protein 2 |
| 227430356 |
|
Nol9 |
|
0 |
0 |
196 |
0 |
0 |
|
n.v. |
n.v. |
-0.28 |
n.v. |
n.v. |
|
polynucleotide 5'-hydroxyl-kinase NOL9 isoform 2 |
| 227430358 |
|
Nol9 |
|
0 |
0 |
196 |
0 |
0 |
|
n.v. |
n.v. |
-0.28 |
n.v. |
n.v. |
|
polynucleotide 5'-hydroxyl-kinase NOL9 isoform 1 |
| 86198327 |
|
Nolc1 |
|
6242 |
795 |
146 |
0 |
0 |
|
0.2 |
-0.18 |
-0.45 |
n.v. |
n.v. |
|
nucleolar and coiled-body phosphoprotein 1 isoform B |
| 86198329 |
|
Nolc1 |
|
6242 |
795 |
146 |
0 |
0 |
|
0.2 |
-0.18 |
-0.45 |
n.v. |
n.v. |
|
nucleolar and coiled-body phosphoprotein 1 isoform C |
| 86198331 |
|
Nolc1 |
|
6242 |
795 |
146 |
0 |
0 |
|
0.2 |
-0.18 |
-0.45 |
n.v. |
n.v. |
|
nucleolar and coiled-body phosphoprotein 1 isoform A |
| 86198333 |
|
Nolc1 |
|
6242 |
795 |
146 |
0 |
0 |
|
0.2 |
-0.18 |
-0.45 |
n.v. |
n.v. |
|
nucleolar and coiled-body phosphoprotein 1 isoform D |
| 134288861 |
|
Nom1 |
|
0 |
0 |
20 |
0 |
0 |
|
n.v. |
n.v. |
-0.15 |
n.v. |
n.v. |
|
nucleolar MIF4G domain-containing protein 1 |
| 227908803 |
|
Nomo1 |
|
2233 |
10408 |
3682 |
0 |
0 |
|
0.21 |
-0.2 |
-0.3 |
n.v. |
n.v. |
|
nodal modulator 1 precursor |
| 357394934;255958247 |
|
Nono |
|
0 |
0 |
26040 |
0 |
0 |
|
n.v. |
n.v. |
-0.11 |
n.v. |
n.v. |
|
non-POU domain-containing octamer-binding protein |
| 255958247 |
|
Nono |
|
254197 |
2674 |
0 |
21741 |
0 |
|
-0.1 |
-0.01 |
n.v. |
-0.2 |
n.v. |
|
non-POU domain-containing octamer-binding protein |
| 13384790 |
|
Nop10 |
|
0 |
0 |
0 |
8 |
0 |
|
n.v. |
n.v. |
n.v. |
-0.17 |
n.v. |
|
H/ACA ribonucleoprotein complex subunit 3 |
| 30519925 |
|
Nop16 |
|
0 |
0 |
45 |
377 |
0 |
|
n.v. |
n.v. |
0.8 |
0 |
n.v. |
|
nucleolar protein 16 |
| 158966689 |
|
Nop2 |
|
8970 |
0 |
2394 |
0 |
0 |
|
-0.01 |
n.v. |
-0.19 |
n.v. |
n.v. |
|
putative ribosomal RNA methyltransferase NOP2 |
| 126090932 |
|
Nop56 |
|
321344 |
6805 |
5138 |
30958 |
21 |
|
-0.11 |
0.02 |
-0.32 |
-0.17 |
0.4 |
|
nucleolar protein 56 |
| 120407050 |
|
Nop58 |
|
208707 |
3580 |
14749 |
48385 |
203 |
|
0.01 |
-0.13 |
-0.13 |
-0.07 |
0.63 |
|
nucleolar protein 58 |
| 169646352 |
|
Nop9 |
|
0 |
104 |
631 |
5296 |
0 |
|
n.v. |
-0.05 |
0.01 |
0.14 |
n.v. |
|
nucleolar protein 9 |
| 110625798 |
|
Nos1ap |
|
0 |
0 |
34 |
0 |
0 |
|
n.v. |
n.v. |
1.05 |
n.v. |
n.v. |
|
carboxyl-terminal PDZ ligand of neuronal nitric oxide
synthase protein isoform 2 |
| 158508485 |
|
Nos1ap |
|
0 |
0 |
34 |
0 |
0 |
|
n.v. |
n.v. |
1.05 |
n.v. |
n.v. |
|
carboxyl-terminal PDZ ligand of neuronal nitric oxide
synthase protein isoform 1 |
| 254826728 |
|
Nosip |
|
256 |
443 |
0 |
1383 |
3823 |
|
-0.13 |
0.01 |
n.v. |
0.13 |
0.03 |
|
nitric oxide synthase-interacting protein isoform 2 |
| 13384956 |
|
Nosip |
|
256 |
443 |
34 |
1383 |
7422 |
|
-0.13 |
0.01 |
-0.14 |
0.13 |
0.01 |
|
nitric oxide synthase-interacting protein isoform 1 |
| 134288853 |
|
Notch2 |
|
0 |
106 |
174 |
0 |
0 |
|
n.v. |
0.27 |
-0.08 |
n.v. |
n.v. |
|
neurogenic locus notch homolog protein 2 precursor |
| 6679096 |
|
Notch3 |
|
0 |
0 |
0 |
0 |
1028 |
|
n.v. |
n.v. |
n.v. |
n.v. |
0.12 |
|
neurogenic locus notch homolog protein 3 precursor |
| 24233564 |
|
Npas4 |
|
29894 |
4296 |
18251 |
4355 |
82046 |
|
0.14 |
0.12 |
0.06 |
0.2 |
0.14 |
|
neuronal PAS domain-containing protein 4 |
| 89242146 |
|
Npc1 |
|
0 |
1374 |
389 |
0 |
0 |
|
n.v. |
-0.07 |
-0.16 |
n.v. |
n.v. |
|
Niemann-Pick C1 protein precursor |
| 12963667 |
|
Npc2 |
|
73425 |
21662 |
2810 |
0 |
109837 |
|
0 |
-0.15 |
-0.26 |
n.v. |
-0.18 |
|
epididymal secretory protein E1 precursor |
| 47523981 |
|
Npepl1 |
|
0 |
0 |
2602 |
32955 |
7871 |
|
n.v. |
n.v. |
0.09 |
0.36 |
-0.05 |
|
probable aminopeptidase NPEPL1 |
| 68226731 |
|
Npepps |
|
6334 |
19762 |
24323 |
20243 |
190062 |
|
-0.15 |
0.06 |
-0.01 |
0.19 |
0.07 |
|
puromycin-sensitive aminopeptidase |
| 303324586 |
|
Nploc4 |
|
0 |
1415 |
645 |
4175 |
707 |
|
n.v. |
-0.46 |
0.23 |
0.16 |
0.52 |
|
nuclear protein localization protein 4 homolog isoform A |
| 41054974 |
|
Nploc4 |
|
0 |
1415 |
645 |
4175 |
707 |
|
n.v. |
-0.46 |
0.23 |
0.16 |
0.52 |
|
nuclear protein localization protein 4 homolog isoform B |
| 356582423 |
|
Npm1 |
|
72089 |
244 |
23893 |
107239 |
22929 |
|
0.08 |
-0.33 |
-0.19 |
-0.24 |
-0.29 |
|
nucleophosmin isoform 2 |
| 356582426 |
|
Npm1 |
|
280778 |
2620 |
63035 |
168344 |
49639 |
|
0.05 |
-0.04 |
-0.15 |
-0.22 |
-0.35 |
|
nucleophosmin isoform 3 |
| 6679108 |
|
Npm1 |
|
298113 |
2662 |
63071 |
168999 |
49639 |
|
0.06 |
-0.04 |
-0.17 |
-0.22 |
-0.35 |
|
nucleophosmin isoform 1 |
| 6679110 |
|
Npm3 |
|
549 |
248 |
1084 |
7105 |
1896 |
|
-1.89 |
-0.06 |
-0.1 |
0.11 |
-0.64 |
|
nucleoplasmin-3 |
| 71067128 |
|
Npnt |
|
0 |
81 |
0 |
0 |
0 |
|
n.v. |
0.25 |
n.v. |
n.v. |
n.v. |
|
nephronectin isoform b precursor |
| 73088940 |
|
Npnt |
|
0 |
81 |
0 |
0 |
0 |
|
n.v. |
0.25 |
n.v. |
n.v. |
n.v. |
|
nephronectin isoform a precursor |
| 38194222 |
|
Nprl3 |
|
0 |
0 |
12 |
0 |
0 |
|
n.v. |
n.v. |
-0.11 |
n.v. |
n.v. |
|
nitrogen permease regulator 3-like protein |
| 153945724 |
|
Nptn |
|
0 |
175 |
457 |
0 |
0 |
|
n.v. |
-0.32 |
-0.23 |
n.v. |
n.v. |
|
neuroplastin precursor |
| 94400773 |
|
Nqo1 |
|
220 |
1937 |
5735 |
6753 |
112407 |
|
0.6 |
0.42 |
0.08 |
0.36 |
0.21 |
|
NAD(P)H dehydrogenase [quinone] 1 |
| 253795451 |
|
Nqo2 |
|
0 |
0 |
0 |
0 |
12530 |
|
n.v. |
n.v. |
n.v. |
n.v. |
-0.35 |
|
ribosyldihydronicotinamide dehydrogenase [quinone]
isoform 2 |
| 253795453 |
|
Nqo2 |
|
0 |
0 |
0 |
0 |
15711 |
|
n.v. |
n.v. |
n.v. |
n.v. |
-0.12 |
|
ribosyldihydronicotinamide dehydrogenase [quinone]
isoform 1 |
| 70980537 |
|
Nr2c2ap |
|
0 |
0 |
0 |
74 |
0 |
|
n.v. |
n.v. |
n.v. |
-2.34 |
n.v. |
|
nuclear receptor 2C2-associated protein isoform 1 |
| 121247453 |
|
Nr3c1 |
|
0 |
0 |
0 |
147 |
3084 |
|
n.v. |
n.v. |
n.v. |
0.27 |
-0.19 |
|
glucocorticoid receptor |
| 111154109 |
|
Nras |
|
11331 |
15289 |
26599 |
11206 |
3834 |
|
0.2 |
-0.01 |
-0.11 |
-0.26 |
-0.2 |
|
GTPase NRas precursor |
| 22219434 |
|
Nrbp1 |
|
0 |
180 |
405 |
1072 |
396 |
|
n.v. |
0.37 |
0.02 |
0.31 |
0.16 |
|
nuclear receptor-binding protein |
| 21450055 |
|
Nrbp2 |
|
0 |
0 |
0 |
0 |
1296 |
|
n.v. |
n.v. |
n.v. |
n.v. |
0.45 |
|
nuclear receptor-binding protein 2 |
| 31559918 |
|
Nrd1 |
|
0 |
0 |
187 |
0 |
32803 |
|
n.v. |
n.v. |
-0.2 |
n.v. |
-0.02 |
|
nardilysin precursor |
| 6679132 |
|
Nrl |
|
0 |
0 |
205 |
6982 |
0 |
|
n.v. |
n.v. |
0.1 |
-0.27 |
n.v. |
|
neural retina-specific leucine zipper protein |
| 19527352 |
|
Nrm |
|
7707 |
0 |
0 |
0 |
0 |
|
-0.2 |
n.v. |
n.v. |
n.v. |
n.v. |
|
nurim |
| 244792700 |
|
Nrp1 |
|
0 |
4 |
116 |
0 |
0 |
|
n.v. |
-1.16 |
-0.44 |
n.v. |
n.v. |
|
neuropilin-1 precursor |
| 31982437 |
|
Nsdhl |
|
458 |
7847 |
4485 |
0 |
0 |
|
0.37 |
-0.1 |
-0.19 |
n.v. |
n.v. |
|
sterol-4-alpha-carboxylate 3-dehydrogenase,
decarboxylating |
| 31543349 |
|
Nsf |
|
7908 |
11903 |
39147 |
14734 |
0 |
|
0.05 |
-0.12 |
-0.05 |
0.05 |
n.v. |
|
vesicle-fusing ATPase |
| 38198665 |
|
Nsfl1c |
|
0 |
9934 |
12210 |
32808 |
148776 |
|
n.v. |
0.1 |
0.04 |
-0.1 |
0.02 |
|
NSFL1 cofactor p47 |
| 257196205 |
|
Nsmce2 |
|
897 |
0 |
0 |
0 |
0 |
|
-0.38 |
n.v. |
n.v. |
n.v. |
n.v. |
|
E3 SUMO-protein ligase NSE2 isoform 1 |
| 257196207 |
|
Nsmce2 |
|
897 |
0 |
0 |
0 |
0 |
|
-0.38 |
n.v. |
n.v. |
n.v. |
n.v. |
|
E3 SUMO-protein ligase NSE2 isoform 2 |
| 242246981 |
|
Nsmce4a |
|
732 |
0 |
0 |
0 |
0 |
|
0.05 |
n.v. |
n.v. |
n.v. |
n.v. |
|
non-SMC element 4 homolog A |
| 295054316 |
|
Nsun2 |
|
0 |
647 |
1097 |
8292 |
55614 |
|
n.v. |
0.26 |
0.06 |
0.2 |
0 |
|
tRNA (cytosine(34)-C(5))-methyltransferase |
| 154146245 |
|
Nsun5 |
|
0 |
0 |
155 |
0 |
0 |
|
n.v. |
n.v. |
-0.19 |
n.v. |
n.v. |
|
putative methyltransferase NSUN5 |
| 260099658 |
|
Nsun6 |
|
0 |
0 |
20 |
0 |
1478 |
|
n.v. |
n.v. |
-0.04 |
n.v. |
0.05 |
|
putative methyltransferase NSUN6 isoform a |
| 260099662 |
|
Nsun6 |
|
0 |
0 |
20 |
0 |
1403 |
|
n.v. |
n.v. |
-0.04 |
n.v. |
-0.3 |
|
putative methyltransferase NSUN6 isoform b |
| 260099664 |
|
Nsun6 |
|
0 |
0 |
20 |
0 |
75 |
|
n.v. |
n.v. |
-0.04 |
n.v. |
0.4 |
|
putative methyltransferase NSUN6 isoform c |
| 7657031 |
|
Nt5c |
|
0 |
125 |
35 |
0 |
5922 |
|
n.v. |
0.42 |
0.59 |
n.v. |
0.13 |
|
5'(3')-deoxyribonucleotidase, cytosolic type |
| 256665234 |
|
Nt5c2 |
|
0 |
695 |
5029 |
83304 |
84252 |
|
n.v. |
0.17 |
0.13 |
0.15 |
0.08 |
|
cytosolic purine 5'-nucleotidase isoform 1 |
| 256665236 |
|
Nt5c2 |
|
0 |
695 |
5029 |
83304 |
84252 |
|
n.v. |
0.17 |
0.13 |
0.15 |
0.08 |
|
cytosolic purine 5'-nucleotidase isoform 2 |
| 256665238 |
|
Nt5c2 |
|
0 |
695 |
5029 |
83304 |
84252 |
|
n.v. |
0.17 |
0.13 |
0.15 |
0.08 |
|
cytosolic purine 5'-nucleotidase isoform 3 |
| 172072627 |
|
Nt5c3 |
|
0 |
1850 |
1125 |
0 |
2345 |
|
n.v. |
-0.34 |
0 |
n.v. |
0.2 |
|
cytosolic 5'-nucleotidase 3 isoform 1 |
| 356991161 |
|
Nt5c3 |
|
0 |
1850 |
1125 |
0 |
2345 |
|
n.v. |
-0.34 |
0 |
n.v. |
0.2 |
|
cytosolic 5'-nucleotidase 3 isoform 2 |
| 156627551 |
|
Nt5c3b |
|
0 |
169 |
0 |
0 |
14029 |
|
n.v. |
-0.13 |
n.v. |
n.v. |
0.13 |
|
cytosolic 5'-nucleotidase III-like protein isoform 2 |
| 156627553 |
|
Nt5c3b |
|
0 |
169 |
0 |
0 |
14747 |
|
n.v. |
-0.13 |
n.v. |
n.v. |
0.13 |
|
cytosolic 5'-nucleotidase III-like protein isoform 1 |
| 110626010 |
|
Nt5dc1 |
|
0 |
230 |
301 |
0 |
59641 |
|
n.v. |
-0.33 |
-0.2 |
n.v. |
0.12 |
|
5'-nucleotidase domain-containing protein 1 |
| 110625755 |
|
Nt5dc2 |
|
0 |
474 |
0 |
0 |
0 |
|
n.v. |
-0.15 |
n.v. |
n.v. |
n.v. |
|
5'-nucleotidase domain containing 2 |
| 111494223 |
|
Nt5dc3 |
|
0 |
557 |
0 |
0 |
0 |
|
n.v. |
-0.51 |
n.v. |
n.v. |
n.v. |
|
5'-nucleotidase domain-containing protein 3 |
| 6754902 |
|
Ntan1 |
|
0 |
0 |
0 |
516 |
8921 |
|
n.v. |
n.v. |
n.v. |
-1.04 |
0.02 |
|
protein N-terminal asparagine amidohydrolase |
| 24528555 |
|
Ntmt1 |
|
0 |
342 |
345 |
0 |
5730 |
|
n.v. |
0.06 |
0.14 |
n.v. |
0.28 |
|
N-terminal Xaa-Pro-Lys N-methyltransferase 1 |
| 13385098 |
|
Ntpcr |
|
0 |
0 |
161 |
769 |
0 |
|
n.v. |
n.v. |
-0.05 |
0.21 |
n.v. |
|
cancer-related nucleoside-triphosphatase homolog |
| 119360354 |
|
Nub1 |
|
0 |
35 |
2314 |
3372 |
23465 |
|
n.v. |
0.16 |
0.04 |
0.32 |
0.11 |
|
NEDD8 ultimate buster 1 |
| 6754906 |
|
Nubp1 |
|
0 |
0 |
195 |
0 |
10474 |
|
n.v. |
n.v. |
-0.1 |
n.v. |
-0.01 |
|
cytosolic Fe-S cluster assembly factor NUBP1 |
| 6754908 |
|
Nubp2 |
|
0 |
605 |
205 |
2619 |
7989 |
|
n.v. |
-0.21 |
0.17 |
-0.55 |
0.16 |
|
cytosolic Fe-S cluster assembly factor NUBP2 |
| 167234411 |
|
Nubpl |
|
0 |
56 |
0 |
0 |
0 |
|
n.v. |
0.16 |
n.v. |
n.v. |
n.v. |
|
iron-sulfur protein NUBPL precursor |
| 254750698 |
|
Nucb1 |
|
7011 |
6148 |
4750 |
115 |
3256 |
|
-0.09 |
-0.06 |
0.13 |
0.71 |
-0.23 |
|
nucleobindin-1 isoform 1 precursor |
| 6679158 |
|
Nucb1 |
|
7011 |
5885 |
3654 |
115 |
2174 |
|
-0.09 |
-0.02 |
0.06 |
0.71 |
-0.22 |
|
nucleobindin-1 isoform 2 precursor |
| 194440700 |
|
Nucb2 |
|
0 |
1918 |
1860 |
0 |
0 |
|
n.v. |
-0.17 |
0.23 |
n.v. |
n.v. |
|
nucleobindin-2 precursor |
| 224809559 |
|
Nucks1 |
|
0 |
0 |
0 |
0 |
86 |
|
n.v. |
n.v. |
n.v. |
n.v. |
-0.3 |
|
nuclear ubiquitous casein and cyclin-dependent kinase
substrate 1 isoform 1 |
| 224809563 |
|
Nucks1 |
|
0 |
0 |
0 |
0 |
86 |
|
n.v. |
n.v. |
n.v. |
n.v. |
-0.3 |
|
nuclear ubiquitous casein and cyclin-dependent kinase
substrate 1 isoform 2 |
| 6754910 |
|
Nudc |
|
0 |
7075 |
8543 |
3454 |
125290 |
|
n.v. |
0.02 |
0 |
0.3 |
0.16 |
|
nuclear migration protein nudC |
| 165905633 |
|
Nudcd1 |
|
0 |
0 |
215 |
5083 |
39904 |
|
n.v. |
n.v. |
0.48 |
-0.3 |
0.1 |
|
nudC domain-containing protein 1 isoform 1 |
| 165905635 |
|
Nudcd1 |
|
0 |
0 |
215 |
5083 |
39904 |
|
n.v. |
n.v. |
0.48 |
-0.3 |
0.1 |
|
nudC domain-containing protein 1 isoform 2 |
| 133922575 |
|
Nudcd2 |
|
146 |
749 |
1166 |
1310 |
14961 |
|
0.93 |
0.08 |
0.09 |
-0.12 |
-0.04 |
|
nudC domain-containing protein 2 |
| 30424587 |
|
Nudcd3 |
|
0 |
54 |
0 |
0 |
2474 |
|
n.v. |
0 |
n.v. |
n.v. |
-0.39 |
|
nudC domain-containing protein 3 |
| 6678950 |
|
Nudt1 |
|
0 |
40 |
20 |
0 |
246 |
|
n.v. |
0.29 |
0.2 |
n.v. |
-0.26 |
|
7,8-dihydro-8-oxoguanine triphosphatase precursor |
| 72384357 |
|
Nudt10 |
|
0 |
0 |
0 |
0 |
5965 |
|
n.v. |
n.v. |
n.v. |
n.v. |
0.13 |
|
diphosphoinositol polyphosphate phosphohydrolase 3-alpha |
| 21312664 |
|
Nudt12 |
|
0 |
774 |
392 |
3626 |
0 |
|
n.v. |
-0.32 |
-0.55 |
0.13 |
n.v. |
|
peroxisomal NADH pyrophosphatase NUDT12 |
| 23956126 |
|
Nudt14 |
|
0 |
251 |
711 |
0 |
40311 |
|
n.v. |
0.33 |
-0.17 |
n.v. |
0.04 |
|
uridine diphosphate glucose pyrophosphatase |
| 125656157 |
|
Nudt16 |
|
0 |
0 |
19 |
0 |
0 |
|
n.v. |
n.v. |
0.6 |
n.v. |
n.v. |
|
U8 snoRNA-decapping enzyme |
| 13385314 |
|
Nudt16l1 |
|
12668 |
737 |
2046 |
3675 |
353 |
|
-0.07 |
0.08 |
0.02 |
-0.09 |
0.14 |
|
protein syndesmos |
| 86198335 |
|
Nudt2 |
|
0 |
1442 |
205 |
0 |
4166 |
|
n.v. |
0.01 |
0.22 |
n.v. |
0.18 |
|
bis(5'-nucleosyl)-tetraphosphatase [asymmetrical] |
| 13386106 |
|
Nudt21 |
|
70753 |
5872 |
10656 |
43506 |
10999 |
|
0.06 |
0.03 |
-0.04 |
-0.17 |
-0.21 |
|
cleavage and polyadenylation specificity factor subunit
5 |
| 9789933 |
|
Nudt3 |
|
0 |
221 |
0 |
0 |
27834 |
|
n.v. |
0.51 |
n.v. |
n.v. |
0.15 |
|
diphosphoinositol polyphosphate phosphohydrolase 1 |
| 169808397 |
|
Nudt4 |
|
0 |
0 |
0 |
0 |
15443 |
|
n.v. |
n.v. |
n.v. |
n.v. |
0.17 |
|
diphosphoinositol polyphosphate phosphohydrolase 2 |
| 8393853 |
|
Nudt5 |
|
0 |
1240 |
1125 |
43670 |
22415 |
|
n.v. |
0.05 |
0.07 |
0.11 |
0.03 |
|
ADP-sugar pyrophosphatase |
| 13384950 |
|
Nudt8 |
|
110 |
948 |
0 |
0 |
0 |
|
-0.15 |
-0.09 |
n.v. |
n.v. |
n.v. |
|
nucleoside diphosphate-linked moiety X motif 8,
mitochondrial precursor |
| 27753998 |
|
Nudt9 |
|
0 |
0 |
0 |
0 |
6726 |
|
n.v. |
n.v. |
n.v. |
n.v. |
0.14 |
|
ADP-ribose pyrophosphatase, mitochondrial |
| 110625714 |
|
Nuf2 |
|
0 |
0 |
3 |
0 |
0 |
|
n.v. |
n.v. |
0.85 |
n.v. |
n.v. |
|
kinetochore protein Nuf2 |
| 66730553 |
|
Nufip2 |
|
0 |
0 |
5926 |
655 |
0 |
|
n.v. |
n.v. |
0.32 |
-0.02 |
n.v. |
|
nuclear fragile X mental retardation-interacting protein
2 |
| 254675300 |
|
Numa1 |
|
128215 |
436 |
572 |
0 |
3823 |
|
-0.06 |
0.22 |
-0.28 |
n.v. |
-0.85 |
|
nuclear mitotic apparatus protein 1 |
| 209862959 |
|
Numb |
|
0 |
0 |
339 |
0 |
0 |
|
n.v. |
n.v. |
0.21 |
n.v. |
n.v. |
|
protein numb homolog isoform 1 |
| 440546408 |
|
Numb |
|
0 |
0 |
339 |
0 |
0 |
|
n.v. |
n.v. |
0.21 |
n.v. |
n.v. |
|
protein numb homolog isoform 3 |
| 440546411 |
|
Numb |
|
0 |
0 |
339 |
0 |
0 |
|
n.v. |
n.v. |
0.21 |
n.v. |
n.v. |
|
protein numb homolog isoform 4 |
| 6754912 |
|
Numb |
|
0 |
0 |
339 |
0 |
0 |
|
n.v. |
n.v. |
0.21 |
n.v. |
n.v. |
|
protein numb homolog isoform 2 |
| 29789351 |
|
Nup107 |
|
1172 |
0 |
0 |
0 |
0 |
|
-0.19 |
n.v. |
n.v. |
n.v. |
n.v. |
|
nuclear pore complex protein Nup107 |
| 283806543 |
|
Nup133 |
|
3240 |
1271 |
0 |
0 |
953 |
|
0.05 |
-1.1 |
n.v. |
n.v. |
-0.11 |
|
nuclear pore complex protein Nup133 |
| 165932389 |
|
Nup155 |
|
17317 |
941 |
906 |
0 |
0 |
|
0.06 |
-0.03 |
-0.04 |
n.v. |
n.v. |
|
nuclear pore complex protein Nup155 |
| 10946932 |
|
Nup160 |
|
10013 |
13 |
6 |
131 |
0 |
|
-0.11 |
-0.3 |
-1.01 |
0.06 |
n.v. |
|
nuclear pore complex protein Nup160 |
| 38678526 |
|
Nup188 |
|
549 |
0 |
0 |
409 |
0 |
|
-0.25 |
n.v. |
n.v. |
0.11 |
n.v. |
|
nucleoporin NUP188 homolog |
| 226437676 |
|
Nup205 |
|
6956 |
582 |
253 |
74 |
64 |
|
-0.02 |
0.01 |
0 |
0 |
-1.17 |
|
nucleoporin 205 |
| 172073152 |
|
Nup210 |
|
6096 |
1175 |
0 |
0 |
0 |
|
-0.18 |
-0.16 |
n.v. |
n.v. |
n.v. |
|
nuclear pore membrane glycoprotein 210 precursor |
| 124378033 |
|
Nup214 |
|
1977 |
0 |
0 |
0 |
0 |
|
0.07 |
n.v. |
n.v. |
n.v. |
n.v. |
|
nuclear pore complex protein Nup214 |
| 298231198 |
|
Nup35 |
|
18800 |
42 |
12 |
0 |
0 |
|
0.16 |
0.56 |
-0.05 |
n.v. |
n.v. |
|
nucleoporin NUP53 isoform 2 |
| 58037163 |
|
Nup35 |
|
18800 |
42 |
12 |
0 |
0 |
|
0.16 |
0.56 |
-0.05 |
n.v. |
n.v. |
|
nucleoporin NUP53 isoform 1 |
| 210032861 |
|
Nup37 |
|
549 |
261 |
192 |
254 |
557 |
|
-0.01 |
-0.13 |
-0.05 |
-0.23 |
-0.09 |
|
nucleoporin Nup37 |
| 166295220 |
|
Nup43 |
|
0 |
0 |
0 |
0 |
4102 |
|
n.v. |
n.v. |
n.v. |
n.v. |
0.15 |
|
nucleoporin Nup43 |
| 38016154 |
|
Nup50 |
|
2270 |
0 |
35 |
2947 |
2249 |
|
0.01 |
n.v. |
-0.19 |
0.06 |
0 |
|
nuclear pore complex protein Nup50 |
| 39930543 |
|
Nup54 |
|
0 |
69 |
0 |
0 |
696 |
|
n.v. |
-0.57 |
n.v. |
n.v. |
0.27 |
|
nuclear pore complex protein Nup54 |
| 108773813 |
|
Nup85 |
|
0 |
0 |
165 |
499 |
664 |
|
n.v. |
n.v. |
-0.23 |
0.13 |
0.72 |
|
nuclear pore complex protein Nup85 |
| 27369533 |
|
Nup93 |
|
24365 |
2960 |
890 |
12868 |
15700 |
|
0.13 |
-0.24 |
-0.16 |
-0.04 |
0.23 |
|
nuclear pore complex protein Nup93 |
| 13384840 |
|
Nus1 |
|
0 |
61 |
0 |
0 |
0 |
|
n.v. |
0.11 |
n.v. |
n.v. |
n.v. |
|
nogo-B receptor precursor |
| 111118996 |
|
Nusap1 |
|
0 |
0 |
70 |
753 |
0 |
|
n.v. |
n.v. |
-0.03 |
-0.09 |
n.v. |
|
nucleolar and spindle-associated protein 1 isoform b |
| 19527068 |
|
Nusap1 |
|
0 |
0 |
70 |
753 |
0 |
|
n.v. |
n.v. |
-0.03 |
-0.09 |
n.v. |
|
nucleolar and spindle-associated protein 1 isoform a |
| 33468981 |
|
Nvl |
|
0 |
0 |
4899 |
0 |
0 |
|
n.v. |
n.v. |
0.01 |
n.v. |
n.v. |
|
nuclear valosin-containing protein-like |
| 452401033 |
|
Nxf1 |
|
604 |
0 |
0 |
0 |
0 |
|
0.56 |
n.v. |
n.v. |
n.v. |
n.v. |
|
nuclear RNA export factor 1 isoform 2 |
| 31980798 |
|
Nxf1 |
|
16585 |
188 |
6 |
2439 |
0 |
|
-0.02 |
-0.17 |
0.06 |
-0.34 |
n.v. |
|
nuclear RNA export factor 1 isoform 1 |
| 6679160 |
|
Nxn |
|
0 |
127 |
13 |
16 |
2013 |
|
n.v. |
-0.68 |
-0.08 |
0.32 |
0.06 |
|
nucleoredoxin |
| 158749549 |
|
Nxt1 |
|
183 |
0 |
50 |
0 |
0 |
|
0.16 |
n.v. |
-0.17 |
n.v. |
n.v. |
|
NTF2-related export protein 1 |
| 238637332;238637330 |
|
Nxt2 |
|
183 |
0 |
50 |
0 |
0 |
|
0.16 |
n.v. |
-0.17 |
n.v. |
n.v. |
|
NTF2-related export protein 2 |
| 256220954 |
|
Nynrin |
|
0 |
1115 |
0 |
0 |
0 |
|
n.v. |
0.19 |
n.v. |
n.v. |
n.v. |
|
protein NYNRIN |
| 110625732 |
|
Oard1 |
|
348 |
2311 |
2987 |
8513 |
9692 |
|
0.16 |
0.17 |
-0.05 |
0.04 |
-0.02 |
|
O-acetyl-ADP-ribose deacetylase 1 |
| 281332108 |
|
Oas1a |
|
0 |
10 |
78 |
900 |
0 |
|
n.v. |
0.08 |
0.04 |
-0.29 |
n.v. |
|
2'-5'-oligoadenylate synthase 1A |
| 31560524 |
|
Oas1g |
|
0 |
10 |
78 |
900 |
0 |
|
n.v. |
0.08 |
0.04 |
-0.29 |
n.v. |
|
2'-5' oligoadenylate synthetase 1G |
| 28827826 |
|
Obfc1 |
|
0 |
0 |
1457 |
6540 |
25788 |
|
n.v. |
n.v. |
0.1 |
-0.04 |
-0.02 |
|
CST complex subunit STN1 |
| 170763522 |
|
Obsl1 |
|
3661 |
0 |
2919 |
5984 |
407 |
|
0.14 |
n.v. |
0.04 |
0 |
-1.37 |
|
obscurin-like 1 |
| 12963675 |
|
Ociad1 |
|
2361 |
5271 |
4 |
0 |
0 |
|
0.03 |
-0.16 |
-1.39 |
n.v. |
n.v. |
|
OCIA domain-containing protein 1 isoform 1 |
| 229577356 |
|
Ociad1 |
|
2361 |
5271 |
4 |
0 |
0 |
|
0.03 |
-0.16 |
-1.39 |
n.v. |
n.v. |
|
OCIA domain-containing protein 1 isoform 2 |
| 229577358 |
|
Ociad1 |
|
2361 |
5271 |
4 |
0 |
0 |
|
0.03 |
-0.16 |
-1.39 |
n.v. |
n.v. |
|
OCIA domain-containing protein 1 isoform 3 |
| 38348576 |
|
Odf3l1 |
|
5473 |
0 |
1826 |
0 |
0 |
|
-0.06 |
n.v. |
-0.04 |
n.v. |
n.v. |
|
outer dense fiber protein 3-like protein 1 |
| 225007605 |
|
Ofd1 |
|
0 |
0 |
0 |
0 |
3266 |
|
n.v. |
n.v. |
n.v. |
n.v. |
-0.1 |
|
oral-facial-digital syndrome 1 protein homolog |
| 85861164;356582489 |
|
Ogdh |
|
159830 |
3597 |
1026 |
7203 |
0 |
|
0.02 |
-0.04 |
-0.31 |
-0.17 |
n.v. |
|
2-oxoglutarate dehydrogenase, mitochondrial isoform 3
precursor |
| 85861164 |
|
Ogdh |
|
0 |
0 |
0 |
0 |
2677 |
|
n.v. |
n.v. |
n.v. |
n.v. |
0.09 |
|
2-oxoglutarate dehydrogenase, mitochondrial isoform
3 |
| 356582477 |
|
Ogdh |
|
158493 |
3597 |
1026 |
7203 |
2677 |
|
0.02 |
-0.04 |
-0.31 |
-0.17 |
0.09 |
|
2-oxoglutarate dehydrogenase, mitochondrial isoform
1 |
| 356582479 |
|
Ogdh |
|
153349 |
3597 |
1026 |
7203 |
2677 |
|
0.04 |
-0.04 |
-0.31 |
-0.17 |
0.09 |
|
2-oxoglutarate dehydrogenase, mitochondrial isoform
2 |
| 356582492 |
|
Ogdh |
|
153349 |
3597 |
1026 |
7203 |
2677 |
|
0.04 |
-0.04 |
-0.31 |
-0.17 |
0.09 |
|
2-oxoglutarate dehydrogenase, mitochondrial isoform
4 |
| 124487483 |
|
Ogdhl |
|
32859 |
952 |
585 |
0 |
2677 |
|
0.13 |
0.01 |
-0.54 |
n.v. |
0.09 |
|
2-oxoglutarate dehydrogenase-like, mitochondrial |
| 147901538 |
|
Ogfod1 |
|
0 |
0 |
0 |
180 |
118 |
|
n.v. |
n.v. |
n.v. |
-0.17 |
0.23 |
|
2-oxoglutarate and iron-dependent oxygenase
domain-containing protein 1 isoform 1 |
| 148224284 |
|
Ogfod1 |
|
0 |
0 |
0 |
180 |
118 |
|
n.v. |
n.v. |
n.v. |
-0.17 |
0.23 |
|
2-oxoglutarate and iron-dependent oxygenase
domain-containing protein 1 isoform 2 |
| 258679484 |
|
Ogfr |
|
0 |
0 |
0 |
0 |
21890 |
|
n.v. |
n.v. |
n.v. |
n.v. |
-0.03 |
|
opioid growth factor receptor |
| 46909607 |
|
Ogt |
|
458 |
109 |
562 |
2587 |
7390 |
|
-0.16 |
-0.11 |
-0.01 |
-0.63 |
-0.19 |
|
UDP-N-acetylglucosamine--peptide
N-acetylglucosaminyltransferase 110 kDa subunit |
| 22164770 |
|
Oit1 |
|
0 |
570 |
0 |
0 |
0 |
|
n.v. |
0.13 |
n.v. |
n.v. |
n.v. |
|
protein FAM3D precursor |
| 21313144 |
|
Ola1 |
|
1153 |
5893 |
9586 |
13629 |
146549 |
|
0.05 |
0.16 |
0 |
0.07 |
0.03 |
|
obg-like ATPase 1 isoform a |
| 76677915 |
|
Ola1 |
|
1153 |
3705 |
4832 |
11509 |
42313 |
|
0.05 |
0.17 |
0 |
0.07 |
0.03 |
|
obg-like ATPase 1 isoform b |
| 121583683 |
|
Olfr1126 |
|
0 |
0 |
0 |
0 |
2677 |
|
n.v. |
n.v. |
n.v. |
n.v. |
0.09 |
|
olfactory receptor 1126 |
| 22129387 |
|
Olfr516 |
|
0 |
468 |
0 |
0 |
0 |
|
n.v. |
0.08 |
n.v. |
n.v. |
n.v. |
|
olfactory receptor 516 |
| 22129679 |
|
Olfr518 |
|
0 |
468 |
0 |
0 |
0 |
|
n.v. |
0.08 |
n.v. |
n.v. |
n.v. |
|
olfactory receptor 518 |
| 121247462 |
|
Olfr554 |
|
0 |
0 |
645 |
5615 |
0 |
|
n.v. |
n.v. |
-0.43 |
-0.15 |
n.v. |
|
olfactory receptor 554 |
| 22128813 |
|
Olfr643 |
|
0 |
0 |
0 |
0 |
2592 |
|
n.v. |
n.v. |
n.v. |
n.v. |
0.12 |
|
olfactory receptor 643 |
| 120407031 |
|
Olfr67 |
|
0 |
0 |
451 |
0 |
0 |
|
n.v. |
n.v. |
0.08 |
n.v. |
n.v. |
|
olfactory receptor 67 |
| 33239332 |
|
Olfr810 |
|
0 |
0 |
0 |
0 |
653 |
|
n.v. |
n.v. |
n.v. |
n.v. |
0.14 |
|
olfactory receptor 810 |
| 33239334 |
|
Olfr816 |
|
0 |
0 |
0 |
0 |
653 |
|
n.v. |
n.v. |
n.v. |
n.v. |
0.14 |
|
olfactory receptor 816 |
| 33239336 |
|
Olfr822 |
|
0 |
0 |
0 |
0 |
653 |
|
n.v. |
n.v. |
n.v. |
n.v. |
0.14 |
|
olfactory receptor 822 |
| 22380661 |
|
Olfr870 |
|
0 |
0 |
31 |
0 |
0 |
|
n.v. |
n.v. |
0.63 |
n.v. |
n.v. |
|
olfactory receptor 870 |
| 257196219 |
|
Olfr871 |
|
0 |
0 |
31 |
0 |
0 |
|
n.v. |
n.v. |
0.63 |
n.v. |
n.v. |
|
olfactory receptor 871 |
| 289629197 |
|
Olfr923 |
|
0 |
488 |
0 |
0 |
0 |
|
n.v. |
0.21 |
n.v. |
n.v. |
n.v. |
|
olfactory receptor 923 |
| 19526960 |
|
Opa1 |
|
0 |
3288 |
0 |
0 |
0 |
|
n.v. |
-0.28 |
n.v. |
n.v. |
n.v. |
|
dynamin-like 120 kDa protein, mitochondrial isoform 2
precursor |
| 312836758 |
|
Opa1 |
|
0 |
3179 |
0 |
0 |
0 |
|
n.v. |
-0.3 |
n.v. |
n.v. |
n.v. |
|
dynamin-like 120 kDa protein, mitochondrial isoform 1
precursor |
| 110625722 |
|
Opa3 |
|
0 |
739 |
0 |
0 |
0 |
|
n.v. |
-0.02 |
n.v. |
n.v. |
n.v. |
|
optic atrophy 3 protein homolog |
| 32469491 |
|
Optn |
|
0 |
0 |
0 |
0 |
6811 |
|
n.v. |
n.v. |
n.v. |
n.v. |
0.09 |
|
optineurin |
| 21313282 |
|
Ormdl2 |
|
0 |
0 |
1285 |
0 |
0 |
|
n.v. |
n.v. |
-0.25 |
n.v. |
n.v. |
|
ORM1-like protein 2 |
| 13385128 |
|
Ormdl3 |
|
0 |
0 |
1285 |
0 |
0 |
|
n.v. |
n.v. |
-0.25 |
n.v. |
n.v. |
|
ORM1-like protein 3 |
| 283837907 |
|
Os9 |
|
2581 |
1146 |
844 |
0 |
0 |
|
-0.07 |
-0.36 |
-0.48 |
n.v. |
n.v. |
|
protein OS-9 isoform 2 precursor |
| 283837911 |
|
Os9 |
|
2581 |
1146 |
844 |
0 |
0 |
|
-0.07 |
-0.36 |
-0.48 |
n.v. |
n.v. |
|
protein OS-9 isoform 1 precursor |
| 133504509 |
|
Osbp |
|
403 |
2920 |
7996 |
47853 |
1885 |
|
0.26 |
0.04 |
-0.09 |
-0.09 |
-0.03 |
|
oxysterol-binding protein 1 |
| 61744458 |
|
Osbp2 |
|
0 |
19 |
3576 |
24958 |
0 |
|
n.v. |
-1.79 |
-0.08 |
-0.22 |
n.v. |
|
oxysterol-binding protein 2 |
| 22507367 |
|
Osbpl10 |
|
0 |
378 |
388 |
0 |
0 |
|
n.v. |
0.07 |
-0.36 |
n.v. |
n.v. |
|
oxysterol-binding protein-related protein 10 |
| 257196261 |
|
Osbpl11 |
|
0 |
378 |
401 |
0 |
0 |
|
n.v. |
0.07 |
0.01 |
n.v. |
n.v. |
|
oxysterol-binding protein-related protein 11 |
| 110625879 |
|
Osbpl2 |
|
0 |
0 |
0 |
638 |
0 |
|
n.v. |
n.v. |
n.v. |
-1.38 |
n.v. |
|
oxysterol-binding protein-related protein 2 |
| 254692962 |
|
Osbpl3 |
|
0 |
1639 |
309 |
16510 |
7486 |
|
n.v. |
0.22 |
0.19 |
-1.26 |
-0.94 |
|
oxysterol-binding protein-related protein 3 isoform 1 |
| 254692964 |
|
Osbpl3 |
|
0 |
1639 |
309 |
16510 |
7486 |
|
n.v. |
0.22 |
0.19 |
-1.26 |
-0.94 |
|
oxysterol-binding protein-related protein 3 isoform 2 |
| 51243034 |
|
Osbpl8 |
|
970 |
67 |
98 |
0 |
0 |
|
-0.02 |
-0.33 |
-0.25 |
n.v. |
n.v. |
|
oxysterol-binding protein-like protein 8 isoform a |
| 51243036 |
|
Osbpl8 |
|
970 |
67 |
98 |
0 |
0 |
|
-0.02 |
-0.33 |
-0.25 |
n.v. |
n.v. |
|
oxysterol-binding protein-like protein 8 isoform b |
| 198278439 |
|
Osbpl9 |
|
0 |
641 |
375 |
0 |
0 |
|
n.v. |
-0.41 |
-0.2 |
n.v. |
n.v. |
|
oxysterol-binding protein-related protein 9 isoform b |
| 198278441 |
|
Osbpl9 |
|
0 |
641 |
375 |
0 |
0 |
|
n.v. |
-0.41 |
-0.2 |
n.v. |
n.v. |
|
oxysterol-binding protein-related protein 9 isoform c |
| 307938353 |
|
Osbpl9 |
|
0 |
641 |
375 |
0 |
0 |
|
n.v. |
-0.41 |
-0.2 |
n.v. |
n.v. |
|
oxysterol-binding protein-related protein 9 isoform a |
| 84662768 |
|
Osgep |
|
0 |
1148 |
2287 |
2104 |
75952 |
|
n.v. |
0.29 |
0.14 |
0.05 |
0.02 |
|
probable tRNA threonylcarbamoyladenosine biosynthesis
protein Osgep |
| 13384930 |
|
Ostc |
|
34525 |
357 |
736 |
1531 |
0 |
|
-0.02 |
-0.24 |
-0.35 |
-0.37 |
n.v. |
|
oligosaccharyltransferase complex subunit OSTC |
| 22267440 |
|
Ostf1 |
|
677 |
739 |
1307 |
0 |
39764 |
|
0.09 |
0.3 |
0.1 |
n.v. |
0.14 |
|
osteoclast-stimulating factor 1 |
| 19527388 |
|
Otub1 |
|
16988 |
21986 |
20947 |
24352 |
201564 |
|
0.47 |
0.15 |
0.01 |
0.11 |
0.13 |
|
ubiquitin thioesterase OTUB1 |
| 124487191 |
|
Otud4 |
|
0 |
0 |
9983 |
1162 |
0 |
|
n.v. |
n.v. |
0.23 |
-0.44 |
n.v. |
|
OTU domain-containing protein 4 isoform 2 |
| 365733608 |
|
Otud4 |
|
0 |
0 |
9983 |
1162 |
0 |
|
n.v. |
n.v. |
0.23 |
-0.44 |
n.v. |
|
OTU domain-containing protein 4 isoform 1 |
| 31560768 |
|
Otud5 |
|
0 |
0 |
0 |
0 |
182 |
|
n.v. |
n.v. |
n.v. |
n.v. |
0.56 |
|
OTU domain-containing protein 5 |
| 157364966 |
|
Otud6b |
|
0 |
0 |
313 |
2325 |
0 |
|
n.v. |
n.v. |
0.13 |
-0.6 |
n.v. |
|
OTU domain-containing protein 6B |
| 18700018 |
|
Otud7a |
|
0 |
0 |
133 |
0 |
0 |
|
n.v. |
n.v. |
-0.29 |
n.v. |
n.v. |
|
OTU domain-containing protein 7A |
| 71043959 |
|
Otud7b |
|
0 |
0 |
3 |
205 |
0 |
|
n.v. |
n.v. |
0.41 |
0.26 |
n.v. |
|
zinc finger, A20 domain containing 1 |
| 18158418 |
|
Ovca2 |
|
0 |
741 |
407 |
475 |
12112 |
|
n.v. |
0.4 |
0.03 |
0.17 |
0.16 |
|
ovarian cancer-associated gene 2 protein homolog |
| 23308705 |
|
Ovol2 |
|
0 |
132 |
0 |
0 |
0 |
|
n.v. |
0 |
n.v. |
n.v. |
n.v. |
|
transcription factor Ovo-like 2 isoform A |
| 18266680 |
|
Oxct1 |
|
24841 |
27991 |
123 |
0 |
11 |
|
0.24 |
0 |
-0.13 |
n.v. |
0.77 |
|
succinyl-CoA:3-ketoacid coenzyme A transferase 1,
mitochondrial precursor |
| 170932556 |
|
Oxnad1 |
|
0 |
58 |
0 |
0 |
0 |
|
n.v. |
0.15 |
n.v. |
n.v. |
n.v. |
|
oxidoreductase NAD-binding domain-containing protein 1
precursor |
| 194328704 |
|
Oxr1 |
|
0 |
0 |
653 |
0 |
13687 |
|
n.v. |
n.v. |
-0.13 |
n.v. |
0.15 |
|
oxidation resistance protein 1 isoform C |
| 18700026 |
|
Oxr1 |
|
0 |
44 |
2518 |
450 |
90120 |
|
n.v. |
-0.91 |
-0.06 |
0.26 |
0.16 |
|
oxidation resistance protein 1 isoform A |
| 194328702 |
|
Oxr1 |
|
0 |
44 |
2518 |
450 |
80118 |
|
n.v. |
-0.91 |
-0.06 |
0.26 |
0.15 |
|
oxidation resistance protein 1 isoform B |
| 194328706 |
|
Oxr1 |
|
0 |
44 |
2518 |
450 |
90228 |
|
n.v. |
-0.91 |
-0.06 |
0.26 |
0.16 |
|
oxidation resistance protein 1 isoform D |
| 194328708 |
|
Oxr1 |
|
0 |
44 |
2518 |
450 |
90131 |
|
n.v. |
-0.91 |
-0.06 |
0.26 |
0.16 |
|
oxidation resistance protein 1 isoform E |
| 58037235 |
|
Oxsm |
|
0 |
900 |
0 |
0 |
0 |
|
n.v. |
-0.18 |
n.v. |
n.v. |
n.v. |
|
3-oxoacyl-[acyl-carrier-protein] synthase, mitochondrial
precursor |
| 365777424 |
|
Oxsr1 |
|
0 |
2914 |
3064 |
7580 |
2795 |
|
n.v. |
0.2 |
0.05 |
0.18 |
0.1 |
|
serine/threonine-protein kinase OSR1 |
| 117676374 |
|
P2rx4 |
|
29894 |
6158 |
19263 |
4355 |
82046 |
|
0.14 |
-0.03 |
0.02 |
0.2 |
0.14 |
|
P2X purinoceptor 4 |
| 238624118 |
|
P2rx5 |
|
2471 |
0 |
0 |
0 |
0 |
|
0.07 |
n.v. |
n.v. |
n.v. |
n.v. |
|
purinergic receptor P2X5 |
| 33859596 |
|
P4ha1 |
|
3075 |
1374 |
3534 |
1105 |
0 |
|
0.38 |
-0.01 |
-0.07 |
-1.01 |
n.v. |
|
prolyl 4-hydroxylase subunit alpha-1 precursor |
| 42415475 |
|
P4hb |
|
921122 |
138154 |
221539 |
20980 |
283256 |
|
0.08 |
-0.23 |
-0.21 |
-0.28 |
-0.34 |
|
protein disulfide-isomerase precursor |
| 6755100 |
|
Pa2g4 |
|
198931 |
53852 |
339631 |
845585 |
27556 |
|
-0.01 |
0.16 |
0.01 |
-0.06 |
-0.01 |
|
proliferation-associated protein 2G4 |
| 31560656 |
|
Pabpc1 |
|
69471 |
94969 |
399816 |
631483 |
13901 |
|
0.16 |
0.14 |
0.14 |
0 |
-0.17 |
|
polyadenylate-binding protein 1 |
| 166157896 |
|
Pabpc1l |
|
5217 |
1534 |
20587 |
54139 |
96 |
|
0.15 |
0.1 |
0.09 |
0.09 |
0.74 |
|
polyadenylate-binding protein 1-like |
| 309271474 |
|
Pabpc1l2b-ps |
|
7213 |
26253 |
6763 |
107722 |
0 |
|
0.04 |
-0.18 |
0.11 |
-0.03 |
n.v. |
|
PREDICTED: polyadenylate-binding protein 1-like
2-like |
| 6754972 |
|
Pabpc2 |
|
32786 |
21660 |
151098 |
213021 |
7743 |
|
0.22 |
0.16 |
0.12 |
-0.01 |
-0.17 |
|
poly A binding protein, cytoplasmic 2 |
| 22507391 |
|
Pabpc4 |
|
25574 |
9680 |
83352 |
92530 |
632 |
|
-0.15 |
0.13 |
0.13 |
0.02 |
0.56 |
|
polyadenylate-binding protein 4 isoform 2 |
| 34419622 |
|
Pabpc4 |
|
25574 |
9680 |
83352 |
92530 |
632 |
|
-0.15 |
0.13 |
0.13 |
0.02 |
0.56 |
|
polyadenylate-binding protein 4 isoform 1 |
| 168229272 |
|
Pabpc4l |
|
0 |
0 |
2539 |
0 |
0 |
|
n.v. |
n.v. |
0.12 |
n.v. |
n.v. |
|
poly(A) binding protein, cytoplasmic 4-like |
| 29336045 |
|
Pabpc5 |
|
0 |
2714 |
7141 |
6712 |
3149 |
|
n.v. |
0.01 |
-0.05 |
-0.33 |
-0.28 |
|
polyadenylate-binding protein 5 |
| 255652857 |
|
Pabpc6 |
|
43934 |
61747 |
249584 |
384075 |
10228 |
|
0.2 |
0.15 |
0.13 |
-0.02 |
-0.04 |
|
poly(A) binding protein, cytoplasmic 3 |
| 9506945 |
|
Pabpn1 |
|
0 |
0 |
50 |
2538 |
0 |
|
n.v. |
n.v. |
0.16 |
0.32 |
n.v. |
|
polyadenylate-binding protein 2 |
| 54291704 |
|
Pacs1 |
|
0 |
0 |
288 |
3430 |
643 |
|
n.v. |
n.v. |
0.26 |
0.31 |
0.06 |
|
phosphofurin acidic cluster sorting protein 1 |
| 7106381 |
|
Pacsin2 |
|
0 |
3862 |
40701 |
108451 |
13751 |
|
n.v. |
0.23 |
-0.01 |
0.04 |
0.08 |
|
protein kinase C and casein kinase substrate in neurons
protein 2 |
| 28077027 |
|
Pacsin3 |
|
0 |
1987 |
12640 |
1621 |
0 |
|
n.v. |
-0.09 |
-0.18 |
-0.11 |
n.v. |
|
protein kinase C and casein kinase II substrate protein 3 |
| 171906557 |
|
Padi2 |
|
0 |
2453 |
732 |
26922 |
30629 |
|
n.v. |
0.07 |
0.09 |
0.07 |
0.05 |
|
protein-arginine deiminase type-2 |
| 31980912 |
|
Paf1 |
|
0 |
115 |
0 |
573 |
300 |
|
n.v. |
-0.46 |
n.v. |
0.48 |
-0.89 |
|
RNA polymerase II-associated factor 1 homolog |
| 7305363 |
|
Pafah1b1 |
|
0 |
12502 |
35415 |
46150 |
125869 |
|
n.v. |
0.19 |
-0.04 |
0.1 |
0.03 |
|
platelet-activating factor acetylhydrolase IB subunit
alpha |
| 40254624 |
|
Pafah1b2 |
|
7011 |
900 |
1336 |
3741 |
26870 |
|
0.05 |
0.34 |
-0.06 |
0.16 |
0.13 |
|
platelet-activating factor acetylhydrolase IB subunit
beta |
| 6679201 |
|
Pafah1b3 |
|
10142 |
1148 |
680 |
2930 |
86801 |
|
0.07 |
0.06 |
-0.02 |
0.12 |
0.19 |
|
platelet-activating factor acetylhydrolase IB subunit
gamma |
| 225579137 |
|
Pafah2 |
|
0 |
0 |
140 |
2767 |
0 |
|
n.v. |
n.v. |
-0.18 |
-0.08 |
n.v. |
|
platelet-activating factor acetylhydrolase 2,
cytoplasmic |
| 13385434 |
|
Paics |
|
7927 |
28676 |
19319 |
182505 |
318479 |
|
0.47 |
0.19 |
0 |
0.32 |
0.04 |
|
multifunctional protein ADE2 |
| 119943127 |
|
Paip1 |
|
0 |
0 |
803 |
0 |
10784 |
|
n.v. |
n.v. |
-0.27 |
n.v. |
0.02 |
|
polyadenylate-binding protein-interacting protein 1
isoform 2 |
| 21703908 |
|
Paip1 |
|
0 |
0 |
803 |
0 |
10784 |
|
n.v. |
n.v. |
-0.27 |
n.v. |
0.02 |
|
polyadenylate-binding protein-interacting protein 1
isoform 1 |
| 112181194 |
|
Pak1 |
|
0 |
1971 |
1769 |
3765 |
80471 |
|
n.v. |
0.1 |
0.05 |
-0.04 |
0.06 |
|
serine/threonine-protein kinase PAK 1 |
| 145046259 |
|
Pak1ip1 |
|
0 |
71 |
3702 |
4715 |
0 |
|
n.v. |
0.02 |
-0.11 |
-0.01 |
n.v. |
|
p21-activated protein kinase-interacting protein 1 |
| 46559406 |
|
Pak2 |
|
0 |
6131 |
10615 |
24098 |
198051 |
|
n.v. |
0.2 |
0.05 |
-0.01 |
0.06 |
|
serine/threonine-protein kinase PAK 2 |
| 304307781 |
|
Pak3 |
|
0 |
1094 |
1917 |
6205 |
84851 |
|
n.v. |
0.34 |
0.08 |
0.21 |
0.07 |
|
serine/threonine-protein kinase PAK 3 isoform A |
| 304307783 |
|
Pak3 |
|
0 |
1094 |
1917 |
6205 |
84851 |
|
n.v. |
0.34 |
0.08 |
0.21 |
0.07 |
|
serine/threonine-protein kinase PAK 3 isoform B |
| 304307785 |
|
Pak3 |
|
0 |
1094 |
1917 |
6205 |
84851 |
|
n.v. |
0.34 |
0.08 |
0.21 |
0.07 |
|
serine/threonine-protein kinase PAK 3 isoform C |
| 304307788 |
|
Pak3 |
|
0 |
1094 |
1917 |
6205 |
84851 |
|
n.v. |
0.34 |
0.08 |
0.21 |
0.07 |
|
serine/threonine-protein kinase PAK 3 isoform D |
| 29336032 |
|
Pak4 |
|
0 |
0 |
519 |
0 |
0 |
|
n.v. |
n.v. |
-0.38 |
n.v. |
n.v. |
|
serine/threonine-protein kinase PAK 4 |
| 171846274 |
|
Pald1 |
|
0 |
228 |
2539 |
1040 |
1724 |
|
n.v. |
0.07 |
0.03 |
0.29 |
-0.03 |
|
paladin |
| 124487061 |
|
Palld |
|
0 |
0 |
253 |
0 |
1596 |
|
n.v. |
n.v. |
-3.02 |
n.v. |
0.15 |
|
palladin |
| 239985639 |
|
Palm |
|
0 |
0 |
124 |
0 |
0 |
|
n.v. |
n.v. |
-0.05 |
n.v. |
n.v. |
|
paralemmin-1 isoform 1 |
| 239985643 |
|
Palm |
|
0 |
0 |
124 |
0 |
0 |
|
n.v. |
n.v. |
-0.05 |
n.v. |
n.v. |
|
paralemmin-1 isoform 2 |
| 124430707 |
|
Palm3 |
|
0 |
983 |
2643 |
0 |
0 |
|
n.v. |
0.31 |
0.03 |
n.v. |
n.v. |
|
paralemmin-3 |
| 153792657 |
|
Pam |
|
0 |
0 |
168 |
0 |
0 |
|
n.v. |
n.v. |
-0.17 |
n.v. |
n.v. |
|
peptidyl-glycine alpha-amidating monooxygenase precursor |
| 13385012 |
|
Pam16 |
|
5144 |
992 |
119 |
0 |
0 |
|
0.26 |
-0.09 |
-0.09 |
n.v. |
n.v. |
|
mitochondrial import inner membrane translocase subunit
TIM16 |
| 29789349 |
|
Pan2 |
|
0 |
0 |
1018 |
0 |
0 |
|
n.v. |
n.v. |
0.33 |
n.v. |
n.v. |
|
PAB-dependent poly(A)-specific ribonuclease subunit 2
isoform 1 |
| 356640187 |
|
Pan2 |
|
0 |
0 |
1018 |
0 |
0 |
|
n.v. |
n.v. |
0.33 |
n.v. |
n.v. |
|
PAB-dependent poly(A)-specific ribonuclease subunit 2
isoform 2 |
| 356640190 |
|
Pan2 |
|
0 |
0 |
1018 |
0 |
0 |
|
n.v. |
n.v. |
0.33 |
n.v. |
n.v. |
|
PAB-dependent poly(A)-specific ribonuclease subunit 2
isoform 3 |
| 270265830 |
|
Pan3 |
|
0 |
0 |
323 |
0 |
0 |
|
n.v. |
n.v. |
0.28 |
n.v. |
n.v. |
|
PAB-dependent poly(A)-specific ribonuclease subunit
3 |
| 12963829 |
|
Pank1 |
|
0 |
0 |
0 |
0 |
932 |
|
n.v. |
n.v. |
n.v. |
n.v. |
-0.07 |
|
pantothenate kinase 1 isoform 2 |
| 167234376 |
|
Pank1 |
|
0 |
0 |
0 |
0 |
932 |
|
n.v. |
n.v. |
n.v. |
n.v. |
-0.07 |
|
pantothenate kinase 1 isoform 1 |
| 51571537 |
|
Pank2 |
|
0 |
69 |
82 |
360 |
921 |
|
n.v. |
0.29 |
-0.11 |
0.19 |
0.02 |
|
pantothenate kinase 2 |
| 22122397 |
|
Pank3 |
|
0 |
0 |
0 |
0 |
932 |
|
n.v. |
n.v. |
n.v. |
n.v. |
-0.07 |
|
pantothenate kinase 3 |
| 240255614 |
|
Pank4 |
|
0 |
0 |
1 |
0 |
557 |
|
n.v. |
n.v. |
-0.32 |
n.v. |
0.62 |
|
pantothenate kinase 4 |
| 28173566 |
|
Paox |
|
0 |
0 |
0 |
0 |
9489 |
|
n.v. |
n.v. |
n.v. |
n.v. |
0.07 |
|
peroxisomal N(1)-acetyl-spermine/spermidine oxidase |
| 21914853 |
|
Papola |
|
0 |
0 |
0 |
0 |
6747 |
|
n.v. |
n.v. |
n.v. |
n.v. |
0.05 |
|
poly(A) polymerase alpha |
| 9910588 |
|
Papolb |
|
0 |
0 |
0 |
0 |
4755 |
|
n.v. |
n.v. |
n.v. |
n.v. |
-0.39 |
|
poly(A) polymerase beta |
| 226494207 |
|
Papolg |
|
0 |
0 |
0 |
0 |
3588 |
|
n.v. |
n.v. |
n.v. |
n.v. |
-0.42 |
|
poly(A) polymerase gamma |
| 6754982 |
|
Papss1 |
|
18 |
4321 |
3000 |
19654 |
44123 |
|
0.26 |
-0.03 |
-0.01 |
0.34 |
0.07 |
|
bifunctional 3'-phosphoadenosine 5'-phosphosulfate
synthase 1 |
| 319918850 |
|
Papss2 |
|
18 |
2094 |
1605 |
3078 |
118 |
|
0.26 |
-0.1 |
0.09 |
0.21 |
0.47 |
|
bifunctional 3'-phosphoadenosine 5'-phosphosulfate
synthase 2 isoform 2 |
| 61098088 |
|
Papss2 |
|
18 |
2094 |
1605 |
3078 |
118 |
|
0.26 |
-0.1 |
0.09 |
0.21 |
0.47 |
|
bifunctional 3'-phosphoadenosine 5'-phosphosulfate
synthase 2 isoform 1 |
| 12963841 |
|
Paqr4 |
|
0 |
77 |
0 |
0 |
0 |
|
n.v. |
-0.63 |
n.v. |
n.v. |
n.v. |
|
progestin and adipoQ receptor family member 4 |
| 171184413 |
|
Pard3 |
|
0 |
0 |
217 |
0 |
0 |
|
n.v. |
n.v. |
0.1 |
n.v. |
n.v. |
|
partitioning defective 3 homolog isoform 3 |
| 171184415 |
|
Pard3 |
|
0 |
0 |
217 |
0 |
0 |
|
n.v. |
n.v. |
0.1 |
n.v. |
n.v. |
|
partitioning defective 3 homolog isoform 4 |
| 61888842 |
|
Pard3 |
|
0 |
0 |
217 |
0 |
0 |
|
n.v. |
n.v. |
0.1 |
n.v. |
n.v. |
|
partitioning defective 3 homolog isoform 2 |
| 61888844 |
|
Pard3 |
|
0 |
0 |
217 |
0 |
0 |
|
n.v. |
n.v. |
0.1 |
n.v. |
n.v. |
|
partitioning defective 3 homolog isoform 1 |
| 163310767 |
|
Pard3b |
|
0 |
482 |
0 |
0 |
0 |
|
n.v. |
-0.04 |
n.v. |
n.v. |
n.v. |
|
partitioning defective 3 homolog B |
| 114145495 |
|
Pard6a |
|
0 |
620 |
547 |
20579 |
2474 |
|
n.v. |
0.3 |
-0.11 |
0.01 |
0.12 |
|
partitioning defective 6 homolog alpha isoform 1 |
| 114145499 |
|
Pard6a |
|
0 |
620 |
547 |
20579 |
2474 |
|
n.v. |
0.3 |
-0.11 |
0.01 |
0.12 |
|
partitioning defective 6 homolog alpha isoform 2 |
| 114145501 |
|
Pard6a |
|
0 |
620 |
547 |
20579 |
2474 |
|
n.v. |
0.3 |
-0.11 |
0.01 |
0.12 |
|
partitioning defective 6 homolog alpha isoform 3 |
| 253314520 |
|
Pard6b |
|
0 |
800 |
3617 |
69733 |
9585 |
|
n.v. |
0.38 |
-0.14 |
0.04 |
0.18 |
|
partitioning defective 6 homolog beta |
| 238550190 |
|
Pard6g |
|
0 |
620 |
1131 |
24074 |
4177 |
|
n.v. |
0.3 |
-0.26 |
0.03 |
0.18 |
|
partitioning defective 6 homolog gamma |
| 120444912 |
|
Parg |
|
0 |
0 |
297 |
704 |
0 |
|
n.v. |
n.v. |
0.07 |
0.1 |
n.v. |
|
poly(ADP-ribose) glycohydrolase |
| 55741460 |
|
Park7 |
|
0 |
4655 |
10957 |
892 |
332348 |
|
n.v. |
0.17 |
0 |
-0.43 |
0.07 |
|
protein DJ-1 |
| 21311877 |
|
Parn |
|
0 |
424 |
503 |
7285 |
24289 |
|
n.v. |
0.39 |
-0.06 |
-0.1 |
0.09 |
|
poly(A)-specific ribonuclease PARN |
| 20806109 |
|
Parp1 |
|
7322 |
1530 |
7308 |
68734 |
2752 |
|
-0.1 |
-0.14 |
-0.09 |
-0.05 |
0.26 |
|
poly [ADP-ribose] polymerase 1 |
| 254675288 |
|
Parp10 |
|
0 |
0 |
0 |
0 |
503 |
|
n.v. |
n.v. |
n.v. |
n.v. |
-0.49 |
|
poly (ADP-ribose) polymerase family, member 10 |
| 171543897 |
|
Parp12 |
|
0 |
0 |
1652 |
475 |
0 |
|
n.v. |
n.v. |
-0.04 |
0.04 |
n.v. |
|
poly [ADP-ribose] polymerase 12 |
| 25014095 |
|
Parp3 |
|
458 |
77 |
335 |
6319 |
407 |
|
-0.53 |
-0.69 |
0.15 |
-0.04 |
-0.05 |
|
poly [ADP-ribose] polymerase 3 |
| 281485553 |
|
Parp4 |
|
0 |
0 |
12 |
0 |
0 |
|
n.v. |
n.v. |
0.6 |
n.v. |
n.v. |
|
poly (ADP-ribose) polymerase family, member 4 |
| 13384918 |
|
Parp9 |
|
0 |
0 |
4015 |
1703 |
0 |
|
n.v. |
n.v. |
0.1 |
1.62 |
n.v. |
|
poly [ADP-ribose] polymerase 9 |
| 139948347 |
|
Pars2 |
|
0 |
307 |
0 |
0 |
0 |
|
n.v. |
0.19 |
n.v. |
n.v. |
n.v. |
|
probable proline--tRNA ligase, mitochondrial isoform 1 |
| 139948914 |
|
Pars2 |
|
0 |
307 |
0 |
0 |
0 |
|
n.v. |
0.19 |
n.v. |
n.v. |
n.v. |
|
probable proline--tRNA ligase, mitochondrial isoform 2 |
| 31982526 |
|
Parva |
|
3442 |
8425 |
6605 |
17001 |
22244 |
|
-0.19 |
0.04 |
-0.01 |
-0.25 |
-0.62 |
|
alpha-parvin |
| 18860551 |
|
Parvb |
|
0 |
929 |
205 |
1924 |
1146 |
|
n.v. |
0.08 |
0.43 |
0.03 |
-0.49 |
|
beta-parvin |
| 194328775 |
|
Pask |
|
0 |
0 |
0 |
0 |
9092 |
|
n.v. |
n.v. |
n.v. |
n.v. |
0.15 |
|
PAS domain-containing serine/threonine-protein kinase |
| 255522964 |
|
Patl1 |
|
0 |
0 |
429 |
393 |
0 |
|
n.v. |
n.v. |
0.18 |
0.35 |
n.v. |
|
protein PAT1 homolog 1 |
| 87196490 |
|
Pawr |
|
1227 |
770 |
252 |
2456 |
28048 |
|
0.13 |
0.34 |
0.23 |
0.32 |
0.12 |
|
PRKC apoptosis WT1 regulator protein |
| 226437608 |
|
Paxbp1 |
|
1080 |
0 |
310 |
0 |
0 |
|
-0.02 |
n.v. |
0.16 |
n.v. |
n.v. |
|
PAX3- and PAX7-binding protein 1 |
| 13385810 |
|
Pbdc1 |
|
0 |
944 |
2076 |
2865 |
26720 |
|
n.v. |
0.4 |
0.34 |
-0.06 |
0.09 |
|
protein PBDC1 |
| 12963575 |
|
Pbk |
|
0 |
0 |
127 |
0 |
7100 |
|
n.v. |
n.v. |
0.11 |
n.v. |
0.15 |
|
lymphokine-activated killer T-cell-originated protein
kinase |
| 31560132 |
|
Pbld1 |
|
0 |
0 |
0 |
0 |
203 |
|
n.v. |
n.v. |
n.v. |
n.v. |
-0.6 |
|
phenazine biosynthesis-like domain-containing protein
1 |
| 13385584 |
|
Pbld2 |
|
0 |
0 |
0 |
0 |
203 |
|
n.v. |
n.v. |
n.v. |
n.v. |
-0.6 |
|
phenazine biosynthesis-like domain-containing protein
2 |
| 22122651 |
|
Pbxip1 |
|
513 |
157 |
183 |
0 |
0 |
|
0.54 |
-0.08 |
-0.58 |
n.v. |
n.v. |
|
pre-B-cell leukemia transcription factor-interacting
protein 1 |
| 13384608 |
|
Pcbd1 |
|
8274 |
956 |
1599 |
2472 |
55068 |
|
0.02 |
0.01 |
-0.01 |
0.06 |
0.1 |
|
pterin-4-alpha-carbinolamine dehydratase |
| 52421794 |
|
Pcbd2 |
|
1812 |
676 |
171 |
0 |
2153 |
|
0.02 |
-0.22 |
-0.08 |
n.v. |
0.1 |
|
pterin-4-alpha-carbinolamine dehydratase 2 |
| 6754994 |
|
Pcbp1 |
|
354459 |
40786 |
153311 |
286290 |
649896 |
|
-0.12 |
0.09 |
-0.02 |
-0.03 |
-0.05 |
|
poly(rC)-binding protein 1 |
| 157041229 |
|
Pcbp2 |
|
491279 |
35375 |
143505 |
402239 |
325548 |
|
-0.08 |
0.05 |
0 |
-0.06 |
-0.1 |
|
poly(rC)-binding protein 2 isoform 1 |
| 157042772 |
|
Pcbp2 |
|
491279 |
35375 |
143110 |
401911 |
325548 |
|
-0.08 |
0.05 |
0 |
-0.06 |
-0.1 |
|
poly(rC)-binding protein 2 isoform 3 |
| 157057549 |
|
Pcbp2 |
|
491279 |
35375 |
143505 |
401584 |
325548 |
|
-0.08 |
0.05 |
0 |
-0.07 |
-0.1 |
|
poly(rC)-binding protein 2 isoform 2 |
| 291327528 |
|
Pcbp2 |
|
491279 |
32665 |
136272 |
381079 |
323962 |
|
-0.08 |
0.04 |
0 |
-0.07 |
-0.1 |
|
poly(rC)-binding protein 2 isoform 4 |
| 171906586 |
|
Pcbp3 |
|
315760 |
19744 |
108142 |
257338 |
193971 |
|
-0.07 |
0.1 |
0.02 |
-0.07 |
-0.01 |
|
poly(rC)-binding protein 3 |
| 227497228 |
|
Pcbp4 |
|
0 |
0 |
10 |
0 |
0 |
|
n.v. |
n.v. |
0.39 |
n.v. |
n.v. |
|
poly(rC)-binding protein 4 |
| 254540162 |
|
Pcca |
|
21546 |
18535 |
0 |
3929 |
0 |
|
-0.15 |
-0.19 |
n.v. |
0.02 |
n.v. |
|
propionyl-CoA carboxylase alpha chain, mitochondrial
precursor |
| 13385310 |
|
Pccb |
|
25098 |
9617 |
4 |
4175 |
0 |
|
0.12 |
0.08 |
0.04 |
-0.12 |
n.v. |
|
propionyl-CoA carboxylase beta chain, mitochondrial
precursor |
| 34328319 |
|
Pcdh1 |
|
0 |
31 |
0 |
0 |
0 |
|
n.v. |
0.2 |
n.v. |
n.v. |
n.v. |
|
protocadherin-1 precursor |
| 6681021 |
|
Pcdha4 |
|
0 |
0 |
1169 |
0 |
1981 |
|
n.v. |
n.v. |
0.13 |
n.v. |
0.11 |
|
protocadherin alpha-4 precursor |
| 292658765 |
|
Pcdha4-g |
|
0 |
0 |
1169 |
0 |
1981 |
|
n.v. |
n.v. |
0.13 |
n.v. |
0.11 |
|
protocadherin alpha 4-gamma precursor |
| 119372296 |
|
Pcid2 |
|
531 |
188 |
1330 |
3864 |
0 |
|
-0.22 |
-0.06 |
-0.16 |
0.17 |
n.v. |
|
PCI domain-containing protein 2 |
| 22122647 |
|
Pcif1 |
|
0 |
0 |
0 |
0 |
364 |
|
n.v. |
n.v. |
n.v. |
n.v. |
-0.76 |
|
phosphorylated CTD-interacting factor 1 |
| 28077029 |
|
Pck2 |
|
136801 |
28925 |
430 |
0 |
1949 |
|
-0.08 |
-0.14 |
-0.53 |
n.v. |
-0.3 |
|
phosphoenolpyruvate carboxykinase [GTP], mitochondrial |
| 170763496 |
|
Pcm1 |
|
0 |
119 |
3072 |
115 |
0 |
|
n.v. |
0.16 |
-0.32 |
0 |
n.v. |
|
pericentriolar material 1 protein |
| 226530884 |
|
Pcmt1 |
|
0 |
3398 |
1592 |
3430 |
59823 |
|
n.v. |
0.15 |
-0.07 |
0.17 |
0.05 |
|
protein-L-isoaspartate(D-aspartate) O-methyltransferase |
| 33942104 |
|
Pcmtd1 |
|
0 |
0 |
13 |
450 |
867 |
|
n.v. |
n.v. |
0.14 |
0.9 |
-0.02 |
|
protein-L-isoaspartate O-methyltransferase
domain-containing protein 1 |
| 23956398 |
|
Pcmtd2 |
|
0 |
0 |
57 |
229 |
471 |
|
n.v. |
n.v. |
0.29 |
0.34 |
0.19 |
|
protein-L-isoaspartate O-methyltransferase
domain-containing protein 2 |
| 7242171 |
|
Pcna |
|
247644 |
29336 |
66872 |
387619 |
1599636 |
|
0.03 |
0.09 |
-0.01 |
0.05 |
-0.01 |
|
proliferating cell nuclear antigen |
| 71480098 |
|
Pcnp |
|
0 |
98 |
773 |
4674 |
73424 |
|
n.v. |
0.4 |
0.26 |
0.31 |
0.08 |
|
PEST proteolytic signal-containing nuclear protein |
| 93004085 |
|
Pcnt |
|
0 |
129 |
67 |
0 |
0 |
|
n.v. |
-0.02 |
-0.19 |
n.v. |
n.v. |
|
pericentrin |
| 126352572 |
|
Pcnxl2 |
|
0 |
0 |
0 |
0 |
1242 |
|
n.v. |
n.v. |
n.v. |
n.v. |
0.3 |
|
pecanex-like protein 2 isoform 2 |
| 157743254 |
|
Pcnxl3 |
|
0 |
10 |
6 |
0 |
0 |
|
n.v. |
0.24 |
-0.33 |
n.v. |
n.v. |
|
pecanex-like protein 3 |
| 253314509 |
|
Pcsk5 |
|
0 |
0 |
0 |
0 |
14104 |
|
n.v. |
n.v. |
n.v. |
n.v. |
0.06 |
|
proprotein convertase subtilisin/kexin type 5 isoform 2
preproprotein |
| 299523019 |
|
Pcsk5 |
|
0 |
0 |
0 |
0 |
14104 |
|
n.v. |
n.v. |
n.v. |
n.v. |
0.06 |
|
proprotein convertase subtilisin/kexin type 5 isoform 1
preproprotein |
| 117320552 |
|
Pctp |
|
0 |
0 |
401 |
0 |
2067 |
|
n.v. |
n.v. |
-0.2 |
n.v. |
0.09 |
|
phosphatidylcholine transfer protein |
| 251823978 |
|
Pcx |
|
61014 |
11170 |
0 |
0 |
2410 |
|
0.02 |
-0.12 |
n.v. |
n.v. |
-0.15 |
|
pyruvate carboxylase, mitochondrial isoform 2 |
| 251823980 |
|
Pcx |
|
61014 |
11170 |
0 |
0 |
2410 |
|
0.02 |
-0.12 |
n.v. |
n.v. |
-0.15 |
|
pyruvate carboxylase, mitochondrial isoform 1 |
| 13385294 |
|
Pcyox1 |
|
17244 |
20249 |
16975 |
2816 |
0 |
|
-0.13 |
-0.24 |
-0.34 |
-0.47 |
n.v. |
|
prenylcysteine oxidase precursor |
| 27370248 |
|
Pcyox1l |
|
0 |
1042 |
0 |
0 |
0 |
|
n.v. |
-0.48 |
n.v. |
n.v. |
n.v. |
|
prenylcysteine oxidase-like precursor |
| 6753552 |
|
Pcyt1a |
|
0 |
710 |
6231 |
14595 |
20541 |
|
n.v. |
0.27 |
0.12 |
0.1 |
0.11 |
|
choline-phosphate cytidylyltransferase A |
| 29164513 |
|
Pcyt1b |
|
0 |
361 |
3683 |
4273 |
5751 |
|
n.v. |
0.52 |
0.1 |
0.34 |
0.12 |
|
choline-phosphate cytidylyltransferase B isoform 2 |
| 46877071 |
|
Pcyt1b |
|
0 |
361 |
3683 |
4273 |
5751 |
|
n.v. |
0.52 |
0.1 |
0.34 |
0.12 |
|
choline-phosphate cytidylyltransferase B isoform 1 |
| 31980842 |
|
Pcyt2 |
|
0 |
0 |
0 |
0 |
16000 |
|
n.v. |
n.v. |
n.v. |
n.v. |
0.34 |
|
ethanolamine-phosphate cytidylyltransferase |
| 84781781 |
|
Pdap1 |
|
165 |
908 |
2103 |
115024 |
21 |
|
0.09 |
0.06 |
0.11 |
0.01 |
-0.11 |
|
28 kDa heat- and acid-stable phosphoprotein |
| 31560391 |
|
Pdcd10 |
|
2892 |
6348 |
14402 |
23976 |
51213 |
|
-0.01 |
0.08 |
-0.19 |
0.02 |
0.02 |
|
programmed cell death protein 10 |
| 54607128 |
|
Pdcd11 |
|
2929 |
0 |
0 |
0 |
0 |
|
-0.15 |
n.v. |
n.v. |
n.v. |
n.v. |
|
protein RRP5 homolog |
| 120407033 |
|
Pdcd2 |
|
0 |
0 |
293 |
0 |
1564 |
|
n.v. |
n.v. |
0.3 |
n.v. |
0.18 |
|
programmed cell death protein 2 |
| 110625656 |
|
Pdcd4 |
|
696 |
10283 |
19194 |
195889 |
6372 |
|
-0.06 |
0.03 |
-0.07 |
-0.13 |
0.16 |
|
programmed cell death protein 4 |
| 6755000 |
|
Pdcd6 |
|
293 |
2277 |
2275 |
20341 |
2056 |
|
0.25 |
0 |
-0.06 |
0 |
-0.24 |
|
programmed cell death protein 6 |
| 258547152 |
|
Pdcd6ip |
|
989 |
11126 |
24028 |
3774 |
96932 |
|
1.36 |
0.2 |
0.15 |
-0.23 |
0.11 |
|
programmed cell death 6-interacting protein isoform
1 |
| 258547154 |
|
Pdcd6ip |
|
989 |
11126 |
24028 |
3774 |
96557 |
|
1.36 |
0.2 |
0.15 |
-0.23 |
0.11 |
|
programmed cell death 6-interacting protein isoform
2 |
| 258547156 |
|
Pdcd6ip |
|
989 |
11126 |
24028 |
3774 |
96932 |
|
1.36 |
0.2 |
0.15 |
-0.23 |
0.11 |
|
programmed cell death 6-interacting protein isoform
3 |
| 165932326 |
|
Pdcl |
|
0 |
0 |
0 |
3291 |
0 |
|
n.v. |
n.v. |
n.v. |
0.07 |
n.v. |
|
phosducin-like protein |
| 31560120 |
|
Pdcl3 |
|
0 |
1305 |
836 |
25285 |
2270 |
|
n.v. |
0.4 |
1.15 |
0.24 |
-0.16 |
|
phosducin-like protein 3 |
| 157841170 |
|
Pddc1 |
|
0 |
1236 |
1280 |
3610 |
7454 |
|
n.v. |
0.04 |
-0.02 |
0.28 |
-0.04 |
|
Parkinson disease 7 domain-containing protein 1
precursor |
| 40538842 |
|
Pde12 |
|
0 |
822 |
0 |
655 |
3598 |
|
n.v. |
0.2 |
n.v. |
-0.59 |
-0.04 |
|
2',5'-phosphodiesterase 12 |
| 42475542 |
|
Pde4c |
|
0 |
0 |
0 |
237 |
1660 |
|
n.v. |
n.v. |
n.v. |
0.94 |
0.4 |
|
cAMP-specific 3',5'-cyclic phosphodiesterase 4C |
| 158749578 |
|
Pde4dip |
|
0 |
0 |
0 |
0 |
835 |
|
n.v. |
n.v. |
n.v. |
n.v. |
0.36 |
|
myomegalin isoform 1 |
| 158749580 |
|
Pde4dip |
|
0 |
0 |
0 |
0 |
835 |
|
n.v. |
n.v. |
n.v. |
n.v. |
0.36 |
|
myomegalin isoform 4 |
| 31542051 |
|
Pde4dip |
|
0 |
0 |
0 |
0 |
835 |
|
n.v. |
n.v. |
n.v. |
n.v. |
0.36 |
|
myomegalin isoform 2 |
| 6679245 |
|
Pde6d |
|
0 |
495 |
291 |
475 |
7754 |
|
n.v. |
0.43 |
0.12 |
0.48 |
0.07 |
|
retinal rod rhodopsin-sensitive cGMP 3',5'-cyclic
phosphodiesterase subunit delta |
| 170295853 |
|
Pde7a |
|
0 |
0 |
0 |
679 |
0 |
|
n.v. |
n.v. |
n.v. |
0.13 |
n.v. |
|
high affinity cAMP-specific 3',5'-cyclic
phosphodiesterase 7A isoform 1 precursor |
| 170295857 |
|
Pde7a |
|
0 |
0 |
0 |
679 |
0 |
|
n.v. |
n.v. |
n.v. |
0.13 |
n.v. |
|
high affinity cAMP-specific 3',5'-cyclic
phosphodiesterase 7A isoform 2 |
| 255003823 |
|
Pdf |
|
0 |
994 |
0 |
0 |
0 |
|
n.v. |
-0.27 |
n.v. |
n.v. |
n.v. |
|
peptide deformylase-like protein |
| 134032050 |
|
Pdgfra |
|
0 |
202 |
6785 |
36254 |
73039 |
|
n.v. |
0.05 |
-0.02 |
0.01 |
-0.01 |
|
platelet-derived growth factor receptor alpha precursor |
| 226342982 |
|
Pdgfrb |
|
0 |
202 |
6785 |
36254 |
73039 |
|
n.v. |
0.05 |
-0.02 |
0.01 |
-0.01 |
|
platelet-derived growth factor receptor beta isoform 1
precursor |
| 226371752 |
|
Pdgfrb |
|
0 |
202 |
6785 |
36254 |
73039 |
|
n.v. |
0.05 |
-0.02 |
0.01 |
-0.01 |
|
platelet-derived growth factor receptor beta isoform 2
precursor |
| 6679261 |
|
Pdha1 |
|
63980 |
17921 |
407 |
319 |
0 |
|
-0.27 |
-0.11 |
-0.42 |
-0.17 |
n.v. |
|
pyruvate dehydrogenase E1 component subunit alpha,
somatic form, mitochondrial precursor |
| 6679263 |
|
Pdha2 |
|
366 |
3127 |
0 |
0 |
0 |
|
-0.37 |
-0.25 |
n.v. |
n.v. |
n.v. |
|
pyruvate dehydrogenase E1 component subunit alpha,
testis-specific form, mitochondrial precursor |
| 18152793 |
|
Pdhb |
|
67018 |
32237 |
395 |
4584 |
236 |
|
-0.24 |
-0.07 |
-0.23 |
-0.14 |
-0.26 |
|
pyruvate dehydrogenase E1 component subunit beta,
mitochondrial precursor |
| 28201978 |
|
Pdhx |
|
3460 |
5624 |
0 |
0 |
0 |
|
-0.02 |
-0.03 |
n.v. |
n.v. |
n.v. |
|
pyruvate dehydrogenase protein X component, mitochondrial |
| 112293264 |
|
Pdia3 |
|
1166459 |
46938 |
148274 |
671 |
337596 |
|
0.03 |
-0.25 |
-0.25 |
-0.24 |
-0.38 |
|
protein disulfide-isomerase A3 precursor |
| 86198316 |
|
Pdia4 |
|
145130 |
37162 |
38250 |
0 |
36037 |
|
-0.04 |
-0.23 |
-0.27 |
n.v. |
-0.47 |
|
protein disulfide-isomerase A4 precursor |
| 30794140 |
|
Pdia5 |
|
0 |
27 |
120 |
0 |
0 |
|
n.v. |
-0.27 |
-0.21 |
n.v. |
n.v. |
|
protein disulfide-isomerase A5 precursor |
| 377833208 |
|
Pdia6 |
|
207718 |
32580 |
14807 |
2685 |
37526 |
|
0.01 |
-0.25 |
-0.29 |
0 |
-0.39 |
|
PREDICTED: protein disulfide-isomerase A6 |
| 58037267 |
|
Pdia6 |
|
436397 |
56484 |
36533 |
4117 |
61655 |
|
0.02 |
-0.23 |
-0.28 |
-0.4 |
-0.37 |
|
protein disulfide-isomerase A6 precursor |
| 110625975 |
|
Pdk1 |
|
30717 |
12270 |
260 |
0 |
0 |
|
-0.09 |
-0.24 |
-0.49 |
n.v. |
n.v. |
|
pyruvate dehydrogenase kinase, isozyme 1 precursor |
| 226958643 |
|
Pdk2 |
|
0 |
92 |
0 |
0 |
0 |
|
n.v. |
-0.13 |
n.v. |
n.v. |
n.v. |
|
pyruvate dehydrogenase kinase, isoenzyme 2 |
| 21704122 |
|
Pdk3 |
|
3167 |
7586 |
0 |
0 |
0 |
|
0.19 |
-0.15 |
n.v. |
n.v. |
n.v. |
|
pyruvate dehydrogenase kinase, isozyme 3 |
| 158635992 |
|
Pdlim1 |
|
0 |
6 |
511 |
0 |
107513 |
|
n.v. |
0.72 |
0.45 |
n.v. |
0.13 |
|
PDZ and LIM domain protein 1 |
| 22122423 |
|
Pdlim2 |
|
0 |
0 |
0 |
0 |
3545 |
|
n.v. |
n.v. |
n.v. |
n.v. |
0.14 |
|
PDZ and LIM domain protein 2 |
| 170650625 |
|
Pdlim5 |
|
0 |
2486 |
1408 |
0 |
14040 |
|
n.v. |
0.19 |
0.06 |
n.v. |
0.14 |
|
PDZ and LIM domain protein 5 isoform ENH3b |
| 170650627 |
|
Pdlim5 |
|
0 |
3964 |
2602 |
0 |
30447 |
|
n.v. |
0.23 |
0.07 |
n.v. |
0.2 |
|
PDZ and LIM domain protein 5 isoform ENH2 |
| 300069034 |
|
Pdlim5 |
|
0 |
2463 |
1408 |
0 |
14040 |
|
n.v. |
0.02 |
0.06 |
n.v. |
0.14 |
|
PDZ and LIM domain protein 5 isoform ENH4 |
| 300069043 |
|
Pdlim5 |
|
0 |
2486 |
1408 |
0 |
14040 |
|
n.v. |
0.19 |
0.06 |
n.v. |
0.14 |
|
PDZ and LIM domain protein 5 isoform ENH3a |
| 170650623 |
|
Pdlim5 |
|
1776 |
11043 |
9269 |
0 |
81949 |
|
-0.47 |
0.3 |
0.11 |
n.v. |
0.21 |
|
PDZ and LIM domain protein 5 isoform ENH1 |
| 300069024 |
|
Pdlim5 |
|
1776 |
9281 |
8075 |
0 |
65531 |
|
-0.47 |
0.3 |
0.11 |
n.v. |
0.21 |
|
PDZ and LIM domain protein 5 isoform ENH1e |
| 300069036 |
|
Pdlim5 |
|
1776 |
9565 |
8075 |
0 |
65531 |
|
-0.47 |
0.31 |
0.11 |
n.v. |
0.21 |
|
PDZ and LIM domain protein 5 isoform ENH1b |
| 300069038 |
|
Pdlim5 |
|
1776 |
9281 |
8075 |
0 |
65531 |
|
-0.47 |
0.3 |
0.11 |
n.v. |
0.21 |
|
PDZ and LIM domain protein 5 isoform ENH1c |
| 300069041 |
|
Pdlim5 |
|
1776 |
9281 |
8075 |
0 |
65531 |
|
-0.47 |
0.3 |
0.11 |
n.v. |
0.21 |
|
PDZ and LIM domain protein 5 isoform ENH1d |
| 166197677 |
|
Pdlim7 |
|
0 |
0 |
205 |
0 |
0 |
|
n.v. |
n.v. |
0.13 |
n.v. |
n.v. |
|
PDZ and LIM domain protein 7 isoform c |
| 166197679 |
|
Pdlim7 |
|
0 |
0 |
205 |
0 |
0 |
|
n.v. |
n.v. |
0.13 |
n.v. |
n.v. |
|
PDZ and LIM domain protein 7 isoform b |
| 166197681 |
|
Pdlim7 |
|
0 |
1666 |
1299 |
1547 |
621 |
|
n.v. |
0.38 |
0.13 |
0.48 |
-0.03 |
|
PDZ and LIM domain protein 7 isoform a |
| 148277602 |
|
Pdp1 |
|
0 |
440 |
0 |
0 |
0 |
|
n.v. |
-0.3 |
n.v. |
n.v. |
n.v. |
|
[Pyruvate dehydrogenase
[acetyl-transferring]]-phosphatase 1, mitochondrial isoform b |
| 148277650 |
|
Pdp1 |
|
0 |
440 |
0 |
0 |
0 |
|
n.v. |
-0.3 |
n.v. |
n.v. |
n.v. |
|
[Pyruvate dehydrogenase
[acetyl-transferring]]-phosphatase 1, mitochondrial isoform a |
| 84794625 |
|
Pdp1 |
|
0 |
440 |
0 |
0 |
0 |
|
n.v. |
-0.3 |
n.v. |
n.v. |
n.v. |
|
[Pyruvate dehydrogenase
[acetyl-transferring]]-phosphatase 1, mitochondrial isoform c |
| 124107594 |
|
Pdpk1 |
|
0 |
0 |
0 |
0 |
3234 |
|
n.v. |
n.v. |
n.v. |
n.v. |
0.08 |
|
3-phosphoinositide-dependent protein kinase 1 isoform A |
| 124107598 |
|
Pdpk1 |
|
0 |
0 |
0 |
0 |
3234 |
|
n.v. |
n.v. |
n.v. |
n.v. |
0.08 |
|
3-phosphoinositide-dependent protein kinase 1 isoform B |
| 38142488 |
|
Pdpr |
|
0 |
827 |
0 |
0 |
0 |
|
n.v. |
0.12 |
n.v. |
n.v. |
n.v. |
|
pyruvate dehydrogenase phosphatase regulatory subunit,
mitochondrial precursor |
| 32490570 |
|
Pdrg1 |
|
0 |
42 |
117 |
802 |
0 |
|
n.v. |
-0.47 |
0.03 |
0.26 |
n.v. |
|
p53 and DNA damage-regulated protein 1 |
| 124486765 |
|
Pds5a |
|
9519 |
31 |
1747 |
393 |
75 |
|
-0.32 |
-0.15 |
-0.14 |
-0.13 |
-0.01 |
|
sister chromatid cohesion protein PDS5 homolog A |
| 66955886 |
|
Pds5b |
|
4357 |
211 |
2957 |
98 |
0 |
|
-0.09 |
-0.56 |
0 |
0.34 |
n.v. |
|
sister chromatid cohesion protein PDS5 homolog B |
| 88758582 |
|
Pdxdc1 |
|
1867 |
8183 |
2359 |
15945 |
96032 |
|
-1.22 |
-0.04 |
-0.04 |
-0.07 |
-0.08 |
|
pyridoxal-dependent decarboxylase domain-containing
protein 1 isoform 1 |
| 88758584 |
|
Pdxdc1 |
|
1867 |
8183 |
2359 |
15945 |
85141 |
|
-1.22 |
-0.04 |
-0.04 |
-0.07 |
-0.06 |
|
pyridoxal-dependent decarboxylase domain-containing
protein 1 isoform 3 |
| 26006861 |
|
Pdxk |
|
0 |
2968 |
3644 |
1498 |
107920 |
|
n.v. |
-0.41 |
-0.18 |
-0.42 |
0.11 |
|
pyridoxal kinase |
| 21312244 |
|
Pdzd11 |
|
0 |
0 |
105 |
319 |
0 |
|
n.v. |
n.v. |
-1.12 |
-0.65 |
n.v. |
|
PDZ domain-containing protein 11 |
| 305682586 |
|
Pdzd7 |
|
3661 |
0 |
2919 |
5984 |
0 |
|
0.14 |
n.v. |
0.04 |
0 |
n.v. |
|
PDZ domain-containing protein 7 |
| 164698472 |
|
Pdzd8 |
|
0 |
29 |
246 |
0 |
0 |
|
n.v. |
-0.16 |
-0.4 |
n.v. |
n.v. |
|
PDZ domain containing 8 |
| 13385522 |
|
Pdzk1ip1 |
|
2050 |
1616 |
1263 |
1793 |
0 |
|
-0.62 |
-0.91 |
0.11 |
-0.88 |
n.v. |
|
PDZK1-interacting protein 1 isoform 2 precursor |
| 257095992 |
|
Pdzk1ip1 |
|
2050 |
1616 |
1263 |
1793 |
0 |
|
-0.62 |
-0.91 |
0.11 |
-0.88 |
n.v. |
|
PDZK1-interacting protein 1 isoform 1 |
| 21426847 |
|
Pea15a |
|
3551 |
570 |
4748 |
0 |
15250 |
|
0.14 |
0.21 |
0.16 |
n.v. |
0.2 |
|
astrocytic phosphoprotein PEA-15 isoform 2 |
| 84794552 |
|
Pebp1 |
|
15450 |
7373 |
20863 |
1203 |
403823 |
|
0.11 |
0.18 |
0.01 |
0.26 |
-0.04 |
|
phosphatidylethanolamine-binding protein 1 |
| 227908837 |
|
Pecr |
|
0 |
2380 |
320 |
0 |
0 |
|
n.v. |
-0.24 |
-0.47 |
n.v. |
n.v. |
|
peroxisomal trans-2-enoyl-CoA reductase |
| 31980937 |
|
Pef1 |
|
0 |
820 |
438 |
254 |
1863 |
|
n.v. |
-0.23 |
-0.05 |
0.22 |
-0.17 |
|
peflin |
| 164698448 |
|
Pelo |
|
0 |
0 |
6512 |
5362 |
1028 |
|
n.v. |
n.v. |
0.05 |
0.06 |
0.23 |
|
protein pelota homolog |
| 257900472 |
|
Pelp1 |
|
0 |
0 |
1945 |
106 |
0 |
|
n.v. |
n.v. |
-0.2 |
-0.38 |
n.v. |
|
proline-, glutamic acid- and leucine-rich protein 1 |
| 170650724 |
|
Pepd |
|
1959 |
5309 |
2217 |
3544 |
43149 |
|
0.66 |
0.09 |
-0.09 |
0.28 |
0.13 |
|
xaa-Pro dipeptidase |
| 12584984 |
|
Pes1 |
|
0 |
0 |
51 |
11746 |
64 |
|
n.v. |
n.v. |
-0.19 |
-0.07 |
-0.13 |
|
pescadillo homolog |
| 21450279 |
|
Pet112 |
|
0 |
73 |
0 |
0 |
0 |
|
n.v. |
-0.11 |
n.v. |
n.v. |
n.v. |
|
glutamyl-tRNA(Gln) amidotransferase subunit B,
mitochondrial precursor |
| 258679439 |
|
Pet117 |
|
0 |
875 |
0 |
0 |
0 |
|
n.v. |
-0.07 |
n.v. |
n.v. |
n.v. |
|
protein PET117 homolog, mitochondrial precursor |
| 61657895 |
|
Pex1 |
|
0 |
386 |
256 |
0 |
0 |
|
n.v. |
-0.05 |
-0.17 |
n.v. |
n.v. |
|
peroxisome biogenesis factor 1 |
| 109150414 |
|
Pex10 |
|
0 |
754 |
0 |
3618 |
0 |
|
n.v. |
-0.05 |
n.v. |
0.28 |
n.v. |
|
peroxisome biogenesis factor 10 |
| 241666481 |
|
Pex11b |
|
9904 |
7273 |
5534 |
0 |
0 |
|
-0.02 |
-0.15 |
-0.17 |
n.v. |
n.v. |
|
peroxisomal membrane protein 11B isoform 1 |
| 241666485 |
|
Pex11b |
|
9904 |
7273 |
5534 |
0 |
0 |
|
-0.02 |
-0.15 |
-0.17 |
n.v. |
n.v. |
|
peroxisomal membrane protein 11B isoform 2 |
| 21735445 |
|
Pex11g |
|
0 |
286 |
837 |
0 |
0 |
|
n.v. |
0.07 |
-0.24 |
n.v. |
n.v. |
|
peroxisomal membrane protein 11C |
| 9790153 |
|
Pex14 |
|
0 |
261 |
2789 |
0 |
0 |
|
n.v. |
-0.68 |
-0.3 |
n.v. |
n.v. |
|
peroxisomal membrane protein PEX14 |
| 254750742 |
|
Pex16 |
|
0 |
4386 |
3083 |
0 |
0 |
|
n.v. |
-0.11 |
-0.23 |
n.v. |
n.v. |
|
peroxisomal biogenesis factor 16 |
| 226958492 |
|
Pex19 |
|
0 |
0 |
413 |
0 |
27684 |
|
n.v. |
n.v. |
0.04 |
n.v. |
0.13 |
|
peroxisomal biogenesis factor 19 isoform b |
| 226958490 |
|
Pex19 |
|
0 |
1044 |
1576 |
0 |
44744 |
|
n.v. |
-0.05 |
0.07 |
n.v. |
0.13 |
|
peroxisomal biogenesis factor 19 isoform a |
| 255958309 |
|
Pex3 |
|
0 |
317 |
806 |
0 |
0 |
|
n.v. |
0.06 |
-0.35 |
n.v. |
n.v. |
|
peroxisomal biogenesis factor 3 isoform 2 |
| 9910484 |
|
Pex3 |
|
0 |
317 |
806 |
0 |
0 |
|
n.v. |
0.06 |
-0.35 |
n.v. |
n.v. |
|
peroxisomal biogenesis factor 3 isoform 1 |
| 21703962 |
|
Pex6 |
|
0 |
88 |
0 |
278 |
0 |
|
n.v. |
0.05 |
n.v. |
-0.9 |
n.v. |
|
peroxisome assembly factor 2 |
| 240120097 |
|
Pex7 |
|
0 |
0 |
0 |
0 |
2153 |
|
n.v. |
n.v. |
n.v. |
n.v. |
-0.2 |
|
peroxisomal biogenesis factor 7 isoform 2 |
| 6679283 |
|
Pex7 |
|
0 |
0 |
0 |
0 |
2153 |
|
n.v. |
n.v. |
n.v. |
n.v. |
-0.2 |
|
peroxisomal biogenesis factor 7 isoform 1 |
| 226958458 |
|
Pfas |
|
494 |
1474 |
4242 |
18729 |
130078 |
|
-0.63 |
0.43 |
0.03 |
0.21 |
0.09 |
|
phosphoribosylformylglycinamidine synthase |
| 13385532 |
|
Pfdn1 |
|
0 |
194 |
1178 |
4535 |
17146 |
|
n.v. |
0.17 |
0.23 |
-0.42 |
-0.09 |
|
prefoldin subunit 1 |
| 31981577 |
|
Pfdn2 |
|
0 |
1232 |
4015 |
8538 |
15432 |
|
n.v. |
0.3 |
0.12 |
0.07 |
-0.01 |
|
prefoldin subunit 2 |
| 158711747 |
|
Pfdn4 |
|
0 |
0 |
382 |
254 |
2120 |
|
n.v. |
n.v. |
0.13 |
-0.62 |
0.27 |
|
prefoldin 4 isoform 1 |
| 315507139 |
|
Pfdn4 |
|
0 |
0 |
382 |
254 |
2120 |
|
n.v. |
n.v. |
0.13 |
-0.62 |
0.27 |
|
prefoldin 4 isoform 3 |
| 61656178 |
|
Pfdn4 |
|
0 |
0 |
356 |
254 |
514 |
|
n.v. |
n.v. |
0.13 |
-0.62 |
-0.3 |
|
prefoldin 4 isoform 2 |
| 55741463 |
|
Pfdn5 |
|
0 |
296 |
1018 |
1130 |
13001 |
|
n.v. |
0.43 |
0.2 |
0.34 |
0.01 |
|
prefoldin subunit 5 |
| 295293207 |
|
Pfkfb3 |
|
0 |
0 |
0 |
0 |
1403 |
|
n.v. |
n.v. |
n.v. |
n.v. |
0.36 |
|
6-phosphofructo-2-kinase/fructose-2,6-biphosphatase 3
isoform 1 |
| 295293209 |
|
Pfkfb3 |
|
0 |
0 |
0 |
0 |
1403 |
|
n.v. |
n.v. |
n.v. |
n.v. |
0.36 |
|
6-phosphofructo-2-kinase/fructose-2,6-biphosphatase 3
isoform 2 |
| 295293211 |
|
Pfkfb3 |
|
0 |
0 |
0 |
0 |
1403 |
|
n.v. |
n.v. |
n.v. |
n.v. |
0.36 |
|
6-phosphofructo-2-kinase/fructose-2,6-biphosphatase 3
isoform 4 |
| 295293213 |
|
Pfkfb3 |
|
0 |
0 |
0 |
0 |
1403 |
|
n.v. |
n.v. |
n.v. |
n.v. |
0.36 |
|
6-phosphofructo-2-kinase/fructose-2,6-biphosphatase 3
isoform 3 |
| 295293215 |
|
Pfkfb3 |
|
0 |
0 |
0 |
0 |
1403 |
|
n.v. |
n.v. |
n.v. |
n.v. |
0.36 |
|
6-phosphofructo-2-kinase/fructose-2,6-biphosphatase 3
isoform 5 |
| 295293217 |
|
Pfkfb3 |
|
0 |
0 |
0 |
0 |
1403 |
|
n.v. |
n.v. |
n.v. |
n.v. |
0.36 |
|
6-phosphofructo-2-kinase/fructose-2,6-biphosphatase 3
isoform 7 |
| 295293220 |
|
Pfkfb3 |
|
0 |
0 |
0 |
0 |
1403 |
|
n.v. |
n.v. |
n.v. |
n.v. |
0.36 |
|
6-phosphofructo-2-kinase/fructose-2,6-biphosphatase 3
isoform 8 |
| 87298847 |
|
Pfkfb3 |
|
0 |
0 |
0 |
0 |
1403 |
|
n.v. |
n.v. |
n.v. |
n.v. |
0.36 |
|
6-phosphofructo-2-kinase/fructose-2,6-biphosphatase 3
isoform 6 |
| 31560653 |
|
Pfkl |
|
76812 |
28511 |
65527 |
811058 |
173141 |
|
0.11 |
0.03 |
-0.06 |
-0.01 |
0.06 |
|
6-phosphofructokinase, liver type |
| 254553348;254553344 |
|
Pfkm |
|
5565 |
7277 |
21280 |
117225 |
53505 |
|
0.23 |
0.15 |
-0.09 |
0.09 |
-0.02 |
|
6-phosphofructokinase, muscle type |
| 9790051 |
|
Pfkp |
|
805 |
10726 |
21405 |
306443 |
56075 |
|
0.4 |
-0.05 |
-0.02 |
0.07 |
-0.07 |
|
6-phosphofructokinase type C |
| 6755040 |
|
Pfn1 |
|
114559 |
38694 |
47135 |
123537 |
540926 |
|
0.03 |
-0.04 |
-0.01 |
0.01 |
0.06 |
|
profilin-1 |
| 9506971 |
|
Pfn2 |
|
403 |
309 |
906 |
2055 |
10185 |
|
0.21 |
0.16 |
0.04 |
0.3 |
0.11 |
|
profilin-2 |
| 114326546 |
|
Pgam1 |
|
356638 |
56770 |
93328 |
50276 |
1449435 |
|
0.08 |
0.14 |
0.02 |
0.17 |
0.09 |
|
phosphoglycerate mutase 1 |
| 9256624 |
|
Pgam2 |
|
40035 |
17594 |
24972 |
9397 |
661419 |
|
0.12 |
0.11 |
0.04 |
0.09 |
0.06 |
|
phosphoglycerate mutase 2 |
| 254587960 |
|
Pgam5 |
|
30772 |
6699 |
383 |
0 |
0 |
|
-0.02 |
-0.11 |
-0.6 |
n.v. |
n.v. |
|
serine/threonine-protein phosphatase PGAM5, mitochondrial
isoform 2 |
| 254587962 |
|
Pgam5 |
|
30772 |
6699 |
383 |
0 |
0 |
|
-0.02 |
-0.11 |
-0.6 |
n.v. |
n.v. |
|
serine/threonine-protein phosphatase PGAM5, mitochondrial
isoform 1 |
| 254028203 |
|
Pgap1 |
|
22169 |
4127 |
7018 |
0 |
0 |
|
0.13 |
-0.14 |
-0.28 |
n.v. |
n.v. |
|
GPI inositol-deacylase |
| 114326508 |
|
Pgap3 |
|
0 |
61 |
0 |
0 |
0 |
|
n.v. |
0.06 |
n.v. |
n.v. |
n.v. |
|
post-GPI attachment to proteins factor 3 precursor |
| 124486895 |
|
Pgd |
|
4595 |
17036 |
47845 |
66483 |
619384 |
|
0.46 |
0.03 |
0.02 |
0.14 |
0.02 |
|
6-phosphogluconate dehydrogenase, decarboxylating |
| 27369904 |
|
Pggt1b |
|
0 |
0 |
0 |
0 |
5815 |
|
n.v. |
n.v. |
n.v. |
n.v. |
0.03 |
|
geranylgeranyl transferase type-1 subunit beta |
| 70778976 |
|
Pgk1 |
|
279734 |
115963 |
233051 |
314440 |
3467716 |
|
0.24 |
0.18 |
-0.01 |
0.13 |
0.05 |
|
phosphoglycerate kinase 1 |
| 226246531 |
|
Pgk2 |
|
68410 |
18911 |
88730 |
95476 |
866677 |
|
0.1 |
0.21 |
-0.01 |
0.08 |
0.06 |
|
phosphoglycerate kinase 2 |
| 13384778 |
|
Pgls |
|
1940 |
6951 |
3367 |
655 |
112407 |
|
0.2 |
0.07 |
0.06 |
0.12 |
0.27 |
|
6-phosphogluconolactonase |
| 33859686 |
|
Pgm1 |
|
0 |
3188 |
736 |
0 |
46276 |
|
n.v. |
0.19 |
0.29 |
n.v. |
0.1 |
|
phosphoglucomutase-1 |
| 227330633 |
|
Pgm2 |
|
0 |
6419 |
41356 |
24647 |
270158 |
|
n.v. |
0.1 |
0 |
0.16 |
0.08 |
|
phosphoglucomutase-2 |
| 28076969 |
|
Pgm2l1 |
|
0 |
0 |
0 |
0 |
7004 |
|
n.v. |
n.v. |
n.v. |
n.v. |
0.16 |
|
glucose 1,6-bisphosphate synthase |
| 255522939 |
|
Pgm3 |
|
0 |
0 |
101 |
25 |
9542 |
|
n.v. |
n.v. |
0.03 |
0.1 |
-0.04 |
|
phosphoacetylglucosamine mutase isoform 1 |
| 255522941 |
|
Pgm3 |
|
0 |
0 |
101 |
25 |
9542 |
|
n.v. |
n.v. |
0.03 |
0.1 |
-0.04 |
|
phosphoacetylglucosamine mutase isoform 2 |
| 40254507 |
|
Pgp |
|
0 |
4561 |
2227 |
548 |
187459 |
|
n.v. |
0.12 |
0.13 |
-0.03 |
0.06 |
|
phosphoglycolate phosphatase |
| 31980806 |
|
Pgrmc1 |
|
21583 |
2881 |
2927 |
589 |
0 |
|
-0.06 |
-0.11 |
-0.36 |
-0.32 |
n.v. |
|
membrane-associated progesterone receptor component
1 |
| 226442772 |
|
Pgrmc2 |
|
34781 |
6966 |
4440 |
434 |
0 |
|
0.01 |
-0.21 |
-0.45 |
-0.03 |
n.v. |
|
membrane-associated progesterone receptor component
2 |
| 110626163 |
|
Pgs1 |
|
0 |
549 |
12 |
0 |
0 |
|
n.v. |
-0.68 |
0 |
n.v. |
n.v. |
|
CDP-diacylglycerol--glycerol-3-phosphate
3-phosphatidyltransferase, mitochondrial |
| 54144633 |
|
Phactr1 |
|
0 |
0 |
0 |
0 |
225 |
|
n.v. |
n.v. |
n.v. |
n.v. |
0.48 |
|
phosphatase and actin regulator 1 isoform 1 |
| 54144635 |
|
Phactr1 |
|
0 |
0 |
0 |
0 |
225 |
|
n.v. |
n.v. |
n.v. |
n.v. |
0.48 |
|
phosphatase and actin regulator 1 isoform 2 |
| 54144637 |
|
Phactr1 |
|
0 |
0 |
0 |
0 |
225 |
|
n.v. |
n.v. |
n.v. |
n.v. |
0.48 |
|
phosphatase and actin regulator 1 isoform 3 |
| 304361725 |
|
Phactr2 |
|
0 |
0 |
0 |
5992 |
1424 |
|
n.v. |
n.v. |
n.v. |
0.27 |
0.19 |
|
phosphatase and actin regulator 2 isoform A |
| 304361727 |
|
Phactr2 |
|
0 |
0 |
0 |
5992 |
1424 |
|
n.v. |
n.v. |
n.v. |
0.27 |
0.19 |
|
phosphatase and actin regulator 2 isoform B |
| 304361740 |
|
Phactr2 |
|
0 |
0 |
0 |
5992 |
1424 |
|
n.v. |
n.v. |
n.v. |
0.27 |
0.19 |
|
phosphatase and actin regulator 2 isoform C |
| 84781783 |
|
Phactr2 |
|
0 |
0 |
0 |
5992 |
1424 |
|
n.v. |
n.v. |
n.v. |
0.27 |
0.19 |
|
phosphatase and actin regulator 2 isoform D |
| 239985486 |
|
Phactr4 |
|
0 |
44 |
170 |
2529 |
632 |
|
n.v. |
0.2 |
-0.01 |
0.41 |
-0.07 |
|
phosphatase and actin regulator 4 isoform 1 |
| 239985488 |
|
Phactr4 |
|
0 |
44 |
170 |
2529 |
632 |
|
n.v. |
0.2 |
-0.01 |
0.41 |
-0.07 |
|
phosphatase and actin regulator 4 isoform 2 |
| 253314458 |
|
Phax |
|
0 |
15 |
92 |
1187 |
7539 |
|
n.v. |
0.45 |
0.36 |
0.21 |
0.13 |
|
phosphorylated adapter RNA export protein isoform 1 |
| 253314461 |
|
Phax |
|
0 |
15 |
92 |
1187 |
7539 |
|
n.v. |
0.45 |
0.36 |
0.21 |
0.13 |
|
phosphorylated adapter RNA export protein isoform 2 |
| 6679299 |
|
Phb |
|
426384 |
103916 |
17629 |
982 |
0 |
|
-0.01 |
-0.12 |
-0.33 |
-0.23 |
n.v. |
|
prohibitin |
| 126723336 |
|
Phb2 |
|
946750 |
124831 |
18208 |
1465 |
0 |
|
-0.05 |
-0.12 |
-0.35 |
-0.22 |
n.v. |
|
prohibitin-2 |
| 270288742 |
|
Phf14 |
|
1281 |
0 |
0 |
0 |
0 |
|
0.1 |
n.v. |
n.v. |
n.v. |
n.v. |
|
PHD finger protein 14 isoform 1 |
| 270288744 |
|
Phf14 |
|
1281 |
0 |
0 |
0 |
0 |
|
0.1 |
n.v. |
n.v. |
n.v. |
n.v. |
|
PHD finger protein 14 isoform 2 |
| 24415990 |
|
Phf5a |
|
11990 |
474 |
935 |
3618 |
3534 |
|
-0.03 |
-0.05 |
-0.02 |
-0.05 |
0.1 |
|
PHD finger-like domain-containing protein 5A |
| 33563292 |
|
Phf6 |
|
0 |
0 |
344 |
1130 |
0 |
|
n.v. |
n.v. |
0.01 |
0.08 |
n.v. |
|
PHD finger protein 6 |
| 164518891 |
|
Phf8 |
|
0 |
0 |
18 |
0 |
0 |
|
n.v. |
n.v. |
0.01 |
n.v. |
n.v. |
|
histone lysine demethylase PHF8 isoform b |
| 52353955 |
|
Phgdh |
|
51843 |
64417 |
153369 |
280830 |
601135 |
|
-0.27 |
0.15 |
0.05 |
0.17 |
0.07 |
|
D-3-phosphoglycerate dehydrogenase |
| 40789096 |
|
Phkb |
|
0 |
0 |
0 |
786 |
268 |
|
n.v. |
n.v. |
n.v. |
-0.61 |
-1.05 |
|
phosphorylase b kinase regulatory subunit beta |
| 226442929 |
|
Phlda1 |
|
0 |
0 |
56 |
0 |
0 |
|
n.v. |
n.v. |
-0.15 |
n.v. |
n.v. |
|
pleckstrin homology-like domain family A member 1 |
| 7305377 |
|
Phlda3 |
|
0 |
0 |
13 |
0 |
0 |
|
n.v. |
n.v. |
0.03 |
n.v. |
n.v. |
|
pleckstrin homology-like domain family A member 3 |
| 188528897 |
|
Phldb2 |
|
0 |
65 |
1831 |
0 |
0 |
|
n.v. |
0.91 |
0.17 |
n.v. |
n.v. |
|
pleckstrin homology-like domain family B member 2 isoform
2 |
| 356995938 |
|
Phldb2 |
|
0 |
65 |
1831 |
0 |
0 |
|
n.v. |
0.91 |
0.17 |
n.v. |
n.v. |
|
pleckstrin homology-like domain family B member 2 isoform
1 |
| 156616318 |
|
Phldb3 |
|
0 |
0 |
0 |
0 |
1735 |
|
n.v. |
n.v. |
n.v. |
n.v. |
-0.53 |
|
pleckstrin homology-like domain family B member 3 |
| 21312114 |
|
Phospho2 |
|
0 |
0 |
0 |
0 |
461 |
|
n.v. |
n.v. |
n.v. |
n.v. |
-0.29 |
|
pyridoxal phosphate phosphatase PHOSPHO2 |
| 58037409 |
|
Phpt1 |
|
897 |
635 |
2049 |
0 |
14715 |
|
-0.07 |
0 |
0.03 |
n.v. |
0.16 |
|
14 kDa phosphohistidine phosphatase |
| 26986561 |
|
Phyhd1 |
|
0 |
0 |
0 |
0 |
375 |
|
n.v. |
n.v. |
n.v. |
n.v. |
0.41 |
|
phytanoyl-CoA dioxygenase domain-containing protein 1
isoform 1 |
| 357540869 |
|
Phyhd1 |
|
0 |
0 |
0 |
0 |
375 |
|
n.v. |
n.v. |
n.v. |
n.v. |
0.41 |
|
phytanoyl-CoA dioxygenase domain-containing protein 1
isoform 3 |
| 357588425 |
|
Phyhd1 |
|
0 |
0 |
0 |
0 |
375 |
|
n.v. |
n.v. |
n.v. |
n.v. |
0.41 |
|
phytanoyl-CoA dioxygenase domain-containing protein 1
isoform 2 |
| 357588429 |
|
Phyhd1 |
|
0 |
0 |
0 |
0 |
375 |
|
n.v. |
n.v. |
n.v. |
n.v. |
0.41 |
|
phytanoyl-CoA dioxygenase domain-containing protein 1
isoform 4 |
| 28077015 |
|
Phykpl |
|
0 |
0 |
0 |
0 |
1060 |
|
n.v. |
n.v. |
n.v. |
n.v. |
0.32 |
|
5-phosphohydroxy-L-lysine phospho-lyase |
| 21703986 |
|
Pi4k2a |
|
0 |
7722 |
6248 |
123 |
0 |
|
n.v. |
-0.1 |
-0.04 |
-0.03 |
n.v. |
|
phosphatidylinositol 4-kinase type 2-alpha |
| 145966816 |
|
Pi4k2b |
|
0 |
0 |
15 |
0 |
0 |
|
n.v. |
n.v. |
0.5 |
n.v. |
n.v. |
|
phosphatidylinositol 4-kinase type 2-beta isoform 2 |
| 145966899 |
|
Pi4k2b |
|
0 |
0 |
15 |
0 |
0 |
|
n.v. |
n.v. |
0.5 |
n.v. |
n.v. |
|
phosphatidylinositol 4-kinase type 2-beta isoform 1 |
| 241982771 |
|
Pi4ka |
|
37 |
1111 |
702 |
704 |
0 |
|
1.29 |
-1.1 |
-0.1 |
-0.44 |
n.v. |
|
phosphatidylinositol 4-kinase type 3 alpha |
| 256000773 |
|
Pi4kb |
|
0 |
0 |
0 |
0 |
1585 |
|
n.v. |
n.v. |
n.v. |
n.v. |
0.16 |
|
phosphatidylinositol 4-kinase beta |
| 32567788 |
|
Picalm |
|
0 |
221 |
1759 |
0 |
2849 |
|
n.v. |
0.6 |
0.06 |
n.v. |
-0.55 |
|
phosphatidylinositol-binding clathrin assembly protein
isoform 1 |
| 357394959 |
|
Picalm |
|
0 |
476 |
1759 |
0 |
2849 |
|
n.v. |
0.44 |
0.06 |
n.v. |
-0.55 |
|
phosphatidylinositol-binding clathrin assembly protein
isoform 2 |
| 357394963 |
|
Picalm |
|
0 |
221 |
1759 |
0 |
2849 |
|
n.v. |
0.6 |
0.06 |
n.v. |
-0.55 |
|
phosphatidylinositol-binding clathrin assembly protein
isoform 3 |
| 357394966 |
|
Picalm |
|
0 |
221 |
1759 |
0 |
2849 |
|
n.v. |
0.6 |
0.06 |
n.v. |
-0.55 |
|
phosphatidylinositol-binding clathrin assembly protein
isoform 4 |
| 357394968 |
|
Picalm |
|
0 |
476 |
1759 |
0 |
2849 |
|
n.v. |
0.44 |
0.06 |
n.v. |
-0.55 |
|
phosphatidylinositol-binding clathrin assembly protein
isoform 5 |
| 357394970 |
|
Picalm |
|
0 |
476 |
1759 |
0 |
2849 |
|
n.v. |
0.44 |
0.06 |
n.v. |
-0.55 |
|
phosphatidylinositol-binding clathrin assembly protein
isoform 6 |
| 257153376 |
|
Piezo1 |
|
0 |
2 |
0 |
0 |
0 |
|
n.v. |
0.38 |
n.v. |
n.v. |
n.v. |
|
piezo-type mechanosensitive ion channel component 1 |
| 124486987 |
|
Pigg |
|
0 |
35 |
0 |
0 |
0 |
|
n.v. |
0.58 |
n.v. |
n.v. |
n.v. |
|
GPI ethanolamine phosphate transferase 2 |
| 41872422 |
|
Pigh |
|
0 |
447 |
22 |
0 |
0 |
|
n.v. |
-0.38 |
-0.49 |
n.v. |
n.v. |
|
phosphatidylinositol N-acetylglucosaminyltransferase
subunit H |
| 29788753 |
|
Pigk |
|
3204 |
280 |
587 |
0 |
0 |
|
-0.06 |
-0.4 |
-0.49 |
n.v. |
n.v. |
|
GPI-anchor transamidase isoform 1 precursor |
| 29789447 |
|
Pigk |
|
3204 |
280 |
587 |
0 |
0 |
|
-0.06 |
-0.4 |
-0.49 |
n.v. |
n.v. |
|
GPI-anchor transamidase isoform 2 precursor |
| 19920329 |
|
Pigm |
|
0 |
0 |
31 |
0 |
0 |
|
n.v. |
n.v. |
0.63 |
n.v. |
n.v. |
|
GPI mannosyltransferase 1 |
| 41351529 |
|
Pigs |
|
12448 |
3726 |
3983 |
0 |
0 |
|
0.11 |
-0.51 |
-0.42 |
n.v. |
n.v. |
|
GPI transamidase component PIG-S |
| 120587021 |
|
Pigt |
|
275 |
1046 |
2769 |
0 |
0 |
|
0 |
-0.44 |
-0.35 |
n.v. |
n.v. |
|
GPI transamidase component PIG-T precursor |
| 52630436 |
|
Pigu |
|
0 |
211 |
67 |
0 |
0 |
|
n.v. |
-0.43 |
-0.43 |
n.v. |
n.v. |
|
phosphatidylinositol glycan anchor biosynthesis class U
protein precursor |
| 21313052 |
|
Pih1d1 |
|
0 |
0 |
831 |
13490 |
0 |
|
n.v. |
n.v. |
-0.21 |
0.05 |
n.v. |
|
PIH1 domain-containing protein 1 |
| 145279206 |
|
Pik3c2a |
|
0 |
0 |
4743 |
0 |
0 |
|
n.v. |
n.v. |
0.33 |
n.v. |
n.v. |
|
phosphatidylinositol 4-phosphate 3-kinase C2
domain-containing subunit alpha |
| 42475974 |
|
Pik3c3 |
|
0 |
0 |
61 |
655 |
0 |
|
n.v. |
n.v. |
-0.13 |
0.59 |
n.v. |
|
phosphatidylinositol 3-kinase catalytic subunit type 3 |
| 269914109 |
|
Pik3cb |
|
0 |
0 |
51 |
0 |
685 |
|
n.v. |
n.v. |
-0.34 |
n.v. |
0.06 |
|
phosphatidylinositol 4,5-bisphosphate 3-kinase catalytic
subunit beta isoform |
| 255708439 |
|
Pik3cd |
|
0 |
779 |
2840 |
1735 |
0 |
|
n.v. |
0.3 |
0.27 |
-0.2 |
n.v. |
|
phosphatidylinositol 4,5-bisphosphate 3-kinase catalytic
subunit delta isoform isoform b |
| 255708441 |
|
Pik3cd |
|
0 |
779 |
2840 |
1735 |
0 |
|
n.v. |
0.3 |
0.27 |
-0.2 |
n.v. |
|
phosphatidylinositol 4,5-bisphosphate 3-kinase catalytic
subunit delta isoform isoform d |
| 255708443 |
|
Pik3cd |
|
0 |
779 |
2840 |
1735 |
0 |
|
n.v. |
0.3 |
0.27 |
-0.2 |
n.v. |
|
phosphatidylinositol 4,5-bisphosphate 3-kinase catalytic
subunit delta isoform isoform e |
| 255708445 |
|
Pik3cd |
|
0 |
779 |
2840 |
1735 |
0 |
|
n.v. |
0.3 |
0.27 |
-0.2 |
n.v. |
|
phosphatidylinositol 4,5-bisphosphate 3-kinase catalytic
subunit delta isoform isoform a |
| 71067114 |
|
Pik3cd |
|
0 |
779 |
2840 |
1735 |
0 |
|
n.v. |
0.3 |
0.27 |
-0.2 |
n.v. |
|
phosphatidylinositol 4,5-bisphosphate 3-kinase catalytic
subunit delta isoform isoform c |
| 244792921 |
|
Pik3r2 |
|
0 |
0 |
0 |
0 |
535 |
|
n.v. |
n.v. |
n.v. |
n.v. |
-0.29 |
|
phosphatidylinositol 3-kinase regulatory subunit
beta |
| 124486789 |
|
Pik3r4 |
|
0 |
503 |
2701 |
0 |
568 |
|
n.v. |
-0.21 |
0.05 |
n.v. |
-0.15 |
|
phosphoinositide 3-kinase regulatory subunit 4 |
| 126362959 |
|
Pik3r6 |
|
0 |
549 |
888 |
0 |
203 |
|
n.v. |
0.44 |
0.07 |
n.v. |
-0.7 |
|
phosphoinositide 3-kinase regulatory subunit 6 isoform
1 |
| 52138727 |
|
Pik3r6 |
|
0 |
549 |
888 |
0 |
203 |
|
n.v. |
0.44 |
0.07 |
n.v. |
-0.7 |
|
phosphoinositide 3-kinase regulatory subunit 6 isoform
2 |
| 115529473 |
|
Pikfyve |
|
0 |
0 |
47 |
0 |
0 |
|
n.v. |
n.v. |
0.3 |
n.v. |
n.v. |
|
1-phosphatidylinositol 3-phosphate 5-kinase |
| 12963653 |
|
Pin1 |
|
0 |
148 |
16 |
385 |
4348 |
|
n.v. |
0.05 |
0.05 |
-0.08 |
0.11 |
|
peptidyl-prolyl cis-trans isomerase NIMA-interacting
1 |
| 85702071 |
|
Pin1rt1 |
|
0 |
0 |
16 |
49 |
268 |
|
n.v. |
n.v. |
0.05 |
-0.07 |
0.06 |
|
peptidylprolyl cis/trans isomerase, NIMA-interacting
1 |
| 125490368 |
|
Pip4k2a |
|
0 |
0 |
0 |
0 |
1392 |
|
n.v. |
n.v. |
n.v. |
n.v. |
1.65 |
|
phosphatidylinositol 5-phosphate 4-kinase type-2
alpha |
| 33563294 |
|
Pip4k2b |
|
0 |
0 |
0 |
0 |
2913 |
|
n.v. |
n.v. |
n.v. |
n.v. |
0.95 |
|
phosphatidylinositol 5-phosphate 4-kinase type-2
beta |
| 17298686 |
|
Pip4k2c |
|
348 |
3319 |
4166 |
16682 |
25553 |
|
1.3 |
0.04 |
-0.07 |
0.19 |
0.2 |
|
phosphatidylinositol 5-phosphate 4-kinase type-2
gamma |
| 31982833 |
|
Pip5k1a |
|
0 |
265 |
61 |
0 |
0 |
|
n.v. |
0.25 |
0.08 |
n.v. |
n.v. |
|
phosphatidylinositol 4-phosphate 5-kinase type-1
alpha |
| 226442755 |
|
Pip5k1c |
|
0 |
0 |
1 |
0 |
0 |
|
n.v. |
n.v. |
0.58 |
n.v. |
n.v. |
|
phosphatidylinositol 4-phosphate 5-kinase type-1 gamma
isoform 1 |
| 226442759 |
|
Pip5k1c |
|
0 |
0 |
1 |
0 |
0 |
|
n.v. |
n.v. |
0.58 |
n.v. |
n.v. |
|
phosphatidylinositol 4-phosphate 5-kinase type-1 gamma
isoform 2 |
| 126722757 |
|
Pisd |
|
146 |
737 |
0 |
0 |
0 |
|
0.79 |
0.33 |
n.v. |
n.v. |
n.v. |
|
phosphatidylserine decarboxylase proenzyme |
| 6679337 |
|
Pitpna |
|
0 |
2223 |
506 |
6098 |
68905 |
|
n.v. |
0.27 |
-0.1 |
0.37 |
0.02 |
|
phosphatidylinositol transfer protein alpha isoform |
| 9790159 |
|
Pitpnb |
|
0 |
3561 |
2988 |
12491 |
46511 |
|
n.v. |
0.08 |
-0.03 |
0.16 |
0.02 |
|
phosphatidylinositol transfer protein beta isoform |
| 21699068 |
|
Pitrm1 |
|
12961 |
3753 |
0 |
0 |
5526 |
|
0.13 |
-0.18 |
n.v. |
n.v. |
-1.12 |
|
presequence protease, mitochondrial precursor |
| 10946610 |
|
Piwil2 |
|
0 |
0 |
0 |
0 |
2046 |
|
n.v. |
n.v. |
n.v. |
n.v. |
-0.14 |
|
piwi-like protein 2 |
| 21450079 |
|
Pja2 |
|
0 |
0 |
0 |
0 |
396 |
|
n.v. |
n.v. |
n.v. |
n.v. |
0.08 |
|
E3 ubiquitin-protein ligase Praja-2 isoform b |
| 70794801 |
|
Pja2 |
|
0 |
0 |
0 |
0 |
396 |
|
n.v. |
n.v. |
n.v. |
n.v. |
0.08 |
|
E3 ubiquitin-protein ligase Praja-2 isoform a |
| 164519057 |
|
Pkd2 |
|
0 |
0 |
304 |
0 |
0 |
|
n.v. |
n.v. |
-0.43 |
n.v. |
n.v. |
|
polycystin-2 |
| 126157466 |
|
Pkhd1 |
|
0 |
161 |
0 |
0 |
0 |
|
n.v. |
-0.33 |
n.v. |
n.v. |
n.v. |
|
polyductin precursor |
| 6755088 |
|
Pkig |
|
0 |
0 |
0 |
0 |
653 |
|
n.v. |
n.v. |
n.v. |
n.v. |
0.64 |
|
cAMP-dependent protein kinase inhibitor gamma |
| 153792131 |
|
Pklr |
|
0 |
5987 |
20565 |
292143 |
160568 |
|
n.v. |
-0.12 |
-0.1 |
0.1 |
-0.06 |
|
pyruvate kinase isozymes R/L isoform 1 |
| 153792772 |
|
Pklr |
|
0 |
5987 |
20565 |
292143 |
160568 |
|
n.v. |
-0.12 |
-0.1 |
0.1 |
-0.06 |
|
pyruvate kinase isozymes R/L isoform 2 |
| 31981562 |
|
Pkm |
|
1254054 |
128848 |
446646 |
2723550 |
1987095 |
|
0.1 |
0.03 |
-0.03 |
0.24 |
-0.02 |
|
pyruvate kinase, muscle isoform M2 |
| 359807367 |
|
Pkm |
|
1076540 |
97151 |
419967 |
2520335 |
2097392 |
|
0.11 |
0.03 |
-0.03 |
0.23 |
-0.01 |
|
pyruvate kinase, muscle isoform M1 |
| 313760674 |
|
Pkn1 |
|
0 |
0 |
477 |
5779 |
1692 |
|
n.v. |
n.v. |
0.22 |
0.05 |
0.3 |
|
serine/threonine-protein kinase N1 isoform 1 |
| 32813439 |
|
Pkn1 |
|
0 |
0 |
477 |
5779 |
1692 |
|
n.v. |
n.v. |
0.22 |
0.05 |
0.3 |
|
serine/threonine-protein kinase N1 isoform 2 |
| 260099670 |
|
Pkn2 |
|
0 |
2040 |
5665 |
10576 |
867 |
|
n.v. |
0.23 |
0.28 |
0.17 |
-0.31 |
|
serine/threonine-protein kinase N2 |
| 24418929 |
|
Pkn3 |
|
0 |
0 |
421 |
0 |
0 |
|
n.v. |
n.v. |
0.18 |
n.v. |
n.v. |
|
serine/threonine-protein kinase N3 |
| 21312960 |
|
Pkp2 |
|
7780 |
213 |
3263 |
5615 |
0 |
|
0.12 |
0.47 |
-0.53 |
-0.15 |
n.v. |
|
plakophilin-2 |
| 242332585 |
|
Pkp3 |
|
0 |
530 |
1092 |
0 |
0 |
|
n.v. |
-0.63 |
-0.25 |
n.v. |
n.v. |
|
plakophilin-3 isoform 1 |
| 242332587 |
|
Pkp3 |
|
0 |
530 |
1092 |
0 |
0 |
|
n.v. |
-0.63 |
-0.25 |
n.v. |
n.v. |
|
plakophilin-3 isoform 2 |
| 19527008 |
|
Pla2g15 |
|
0 |
1240 |
0 |
0 |
910 |
|
n.v. |
-0.19 |
n.v. |
n.v. |
-0.27 |
|
group XV phospholipase A2 precursor |
| 84781797 |
|
Pla2g16 |
|
0 |
0 |
0 |
0 |
193 |
|
n.v. |
n.v. |
n.v. |
n.v. |
-0.1 |
|
group XVI phospholipase A1/A2 |
| 6679369 |
|
Pla2g4a |
|
0 |
714 |
5249 |
26955 |
1628 |
|
n.v. |
0.4 |
0.08 |
0.18 |
0.39 |
|
cytosolic phospholipase A2 |
| 167900427 |
|
Pla2g4b |
|
0 |
0 |
7 |
0 |
0 |
|
n.v. |
n.v. |
-0.25 |
n.v. |
n.v. |
|
cytosolic phospholipase A2 beta |
| 312222739 |
|
Pla2g6 |
|
0 |
0 |
0 |
2284 |
0 |
|
n.v. |
n.v. |
n.v. |
0.14 |
n.v. |
|
85/88 kDa calcium-independent phospholipase A2 isoform
2 |
| 8393978;312222745 |
|
Pla2g6 |
|
0 |
0 |
0 |
2284 |
0 |
|
n.v. |
n.v. |
n.v. |
0.14 |
n.v. |
|
85/88 kDa calcium-independent phospholipase A2 isoform
1 |
| 31980752 |
|
Pla2g7 |
|
0 |
1879 |
325 |
0 |
0 |
|
n.v. |
-0.19 |
-0.36 |
n.v. |
n.v. |
|
platelet-activating factor acetylhydrolase precursor |
| 114431250 |
|
Plaa |
|
0 |
390 |
1223 |
1171 |
26474 |
|
n.v. |
-1.97 |
-0.11 |
-0.9 |
0.03 |
|
phospholipase A-2-activating protein |
| 21105853 |
|
Plac8 |
|
0 |
0 |
31 |
0 |
0 |
|
n.v. |
n.v. |
0 |
n.v. |
n.v. |
|
placenta-specific gene 8 protein |
| 6679377 |
|
Plau |
|
0 |
987 |
167 |
0 |
0 |
|
n.v. |
0.21 |
-0.31 |
n.v. |
n.v. |
|
urokinase-type plasminogen activator precursor |
| 31560090 |
|
Plbd2 |
|
8238 |
3747 |
1436 |
508 |
11513 |
|
0.14 |
-0.17 |
-0.38 |
-0.18 |
-0.17 |
|
putative phospholipase B-like 2 precursor |
| 31982122 |
|
Plcb3 |
|
7359 |
1927 |
32900 |
36393 |
40535 |
|
0.07 |
-0.12 |
-0.24 |
0.06 |
0.28 |
|
1-phosphatidylinositol 4,5-bisphosphate phosphodiesterase
beta-3 |
| 9790167 |
|
Plcd1 |
|
0 |
0 |
0 |
0 |
1456 |
|
n.v. |
n.v. |
n.v. |
n.v. |
0.32 |
|
1-phosphatidylinositol 4,5-bisphosphate phosphodiesterase
delta-1 |
| 258645148 |
|
Plcd3 |
|
0 |
0 |
568 |
0 |
236 |
|
n.v. |
n.v. |
0.21 |
n.v. |
0.17 |
|
1-phosphatidylinositol 4,5-bisphosphate phosphodiesterase
delta-3 |
| 41393059 |
|
Plcg1 |
|
0 |
0 |
0 |
0 |
8225 |
|
n.v. |
n.v. |
n.v. |
n.v. |
-0.1 |
|
1-phosphatidylinositol 4,5-bisphosphate phosphodiesterase
gamma-1 |
| 26986603 |
|
Plcg2 |
|
0 |
301 |
849 |
5533 |
83266 |
|
n.v. |
0.37 |
-0.12 |
-0.08 |
0.02 |
|
1-phosphatidylinositol 4,5-bisphosphate phosphodiesterase
gamma-2 |
| 295148200 |
|
Plch1 |
|
0 |
0 |
1349 |
0 |
0 |
|
n.v. |
n.v. |
0.16 |
n.v. |
n.v. |
|
1-phosphatidylinositol 4,5-bisphosphate phosphodiesterase
eta-1 isoform 1 |
| 295148202 |
|
Plch1 |
|
0 |
0 |
1349 |
0 |
0 |
|
n.v. |
n.v. |
0.16 |
n.v. |
n.v. |
|
1-phosphatidylinositol 4,5-bisphosphate phosphodiesterase
eta-1 isoform 3 |
| 295148204 |
|
Plch1 |
|
0 |
0 |
1349 |
0 |
0 |
|
n.v. |
n.v. |
0.16 |
n.v. |
n.v. |
|
1-phosphatidylinositol 4,5-bisphosphate phosphodiesterase
eta-1 isoform 2 |
| 197333710 |
|
Plcxd2 |
|
0 |
8972 |
3249 |
1842 |
0 |
|
n.v. |
0.04 |
-0.17 |
-0.16 |
n.v. |
|
phosphatidylinositol-specific phospholipase C, X domain
containing 2 |
| 6679379 |
|
Pld2 |
|
0 |
100 |
1500 |
0 |
0 |
|
n.v. |
0.01 |
-0.12 |
n.v. |
n.v. |
|
phospholipase D2 |
| 7242181 |
|
Pld3 |
|
0 |
58 |
0 |
0 |
0 |
|
n.v. |
-0.21 |
n.v. |
n.v. |
n.v. |
|
phospholipase D3 |
| 256000745;256367522 |
|
Plec |
|
0 |
0 |
9086 |
0 |
0 |
|
n.v. |
n.v. |
0.36 |
n.v. |
n.v. |
|
plectin isoform 1hij |
| 256367522 |
|
Plec |
|
258627 |
12552 |
0 |
7973 |
115202 |
|
-0.01 |
0.07 |
n.v. |
0.76 |
0.14 |
|
plectin isoform 1hij |
| 254675115 |
|
Plec |
|
264028 |
12552 |
9260 |
7973 |
115202 |
|
-0.01 |
0.07 |
0.36 |
0.76 |
0.14 |
|
plectin isoform 12alpha |
| 254675117 |
|
Plec |
|
264028 |
12552 |
9260 |
7973 |
115202 |
|
-0.01 |
0.07 |
0.36 |
0.76 |
0.14 |
|
plectin isoform 1c2alpha3alpha |
| 254675119 |
|
Plec |
|
264028 |
12552 |
9260 |
7973 |
115202 |
|
-0.01 |
0.07 |
0.36 |
0.76 |
0.14 |
|
plectin isoform 1b2alpha |
| 254675195 |
|
Plec |
|
264028 |
12552 |
9260 |
7973 |
115202 |
|
-0.01 |
0.07 |
0.36 |
0.76 |
0.14 |
|
plectin isoform 1c |
| 254675201 |
|
Plec |
|
264028 |
12552 |
9260 |
7973 |
115202 |
|
-0.01 |
0.07 |
0.36 |
0.76 |
0.14 |
|
plectin isoform 1f |
| 254675244 |
|
Plec |
|
264028 |
12552 |
9260 |
7973 |
115202 |
|
-0.01 |
0.07 |
0.36 |
0.76 |
0.14 |
|
plectin isoform 1 |
| 254675251 |
|
Plec |
|
264028 |
12552 |
9260 |
7973 |
115202 |
|
-0.01 |
0.07 |
0.36 |
0.76 |
0.14 |
|
plectin isoform 1d |
| 254675253 |
|
Plec |
|
264028 |
12552 |
9260 |
7973 |
115202 |
|
-0.01 |
0.07 |
0.36 |
0.76 |
0.14 |
|
plectin isoform 1b |
| 254675259 |
|
Plec |
|
264028 |
12552 |
9260 |
7973 |
115202 |
|
-0.01 |
0.07 |
0.36 |
0.76 |
0.14 |
|
plectin isoform 1g |
| 254675265 |
|
Plec |
|
264028 |
12552 |
9260 |
7973 |
115202 |
|
-0.01 |
0.07 |
0.36 |
0.76 |
0.14 |
|
plectin isoform 1a |
| 256418964 |
|
Plec |
|
264028 |
12552 |
9260 |
7973 |
115202 |
|
-0.01 |
0.07 |
0.36 |
0.76 |
0.14 |
|
plectin isoform 1e |
| 19527162 |
|
Plekha1 |
|
0 |
0 |
10 |
0 |
0 |
|
n.v. |
n.v. |
0.62 |
n.v. |
n.v. |
|
pleckstrin homology domain-containing family A member
1 |
| 13752587 |
|
Plekha2 |
|
0 |
33 |
16 |
0 |
707 |
|
n.v. |
0.48 |
-0.59 |
n.v. |
-0.14 |
|
pleckstrin homology domain-containing family A member
2 |
| 237681204 |
|
Plekha6 |
|
311 |
23 |
0 |
0 |
0 |
|
-0.09 |
0.38 |
n.v. |
n.v. |
n.v. |
|
pleckstrin homology domain-containing family A member 6
isoform 2 |
| 33636693 |
|
Plekha6 |
|
311 |
23 |
0 |
0 |
0 |
|
-0.09 |
0.38 |
n.v. |
n.v. |
n.v. |
|
pleckstrin homology domain-containing family A member 6
isoform 1 |
| 170650667 |
|
Plekhf1 |
|
0 |
0 |
79 |
0 |
557 |
|
n.v. |
n.v. |
0.21 |
n.v. |
0.44 |
|
pleckstrin homology domain-containing family F member
1 |
| 29611667 |
|
Plekhf2 |
|
0 |
0 |
79 |
0 |
557 |
|
n.v. |
n.v. |
0.21 |
n.v. |
0.44 |
|
pleckstrin homology domain-containing family F member
2 |
| 84794546 |
|
Plekhg1 |
|
0 |
0 |
1317 |
0 |
0 |
|
n.v. |
n.v. |
0.01 |
n.v. |
n.v. |
|
pleckstrin homology domain containing, family G (with
RhoGef domain) member 1 |
| 167621502 |
|
Plekhg3 |
|
0 |
342 |
1678 |
0 |
1124 |
|
n.v. |
-0.34 |
-0.54 |
n.v. |
0.32 |
|
pleckstrin homology domain-containing family G member
3 |
| 188497685 |
|
Plekhh2 |
|
0 |
0 |
1160 |
0 |
0 |
|
n.v. |
n.v. |
-0.12 |
n.v. |
n.v. |
|
pleckstrin homology domain-containing family H member
2 |
| 124286797 |
|
Plet1 |
|
5089 |
3181 |
21111 |
1007 |
11802 |
|
0.31 |
-0.26 |
-0.26 |
-0.89 |
-0.73 |
|
placenta-expressed transcript 1 protein precursor |
| 257471003 |
|
Plg |
|
0 |
0 |
0 |
974 |
0 |
|
n.v. |
n.v. |
n.v. |
-0.34 |
n.v. |
|
plasminogen precursor |
| 21312800 |
|
Plgrkt |
|
3661 |
16873 |
176 |
0 |
0 |
|
0 |
-0.01 |
-0.23 |
n.v. |
n.v. |
|
plasminogen receptor (KT) |
| 116235489 |
|
Plin2 |
|
14572 |
19036 |
52732 |
4797 |
0 |
|
-0.19 |
0.27 |
0.04 |
0.08 |
n.v. |
|
perilipin-2 |
| 13385312 |
|
Plin3 |
|
29143 |
37437 |
97081 |
135856 |
119647 |
|
-0.12 |
0.26 |
0.12 |
0.14 |
0.16 |
|
perilipin-3 |
| 128485538 |
|
Plk1 |
|
0 |
0 |
60 |
0 |
0 |
|
n.v. |
n.v. |
0 |
n.v. |
n.v. |
|
serine/threonine-protein kinase PLK1 |
| 165932300 |
|
Plk2 |
|
0 |
2175 |
0 |
0 |
0 |
|
n.v. |
-0.1 |
n.v. |
n.v. |
n.v. |
|
serine/threonine-protein kinase PLK2 |
| 6755110 |
|
Plod3 |
|
0 |
63 |
376 |
0 |
0 |
|
n.v. |
0.74 |
-1.07 |
n.v. |
n.v. |
|
procollagen-lysine,2-oxoglutarate 5-dioxygenase 3
precursor |
| 9790169 |
|
Plp2 |
|
2874 |
347 |
288 |
516 |
0 |
|
-0.03 |
0.33 |
0.06 |
0.02 |
n.v. |
|
proteolipid protein 2 |
| 31980791 |
|
Plrg1 |
|
2233 |
61 |
2246 |
1563 |
0 |
|
0.03 |
0.26 |
-0.07 |
-0.13 |
n.v. |
|
pleiotropic regulator 1 |
| 85986577 |
|
Pls1 |
|
0 |
33089 |
34411 |
30917 |
48568 |
|
n.v. |
0.11 |
-0.12 |
0 |
0.05 |
|
plastin-1 |
| 262050551 |
|
Pls3 |
|
16512 |
0 |
0 |
0 |
0 |
|
0.14 |
n.v. |
n.v. |
n.v. |
n.v. |
|
plastin-3 |
| 262050551;262050553 |
|
Pls3 |
|
0 |
0 |
82233 |
0 |
0 |
|
n.v. |
n.v. |
-0.11 |
n.v. |
n.v. |
|
plastin-3 |
| 262050553;262050551 |
|
Pls3 |
|
0 |
59534 |
0 |
60148 |
120000 |
|
n.v. |
0.13 |
n.v. |
0.02 |
0.01 |
|
plastin-3 |
| 194328695 |
|
Plscr1 |
|
0 |
1647 |
7599 |
0 |
0 |
|
n.v. |
0.1 |
-0.22 |
n.v. |
n.v. |
|
phospholipid scramblase 1 |
| 12963735 |
|
Plscr3 |
|
1245 |
8423 |
3515 |
2824 |
0 |
|
0.02 |
-0.12 |
-0.3 |
-0.25 |
n.v. |
|
phospholipid scramblase 3 |
| 255522953 |
|
Plvap |
|
0 |
0 |
1313 |
0 |
0 |
|
n.v. |
n.v. |
0.21 |
n.v. |
n.v. |
|
plasmalemma vesicle-associated protein |
| 6679389 |
|
Plxna1 |
|
0 |
528 |
1901 |
0 |
0 |
|
n.v. |
-0.33 |
0.05 |
n.v. |
n.v. |
|
plexin-A1 precursor |
| 113722113 |
|
Plxna2 |
|
0 |
4918 |
6674 |
11902 |
94651 |
|
n.v. |
0.15 |
-0.02 |
0.08 |
0 |
|
plexin-A2 precursor |
| 124286839 |
|
Plxna3 |
|
0 |
0 |
79 |
0 |
0 |
|
n.v. |
n.v. |
-0.08 |
n.v. |
n.v. |
|
plexin-A3 precursor |
| 171543899 |
|
Plxna4 |
|
0 |
0 |
79 |
0 |
0 |
|
n.v. |
n.v. |
-0.08 |
n.v. |
n.v. |
|
plexin-A4 precursor |
| 225690610 |
|
Plxnb1 |
|
0 |
175 |
1403 |
0 |
0 |
|
n.v. |
0.02 |
0.03 |
n.v. |
n.v. |
|
plexin-B1 precursor |
| 226958474 |
|
Plxnb2 |
|
4229 |
7876 |
71748 |
65 |
0 |
|
0.27 |
-0.27 |
-0.04 |
1.18 |
n.v. |
|
plexin-B2 precursor |
| 13385420 |
|
Pmf1 |
|
0 |
0 |
0 |
0 |
5794 |
|
n.v. |
n.v. |
n.v. |
n.v. |
0.02 |
|
polyamine-modulated factor 1 |
| 9910570 |
|
Pmfbp1 |
|
0 |
0 |
0 |
0 |
7186 |
|
n.v. |
n.v. |
n.v. |
n.v. |
0.09 |
|
polyamine-modulated factor 1-binding protein 1 |
| 160333282 |
|
Pml |
|
4705 |
0 |
0 |
0 |
15850 |
|
-0.03 |
n.v. |
n.v. |
n.v. |
-0.33 |
|
protein PML isoform 2 |
| 160333286 |
|
Pml |
|
4705 |
0 |
0 |
0 |
13269 |
|
-0.03 |
n.v. |
n.v. |
n.v. |
-0.14 |
|
protein PML isoform 1 |
| 33468959 |
|
Pmm1 |
|
0 |
0 |
0 |
0 |
34827 |
|
n.v. |
n.v. |
n.v. |
n.v. |
-0.03 |
|
phosphomannomutase 1 |
| 8393988 |
|
Pmm2 |
|
0 |
2720 |
3509 |
4944 |
106763 |
|
n.v. |
0.01 |
-0.09 |
0.06 |
0.04 |
|
phosphomannomutase 2 |
| 27502349 |
|
Pmpca |
|
0 |
8661 |
0 |
0 |
0 |
|
n.v. |
-0.19 |
n.v. |
n.v. |
n.v. |
|
mitochondrial-processing peptidase subunit alpha
precursor |
| 95113671 |
|
Pmpcb |
|
16860 |
8260 |
44 |
0 |
0 |
|
-0.89 |
0.01 |
0.27 |
n.v. |
n.v. |
|
mitochondrial-processing peptidase subunit beta
precursor |
| 121583910 |
|
Pms2 |
|
0 |
0 |
0 |
0 |
161 |
|
n.v. |
n.v. |
n.v. |
n.v. |
0.27 |
|
mismatch repair endonuclease PMS2 |
| 254588056 |
|
Pmvk |
|
0 |
150 |
31 |
0 |
4873 |
|
n.v. |
0.64 |
-0.27 |
n.v. |
0.11 |
|
phosphomevalonate kinase isoform 1 |
| 254588058 |
|
Pmvk |
|
0 |
150 |
31 |
0 |
4873 |
|
n.v. |
0.64 |
-0.27 |
n.v. |
0.11 |
|
phosphomevalonate kinase isoform 2 |
| 87239984 |
|
Pnkd |
|
0 |
33 |
0 |
0 |
0 |
|
n.v. |
0.27 |
n.v. |
n.v. |
n.v. |
|
probable hydrolase PNKD isoform 3 |
| 87239988 |
|
Pnkd |
|
0 |
33 |
0 |
0 |
0 |
|
n.v. |
0.27 |
n.v. |
n.v. |
n.v. |
|
probable hydrolase PNKD isoform 2 |
| 118601009 |
|
Pnkp |
|
0 |
0 |
291 |
25989 |
5440 |
|
n.v. |
n.v. |
-0.15 |
-0.03 |
-0.23 |
|
bifunctional polynucleotide phosphatase/kinase |
| 112420990 |
|
Pnn |
|
10965 |
555 |
806 |
7375 |
0 |
|
-0.1 |
0.12 |
0.25 |
0.03 |
n.v. |
|
pinin |
| 13384846 |
|
Pno1 |
|
92 |
0 |
275 |
7506 |
0 |
|
0.04 |
n.v. |
0.03 |
0.02 |
n.v. |
|
RNA-binding protein PNO1 |
| 7305395 |
|
Pnp |
|
22114 |
10761 |
20658 |
41779 |
153756 |
|
0.08 |
0.07 |
0.01 |
0.12 |
0.05 |
|
purine nucleoside phosphorylase |
| 183074535 |
|
Pnp2 |
|
7945 |
7924 |
9187 |
24197 |
42527 |
|
0.2 |
0.09 |
0 |
0.12 |
0.05 |
|
purine-nucleoside phosphorylase 2 |
| 170763470 |
|
Pnpla6 |
|
3222 |
0 |
282 |
0 |
0 |
|
0.12 |
n.v. |
-0.45 |
n.v. |
n.v. |
|
neuropathy target esterase isoform 2 |
| 390608665 |
|
Pnpla6 |
|
3222 |
0 |
282 |
0 |
0 |
|
0.12 |
n.v. |
-0.45 |
n.v. |
n.v. |
|
neuropathy target esterase isoform 1 |
| 118130807 |
|
Pnpla8 |
|
0 |
115 |
0 |
0 |
0 |
|
n.v. |
-1.2 |
n.v. |
n.v. |
n.v. |
|
calcium-independent phospholipase A2-gamma |
| 19527238 |
|
Pnpo |
|
0 |
0 |
0 |
0 |
11888 |
|
n.v. |
n.v. |
n.v. |
n.v. |
0.09 |
|
pyridoxine-5'-phosphate oxidase |
| 377833162 |
|
Pnpt1 |
|
0 |
3135 |
50 |
0 |
0 |
|
n.v. |
-0.23 |
-1.1 |
n.v. |
n.v. |
|
PREDICTED: polyribonucleotide nucleotidyltransferase 1,
mitochondrial isoform 1 |
| 407261876 |
|
Pnpt1 |
|
0 |
3135 |
50 |
0 |
0 |
|
n.v. |
-0.23 |
-1.1 |
n.v. |
n.v. |
|
PREDICTED: polyribonucleotide nucleotidyltransferase 1,
mitochondrial |
| 407261878 |
|
Pnpt1 |
|
0 |
2993 |
50 |
0 |
0 |
|
n.v. |
-0.28 |
-1.1 |
n.v. |
n.v. |
|
PREDICTED: polyribonucleotide nucleotidyltransferase 1,
mitochondrial |
| 407261880 |
|
Pnpt1 |
|
0 |
3135 |
50 |
0 |
0 |
|
n.v. |
-0.23 |
-1.1 |
n.v. |
n.v. |
|
PREDICTED: polyribonucleotide nucleotidyltransferase 1,
mitochondrial |
| 31657132 |
|
Pof1b |
|
0 |
0 |
0 |
1604 |
0 |
|
n.v. |
n.v. |
n.v. |
-1.42 |
n.v. |
|
protein POF1B |
| 19525731 |
|
Pofut2 |
|
970 |
568 |
9 |
0 |
0 |
|
-0.06 |
-0.31 |
-0.57 |
n.v. |
n.v. |
|
GDP-fucose protein O-fucosyltransferase 2 precursor |
| 27369505 |
|
Poglut1 |
|
1867 |
150 |
0 |
0 |
0 |
|
-0.95 |
1.15 |
n.v. |
n.v. |
n.v. |
|
protein O-glucosyltransferase 1 precursor |
| 6679409 |
|
Pola1 |
|
0 |
511 |
656 |
19834 |
38854 |
|
n.v. |
0.54 |
0.05 |
0.28 |
0.07 |
|
DNA polymerase alpha catalytic subunit |
| 255708463 |
|
Pola2 |
|
0 |
1516 |
1017 |
28191 |
6736 |
|
n.v. |
-0.13 |
0.05 |
0.06 |
0.11 |
|
DNA polymerase alpha subunit B isoform 2 |
| 31982107 |
|
Pola2 |
|
0 |
1516 |
1017 |
33765 |
7518 |
|
n.v. |
-0.13 |
0.05 |
0.13 |
0.08 |
|
DNA polymerase alpha subunit B isoform 1 |
| 21729749 |
|
Polb |
|
0 |
0 |
101 |
2611 |
0 |
|
n.v. |
n.v. |
0.54 |
0.04 |
n.v. |
|
DNA polymerase beta |
| 254587977 |
|
Pold1 |
|
0 |
2014 |
3657 |
43924 |
55357 |
|
n.v. |
0.2 |
0.03 |
0 |
-0.02 |
|
DNA polymerase delta catalytic subunit |
| 226423863 |
|
Pold2 |
|
677 |
1286 |
998 |
26063 |
18174 |
|
-0.31 |
0.15 |
0.02 |
-0.07 |
0.01 |
|
DNA polymerase delta subunit 2 |
| 29789321 |
|
Pold3 |
|
0 |
0 |
718 |
36663 |
2024 |
|
n.v. |
n.v. |
-0.02 |
0.22 |
0.18 |
|
DNA polymerase delta subunit 3 |
| 21312396 |
|
Pold4 |
|
0 |
0 |
0 |
65 |
0 |
|
n.v. |
n.v. |
n.v. |
-0.81 |
n.v. |
|
DNA polymerase delta subunit 4 |
| 14780884 |
|
Poldip2 |
|
0 |
4605 |
0 |
0 |
0 |
|
n.v. |
-0.16 |
n.v. |
n.v. |
n.v. |
|
polymerase delta-interacting protein 2 |
| 30519969 |
|
Poldip3 |
|
0 |
614 |
1304 |
8538 |
0 |
|
n.v. |
0.25 |
-0.52 |
-0.11 |
n.v. |
|
polymerase delta-interacting protein 3 |
| 195947387 |
|
Pole |
|
0 |
177 |
364 |
6016 |
343 |
|
n.v. |
-0.26 |
0.21 |
0.15 |
0.29 |
|
DNA polymerase epsilon catalytic subunit A |
| 33468927 |
|
Pole2 |
|
0 |
0 |
0 |
2382 |
0 |
|
n.v. |
n.v. |
n.v. |
0.36 |
n.v. |
|
DNA polymerase epsilon subunit 2 |
| 31981174 |
|
Pole3 |
|
0 |
0 |
0 |
205 |
2774 |
|
n.v. |
n.v. |
n.v. |
-0.7 |
-0.11 |
|
DNA polymerase epsilon subunit 3 |
| 13385366 |
|
Pole4 |
|
0 |
0 |
9 |
778 |
3930 |
|
n.v. |
n.v. |
0.7 |
0.36 |
-0.04 |
|
DNA polymerase epsilon subunit 4 |
| 256985188 |
|
Polr1a |
|
0 |
0 |
423 |
0 |
0 |
|
n.v. |
n.v. |
-0.39 |
n.v. |
n.v. |
|
DNA-directed RNA polymerase I subunit RPA1 |
| 224967092 |
|
Polr1b |
|
0 |
0 |
41 |
0 |
0 |
|
n.v. |
n.v. |
-0.33 |
n.v. |
n.v. |
|
DNA-directed RNA polymerase I subunit RPA2 |
| 119226251 |
|
Polr1c |
|
0 |
1192 |
1580 |
8881 |
2624 |
|
n.v. |
-0.07 |
-0.18 |
-0.01 |
-0.11 |
|
DNA-directed RNA polymerases I and III subunit RPAC1 |
| 6677791 |
|
Polr1d |
|
0 |
315 |
102 |
3078 |
814 |
|
n.v. |
-0.01 |
0.19 |
-0.06 |
0.25 |
|
DNA-directed RNA polymerases I and III subunit RPAC2
isoform 1 |
| 6677795 |
|
Polr2a |
|
0 |
173 |
0 |
819 |
2710 |
|
n.v. |
0.46 |
n.v. |
-0.06 |
-0.15 |
|
DNA-directed RNA polymerase II subunit RPB1 |
| 226958589 |
|
Polr2b |
|
0 |
1278 |
383 |
28003 |
11470 |
|
n.v. |
-0.13 |
-0.1 |
0 |
0.12 |
|
DNA-directed RNA polymerase II subunit RPB2 |
| 29336059 |
|
Polr2c |
|
0 |
950 |
198 |
12393 |
5055 |
|
n.v. |
-0.44 |
0.32 |
0.15 |
-0.09 |
|
DNA-directed RNA polymerase II subunit RPB3 |
| 28076931 |
|
Polr2d |
|
0 |
0 |
0 |
442 |
0 |
|
n.v. |
n.v. |
n.v. |
0.69 |
n.v. |
|
DNA-directed RNA polymerase II subunit RPB4 isoform 2 |
| 21312246 |
|
Polr2d |
|
403 |
0 |
0 |
2005 |
0 |
|
0.28 |
n.v. |
n.v. |
0.08 |
n.v. |
|
DNA-directed RNA polymerase II subunit RPB4 isoform 1 |
| 124249077 |
|
Polr2e |
|
1849 |
1468 |
1661 |
13883 |
910 |
|
0.02 |
0.01 |
-0.1 |
0 |
-0.07 |
|
DNA-directed RNA polymerases I, II, and III subunit
RPABC1 |
| 13385826 |
|
Polr2g |
|
0 |
353 |
0 |
9872 |
2431 |
|
n.v. |
0.14 |
n.v. |
0.01 |
-0.07 |
|
DNA-directed RNA polymerase II subunit RPB7 |
| 21704118 |
|
Polr2h |
|
15450 |
42 |
1096 |
6729 |
3481 |
|
-0.14 |
0.07 |
-0.15 |
0.02 |
0.07 |
|
DNA-directed RNA polymerases I, II, and III subunit
RPABC3 |
| 110625757 |
|
Polr2i |
|
0 |
0 |
0 |
884 |
3459 |
|
n.v. |
n.v. |
n.v. |
0.56 |
0.03 |
|
DNA-directed RNA polymerase II subunit RPB9 |
| 188219604 |
|
Polr2j |
|
787 |
232 |
60 |
2145 |
2635 |
|
0.06 |
-0.16 |
-0.02 |
0.01 |
0.06 |
|
DNA-directed RNA polymerase II subunit RPB11 |
| 219881031 |
|
Polr2l |
|
0 |
0 |
63 |
0 |
0 |
|
n.v. |
n.v. |
-0.62 |
n.v. |
n.v. |
|
DNA-directed RNA polymerases I, II, and III subunit
RPABC5 |
| 258645114 |
|
Polr2m |
|
0 |
0 |
0 |
0 |
353 |
|
n.v. |
n.v. |
n.v. |
n.v. |
-1.94 |
|
DNA-directed RNA polymerase II subunit GRINL1A isoform 2 |
| 30519919 |
|
Polr2m |
|
0 |
0 |
0 |
0 |
353 |
|
n.v. |
n.v. |
n.v. |
n.v. |
-1.94 |
|
DNA-directed RNA polymerase II subunit GRINL1A isoform 1 |
| 46195739 |
|
Polr3b |
|
0 |
0 |
0 |
90 |
0 |
|
n.v. |
n.v. |
n.v. |
0.35 |
n.v. |
|
DNA-directed RNA polymerase III subunit RPC2 |
| 198278473 |
|
Polr3c |
|
0 |
0 |
0 |
3888 |
2228 |
|
n.v. |
n.v. |
n.v. |
-0.01 |
0.11 |
|
DNA-directed RNA polymerase III subunit RPC3 |
| 27754160 |
|
Polr3f |
|
0 |
0 |
54 |
475 |
0 |
|
n.v. |
n.v. |
0.35 |
-0.1 |
n.v. |
|
DNA-directed RNA polymerase III subunit RPC6 |
| 281332113 |
|
Polrmt |
|
0 |
73 |
0 |
0 |
0 |
|
n.v. |
0.71 |
n.v. |
n.v. |
n.v. |
|
DNA-directed RNA polymerase, mitochondrial precursor |
| 13385086 |
|
Pomp |
|
0 |
0 |
0 |
25 |
0 |
|
n.v. |
n.v. |
n.v. |
0.57 |
n.v. |
|
proteasome maturation protein |
| 27370510 |
|
Pon3 |
|
989 |
0 |
135 |
0 |
0 |
|
-0.87 |
n.v. |
-0.6 |
n.v. |
n.v. |
|
serum paraoxonase/lactonase 3 precursor |
| 21312814 |
|
Pop1 |
|
0 |
0 |
604 |
5844 |
0 |
|
n.v. |
n.v. |
-0.16 |
-0.03 |
n.v. |
|
processing of precursor 1 isoform 2 |
| 23097256 |
|
Pop1 |
|
0 |
0 |
604 |
5844 |
0 |
|
n.v. |
n.v. |
-0.16 |
-0.03 |
n.v. |
|
processing of precursor 1 isoform 1 |
| 13384772 |
|
Pop4 |
|
0 |
0 |
28 |
2447 |
0 |
|
n.v. |
n.v. |
-0.16 |
0.01 |
n.v. |
|
ribonuclease P protein subunit p29 |
| 20270200 |
|
Pop5 |
|
0 |
0 |
25 |
1203 |
0 |
|
n.v. |
n.v. |
0 |
-0.13 |
n.v. |
|
ribonuclease P/MRP protein subunit POP5 |
| 13899215 |
|
Pop7 |
|
0 |
0 |
0 |
1351 |
0 |
|
n.v. |
n.v. |
n.v. |
0 |
n.v. |
|
ribonuclease P protein subunit p20 |
| 6679421 |
|
Por |
|
149871 |
11548 |
43531 |
10772 |
0 |
|
0.06 |
-0.33 |
-0.38 |
-0.21 |
n.v. |
|
NADPH--cytochrome P450 reductase |
| 27754065 |
|
Ppa1 |
|
0 |
2814 |
1324 |
688 |
101548 |
|
n.v. |
0.27 |
-0.07 |
0.99 |
0.07 |
|
inorganic pyrophosphatase |
| 22203753 |
|
Ppa2 |
|
16750 |
13824 |
0 |
0 |
20348 |
|
-0.02 |
-0.06 |
n.v. |
n.v. |
-0.24 |
|
inorganic pyrophosphatase 2, mitochondrial precursor |
| 110431341 |
|
Ppap2c |
|
10196 |
2950 |
8925 |
2423 |
0 |
|
0.18 |
0.27 |
0 |
-0.11 |
n.v. |
|
lipid phosphate phosphohydrolase 2 |
| 77861908 |
|
Ppapdc2 |
|
989 |
0 |
0 |
0 |
0 |
|
-0.07 |
n.v. |
n.v. |
n.v. |
n.v. |
|
presqualene diphosphate phosphatase |
| 26024309 |
|
Ppat |
|
0 |
1516 |
3206 |
71321 |
28230 |
|
n.v. |
-0.31 |
-0.08 |
0.12 |
0.01 |
|
phosphoribosyl pyrophosphate amidotransferase |
| 28849879 |
|
Ppcdc |
|
0 |
198 |
157 |
65 |
10485 |
|
n.v. |
-0.17 |
0.33 |
0.7 |
0.17 |
|
phosphopantothenoylcysteine decarboxylase |
| 76096364 |
|
Ppcs |
|
0 |
0 |
0 |
0 |
2667 |
|
n.v. |
n.v. |
n.v. |
n.v. |
0.23 |
|
phosphopantothenate--cysteine ligase |
| 189491857 |
|
Ppfia1 |
|
0 |
0 |
976 |
0 |
0 |
|
n.v. |
n.v. |
0.31 |
n.v. |
n.v. |
|
liprin-alpha-1 isoform B |
| 304361734 |
|
Ppfia1 |
|
0 |
0 |
976 |
0 |
0 |
|
n.v. |
n.v. |
0.31 |
n.v. |
n.v. |
|
liprin-alpha-1 isoform A |
| 281371356 |
|
Ppfibp1 |
|
0 |
163 |
2221 |
941 |
0 |
|
n.v. |
0.57 |
0.07 |
0.34 |
n.v. |
|
liprin-beta-1 isoform 1 |
| 49274606 |
|
Ppfibp1 |
|
0 |
163 |
2221 |
941 |
0 |
|
n.v. |
0.57 |
0.07 |
0.34 |
n.v. |
|
liprin-beta-1 isoform 2 |
| 6679439 |
|
Ppia |
|
1020029 |
202372 |
237696 |
518220 |
952696 |
|
0.04 |
0.13 |
0.06 |
0.05 |
0.06 |
|
peptidyl-prolyl cis-trans isomerase A |
| 71774133 |
|
Ppib |
|
372216 |
60442 |
31261 |
17263 |
5708 |
|
0.04 |
-0.21 |
-0.2 |
-0.31 |
-0.51 |
|
peptidyl-prolyl cis-trans isomerase B precursor |
| 6679441 |
|
Ppic |
|
1172 |
919 |
350 |
213 |
1746 |
|
0.17 |
-0.36 |
-0.19 |
-0.56 |
-0.27 |
|
peptidyl-prolyl cis-trans isomerase C precursor |
| 13385854 |
|
Ppid |
|
659 |
2409 |
11023 |
51127 |
223186 |
|
0.05 |
-0.13 |
0.03 |
0.02 |
0.02 |
|
peptidyl-prolyl cis-trans isomerase D |
| 14196340 |
|
Ppie |
|
0 |
0 |
0 |
25 |
1917 |
|
n.v. |
n.v. |
n.v. |
-0.03 |
-0.25 |
|
peptidyl-prolyl cis-trans isomerase E |
| 19527310 |
|
Ppif |
|
0 |
3970 |
0 |
0 |
0 |
|
n.v. |
-0.18 |
n.v. |
n.v. |
n.v. |
|
peptidyl-prolyl cis-trans isomerase F, mitochondrial
precursor |
| 124487333 |
|
Ppig |
|
0 |
2104 |
149 |
884 |
0 |
|
n.v. |
-0.05 |
-0.12 |
-0.22 |
n.v. |
|
peptidyl-prolyl cis-trans isomerase G |
| 158631196 |
|
Ppih |
|
769 |
854 |
754 |
10265 |
3641 |
|
-0.04 |
0.07 |
0.02 |
0.11 |
0.08 |
|
peptidyl-prolyl cis-trans isomerase H isoform 2 |
| 21312022 |
|
Ppih |
|
1849 |
946 |
822 |
9151 |
4059 |
|
0.13 |
0.16 |
0.05 |
0.07 |
0.08 |
|
peptidyl-prolyl cis-trans isomerase H isoform 1 |
| 21312784 |
|
Ppil1 |
|
1428 |
4121 |
27401 |
11533 |
26056 |
|
0.26 |
0.07 |
0.17 |
0.03 |
0.02 |
|
peptidyl-prolyl cis-trans isomerase-like 1 |
| 356995944;30025020 |
|
Ppil2 |
|
0 |
0 |
2008 |
0 |
0 |
|
n.v. |
n.v. |
-0.08 |
n.v. |
n.v. |
|
peptidyl-prolyl cis-trans isomerase-like 2 |
| 30025020 |
|
Ppil2 |
|
0 |
334 |
0 |
393 |
118 |
|
n.v. |
-0.25 |
n.v. |
-0.1 |
0.11 |
|
peptidyl-prolyl cis-trans isomerase-like 2 |
| 169790966 |
|
Ppil3 |
|
0 |
44 |
0 |
0 |
546 |
|
n.v. |
0.29 |
n.v. |
n.v. |
-0.23 |
|
peptidyl-prolyl cis-trans isomerase-like 3 isoform 2 |
| 21746159 |
|
Ppil3 |
|
0 |
44 |
0 |
0 |
546 |
|
n.v. |
0.29 |
n.v. |
n.v. |
-0.23 |
|
peptidyl-prolyl cis-trans isomerase-like 3 isoform 1 |
| 165972339 |
|
Ppil4 |
|
0 |
0 |
615 |
1154 |
0 |
|
n.v. |
n.v. |
-0.2 |
-0.64 |
n.v. |
|
peptidyl-prolyl cis-trans isomerase-like 4 |
| 145207986 |
|
Ppip5k1 |
|
0 |
65 |
67 |
0 |
0 |
|
n.v. |
-0.06 |
0.43 |
n.v. |
n.v. |
|
inositol hexakisphosphate and
diphosphoinositol-pentakisphosphate kinase 1 |
| 166706913 |
|
Ppip5k2 |
|
0 |
65 |
92 |
0 |
0 |
|
n.v. |
-0.06 |
0.56 |
n.v. |
n.v. |
|
inositol hexakisphosphate and
diphosphoinositol-pentakisphosphate kinase 2 |
| 112421039 |
|
Ppl |
|
500230 |
19105 |
56702 |
1834 |
47486 |
|
0.06 |
0.01 |
0.15 |
-0.64 |
-0.62 |
|
periplakin |
| 6679443 |
|
Ppm1a |
|
0 |
864 |
1136 |
0 |
27106 |
|
n.v. |
0.21 |
-0.27 |
n.v. |
0.15 |
|
protein phosphatase 1A |
| 226958356 |
|
Ppm1b |
|
0 |
0 |
686 |
0 |
18902 |
|
n.v. |
n.v. |
-0.27 |
n.v. |
0.07 |
|
protein phosphatase 1B isoform 3 |
| 226958358 |
|
Ppm1b |
|
0 |
0 |
686 |
0 |
18902 |
|
n.v. |
n.v. |
-0.27 |
n.v. |
0.07 |
|
protein phosphatase 1B isoform 4 |
| 33859600 |
|
Ppm1b |
|
0 |
0 |
686 |
0 |
18902 |
|
n.v. |
n.v. |
-0.27 |
n.v. |
0.07 |
|
protein phosphatase 1B isoform 2 |
| 226958354 |
|
Ppm1b |
|
10398 |
0 |
686 |
0 |
18902 |
|
-0.07 |
n.v. |
-0.27 |
n.v. |
0.07 |
|
protein phosphatase 1B isoform 1 |
| 28849881 |
|
Ppm1f |
|
0 |
0 |
0 |
0 |
13387 |
|
n.v. |
n.v. |
n.v. |
n.v. |
-0.22 |
|
protein phosphatase 1F |
| 6679793 |
|
Ppm1g |
|
0 |
1733 |
3847 |
1154 |
79497 |
|
n.v. |
0.14 |
0.08 |
0.58 |
0.05 |
|
protein phosphatase 1G |
| 160358864 |
|
Ppm1h |
|
0 |
0 |
105 |
565 |
0 |
|
n.v. |
n.v. |
0.48 |
0.21 |
n.v. |
|
protein phosphatase 1H isoform 2 |
| 160358866 |
|
Ppm1h |
|
0 |
0 |
105 |
565 |
0 |
|
n.v. |
n.v. |
0.48 |
0.21 |
n.v. |
|
protein phosphatase 1H isoform 1 |
| 66392585 |
|
Ppm1l |
|
0 |
29 |
0 |
0 |
0 |
|
n.v. |
1.46 |
n.v. |
n.v. |
n.v. |
|
protein phosphatase 1L |
| 30794138 |
|
Ppme1 |
|
0 |
804 |
465 |
0 |
13826 |
|
n.v. |
0.38 |
0.08 |
n.v. |
0.04 |
|
protein phosphatase methylesterase 1 |
| 6679445 |
|
Ppox |
|
0 |
1998 |
0 |
0 |
0 |
|
n.v. |
-0.11 |
n.v. |
n.v. |
n.v. |
|
protoporphyrinogen oxidase |
| 13994195 |
|
Ppp1ca |
|
258646 |
71568 |
66616 |
86423 |
315705 |
|
0.11 |
0.05 |
-0.11 |
0 |
-0.07 |
|
serine/threonine-protein phosphatase PP1-alpha catalytic
subunit |
| 161484668 |
|
Ppp1cb |
|
228807 |
77772 |
60590 |
81176 |
335989 |
|
0.11 |
0.07 |
-0.09 |
0.01 |
-0.04 |
|
serine/threonine-protein phosphatase PP1-beta catalytic
subunit |
| 31980772 |
|
Ppp1cc |
|
196735 |
67114 |
51133 |
69602 |
285280 |
|
0.12 |
0.06 |
-0.09 |
0.05 |
-0.03 |
|
serine/threonine-protein phosphatase PP1-gamma catalytic
subunit |
| 255308881 |
|
Ppp1r10 |
|
0 |
0 |
13 |
0 |
0 |
|
n.v. |
n.v. |
0.01 |
n.v. |
n.v. |
|
serine/threonine-protein phosphatase 1 regulatory subunit
10 |
| 18390327 |
|
Ppp1r11 |
|
0 |
0 |
0 |
0 |
1799 |
|
n.v. |
n.v. |
n.v. |
n.v. |
0.04 |
|
protein phosphatase 1 regulatory subunit 11 |
| 95772123 |
|
Ppp1r12a |
|
0 |
1470 |
486 |
2660 |
11116 |
|
n.v. |
0.06 |
0.07 |
0.27 |
-0.04 |
|
protein phosphatase 1 regulatory subunit 12A |
| 124486803 |
|
Ppp1r12b |
|
0 |
202 |
0 |
516 |
2056 |
|
n.v. |
0.51 |
n.v. |
0.35 |
-0.69 |
|
protein phosphatase 1 regulatory subunit 12B |
| 45592936 |
|
Ppp1r13b |
|
0 |
1081 |
1692 |
79089 |
4819 |
|
n.v. |
0.37 |
0.08 |
0.12 |
-0.14 |
|
apoptosis-stimulating of p53 protein 1 |
| 58082069 |
|
Ppp1r13l |
|
0 |
50 |
54 |
0 |
0 |
|
n.v. |
1.8 |
0.13 |
n.v. |
n.v. |
|
relA-associated inhibitor |
| 62122946 |
|
Ppp1r14b |
|
0 |
73 |
0 |
0 |
2442 |
|
n.v. |
0.21 |
n.v. |
n.v. |
0.12 |
|
protein phosphatase 1 regulatory subunit 14B |
| 226443075;226443079 |
|
Ppp1r18 |
|
0 |
0 |
531 |
0 |
0 |
|
n.v. |
n.v. |
-0.02 |
n.v. |
n.v. |
|
phostensin |
| 21536256 |
|
Ppp1r1b |
|
0 |
0 |
0 |
0 |
11 |
|
n.v. |
n.v. |
n.v. |
n.v. |
-0.53 |
|
protein phosphatase 1 regulatory subunit 1B |
| 18859587 |
|
Ppp1r2 |
|
0 |
0 |
15 |
0 |
0 |
|
n.v. |
n.v. |
0.12 |
n.v. |
n.v. |
|
protein phosphatase inhibitor 2 |
| 254911014 |
|
Ppp1r21 |
|
0 |
180 |
101 |
933 |
2078 |
|
n.v. |
0.03 |
-0.05 |
0.25 |
-0.37 |
|
protein phosphatase 1 regulatory subunit 21 |
| 12963569 |
|
Ppp1r7 |
|
0 |
3305 |
4485 |
0 |
199186 |
|
n.v. |
0.19 |
0.1 |
n.v. |
0.06 |
|
protein phosphatase 1 regulatory subunit 7 |
| 22122685 |
|
Ppp1r8 |
|
0 |
0 |
0 |
0 |
1906 |
|
n.v. |
n.v. |
n.v. |
n.v. |
0.05 |
|
nuclear inhibitor of protein phosphatase 1 |
| 31711997 |
|
Ppp1r9a |
|
14297 |
1349 |
262 |
0 |
0 |
|
-0.05 |
-0.24 |
-0.05 |
n.v. |
n.v. |
|
neurabin-1 |
| 50053703 |
|
Ppp1r9b |
|
14297 |
1349 |
266 |
0 |
0 |
|
-0.05 |
-0.24 |
0.01 |
n.v. |
n.v. |
|
neurabin-2 |
| 9506983 |
|
Ppp2ca |
|
23816 |
18740 |
8755 |
28371 |
157108 |
|
0.05 |
0.11 |
0.01 |
0.09 |
-0.16 |
|
serine/threonine-protein phosphatase 2A catalytic subunit
alpha isoform |
| 8394024 |
|
Ppp2cb |
|
22278 |
17410 |
8622 |
27389 |
156305 |
|
0.06 |
0.14 |
0.01 |
0.12 |
-0.16 |
|
serine/threonine-protein phosphatase 2A catalytic subunit
beta isoform |
| 8394027 |
|
Ppp2r1a |
|
36630 |
17180 |
49652 |
218407 |
151025 |
|
0 |
0.14 |
-0.01 |
0.08 |
-0.01 |
|
serine/threonine-protein phosphatase 2A 65 kDa regulatory
subunit A alpha isoform |
| 557440787 |
|
Ppp2r1b |
|
26983 |
0 |
0 |
0 |
0 |
|
0 |
n.v. |
n.v. |
n.v. |
n.v. |
|
serine/threonine-protein phosphatase 2A 65 kDa regulatory
subunit A beta isoform isoform c |
| 77539770 |
|
Ppp2r1b |
|
28960 |
3891 |
3534 |
24851 |
2142 |
|
-0.01 |
-0.21 |
-0.35 |
0.07 |
0.17 |
|
serine/threonine-protein phosphatase 2A 65 kDa regulatory
subunit A beta isoform isoform a |
| 77539776 |
|
Ppp2r1b |
|
28960 |
3891 |
3534 |
24794 |
2142 |
|
-0.01 |
-0.21 |
-0.35 |
0.07 |
0.17 |
|
serine/threonine-protein phosphatase 2A 65 kDa regulatory
subunit A beta isoform isoform b |
| 110625886 |
|
Ppp2r2a |
|
0 |
374 |
4568 |
2505 |
68766 |
|
n.v. |
0.34 |
0.17 |
0.11 |
0.03 |
|
serine/threonine-protein phosphatase 2A 55 kDa regulatory
subunit B alpha isoform isoform 1 |
| 327180707 |
|
Ppp2r2a |
|
0 |
374 |
4568 |
2505 |
65521 |
|
n.v. |
0.34 |
0.17 |
0.11 |
-0.01 |
|
serine/threonine-protein phosphatase 2A 55 kDa regulatory
subunit B alpha isoform isoform 2 |
| 21312161 |
|
Ppp2r2b |
|
0 |
17 |
0 |
1506 |
6576 |
|
n.v. |
0.34 |
n.v. |
0.12 |
-0.09 |
|
serine/threonine-protein phosphatase 2A 55 kDa regulatory
subunit B beta isoform isoform 2 |
| 27370502 |
|
Ppp2r2c |
|
0 |
211 |
1459 |
999 |
16193 |
|
n.v. |
0.2 |
0.02 |
0.1 |
-0.01 |
|
serine/threonine-protein phosphatase 2A 55 kDa regulatory
subunit B gamma isoform |
| 22726177 |
|
Ppp2r2d |
|
0 |
17 |
0 |
1506 |
6576 |
|
n.v. |
0.34 |
n.v. |
0.12 |
-0.09 |
|
serine/threonine-protein phosphatase 2A 55 kDa regulatory
subunit B delta isoform |
| 254587947 |
|
Ppp2r4 |
|
0 |
115 |
1766 |
3610 |
41199 |
|
n.v. |
0.27 |
-0.01 |
0.19 |
0.12 |
|
serine/threonine-protein phosphatase 2A activator |
| 47059051 |
|
Ppp2r5a |
|
0 |
825 |
1018 |
7220 |
9735 |
|
n.v. |
-0.44 |
-0.21 |
0.1 |
0.11 |
|
serine/threonine-protein phosphatase 2A 56 kDa regulatory
subunit alpha isoform |
| 37718993 |
|
Ppp2r5b |
|
0 |
0 |
792 |
1776 |
6693 |
|
n.v. |
n.v. |
-0.08 |
1.56 |
0.07 |
|
serine/threonine-protein phosphatase 2A 56 kDa regulatory
subunit beta isoform |
| 125346006 |
|
Ppp2r5c |
|
934 |
536 |
2865 |
3291 |
4070 |
|
0 |
-0.23 |
-0.08 |
0.25 |
-0.07 |
|
serine/threonine-protein phosphatase 2A 56 kDa regulatory
subunit gamma isoform isoform b |
| 125346020 |
|
Ppp2r5c |
|
934 |
536 |
2865 |
3291 |
4070 |
|
0 |
-0.23 |
-0.08 |
0.25 |
-0.07 |
|
serine/threonine-protein phosphatase 2A 56 kDa regulatory
subunit gamma isoform isoform a |
| 125346154 |
|
Ppp2r5c |
|
934 |
536 |
2865 |
3291 |
4070 |
|
0 |
-0.23 |
-0.08 |
0.25 |
-0.07 |
|
serine/threonine-protein phosphatase 2A 56 kDa regulatory
subunit gamma isoform isoform c |
| 218751908 |
|
Ppp2r5c |
|
934 |
536 |
2865 |
3291 |
4070 |
|
0 |
-0.23 |
-0.08 |
0.25 |
-0.07 |
|
serine/threonine-protein phosphatase 2A 56 kDa regulatory
subunit gamma isoform isoform d |
| 33942059 |
|
Ppp2r5d |
|
0 |
2194 |
3317 |
5910 |
15764 |
|
n.v. |
0.22 |
-0.01 |
0.36 |
0.33 |
|
delta isoform of regulatory subunit B56, protein
phosphatase 2A |
| 33859660 |
|
Ppp2r5e |
|
0 |
4421 |
3392 |
9823 |
20616 |
|
n.v. |
0.04 |
-0.04 |
0.24 |
-0.08 |
|
serine/threonine-protein phosphatase 2A 56 kDa regulatory
subunit epsilon isoform |
| 42415473 |
|
Ppp3ca |
|
0 |
378 |
3156 |
884 |
36873 |
|
n.v. |
0.24 |
-0.1 |
0.16 |
-0.12 |
|
serine/threonine-protein phosphatase 2B catalytic subunit
alpha isoform |
| 45592930 |
|
Ppp3cb |
|
0 |
0 |
1216 |
884 |
6511 |
|
n.v. |
n.v. |
-0.81 |
0.16 |
0.28 |
|
serine/threonine-protein phosphatase 2B catalytic subunit
beta isoform |
| 6679447 |
|
Ppp3cc |
|
0 |
0 |
155 |
0 |
4766 |
|
n.v. |
n.v. |
0.13 |
n.v. |
0.29 |
|
serine/threonine-protein phosphatase 2B catalytic subunit
gamma isoform |
| 84794597 |
|
Ppp3r1 |
|
0 |
0 |
224 |
368 |
0 |
|
n.v. |
n.v. |
-0.16 |
0.39 |
n.v. |
|
calcineurin subunit B type 1 |
| 9790175 |
|
Ppp4c |
|
0 |
1534 |
836 |
4191 |
17681 |
|
n.v. |
-0.05 |
0.01 |
0.08 |
-1.24 |
|
serine/threonine-protein phosphatase 4 catalytic
subunit |
| 166706860 |
|
Ppp4r1 |
|
0 |
0 |
218 |
1760 |
14319 |
|
n.v. |
n.v. |
0.12 |
0.35 |
-0.01 |
|
serine/threonine-protein phosphatase 4 regulatory subunit
1 isoform a |
| 166706862 |
|
Ppp4r1 |
|
0 |
0 |
218 |
1760 |
14319 |
|
n.v. |
n.v. |
0.12 |
0.35 |
-0.01 |
|
serine/threonine-protein phosphatase 4 regulatory subunit
1 isoform b |
| 33636709 |
|
Ppp4r2 |
|
0 |
100 |
337 |
13056 |
25853 |
|
n.v. |
0 |
0.12 |
0.12 |
-0.06 |
|
serine/threonine-protein phosphatase 4 regulatory subunit
2 |
| 199559777 |
|
Ppp5c |
|
0 |
532 |
221 |
4682 |
39657 |
|
n.v. |
0.19 |
0.31 |
0.4 |
0.15 |
|
serine/threonine-protein phosphatase 5 |
| 21312758 |
|
Ppp6c |
|
0 |
2321 |
692 |
8235 |
20230 |
|
n.v. |
-0.08 |
-0.18 |
0.03 |
-0.09 |
|
serine/threonine-protein phosphatase 6 catalytic
subunit |
| 34536815 |
|
Ppp6r1 |
|
0 |
0 |
0 |
1842 |
2570 |
|
n.v. |
n.v. |
n.v. |
0.11 |
0 |
|
serine/threonine-protein phosphatase 6 regulatory subunit
1 |
| 28076987 |
|
Ppp6r2 |
|
0 |
0 |
0 |
1842 |
0 |
|
n.v. |
n.v. |
n.v. |
0.11 |
n.v. |
|
serine/threonine-protein phosphatase 6 regulatory subunit
2 isoform 2 |
| 54145496 |
|
Ppp6r2 |
|
0 |
0 |
0 |
1842 |
0 |
|
n.v. |
n.v. |
n.v. |
0.11 |
n.v. |
|
serine/threonine-protein phosphatase 6 regulatory subunit
2 isoform 1 |
| 22726197 |
|
Ppp6r3 |
|
0 |
344 |
1302 |
23861 |
82292 |
|
n.v. |
0.39 |
0.02 |
0.21 |
0.08 |
|
serine/threonine-protein phosphatase 6 regulatory subunit
3 isoform 2 |
| 255918184 |
|
Ppp6r3 |
|
0 |
344 |
1302 |
23861 |
86094 |
|
n.v. |
0.39 |
0.02 |
0.21 |
0.08 |
|
serine/threonine-protein phosphatase 6 regulatory subunit
3 isoform 3 |
| 255918186 |
|
Ppp6r3 |
|
0 |
344 |
1302 |
23861 |
86094 |
|
n.v. |
0.39 |
0.02 |
0.21 |
0.08 |
|
serine/threonine-protein phosphatase 6 regulatory subunit
3 isoform 1 |
| 121674797 |
|
Ppt1 |
|
1464 |
8511 |
0 |
548 |
1499 |
|
0.2 |
-0.04 |
n.v. |
-0.31 |
-0.23 |
|
palmitoyl-protein thioesterase 1 precursor |
| 9506985 |
|
Ppt2 |
|
0 |
685 |
0 |
0 |
150 |
|
n.v. |
-0.1 |
n.v. |
n.v. |
-0.47 |
|
lysosomal thioesterase PPT2 precursor |
| 46195809 |
|
Pptc7 |
|
0 |
152 |
0 |
0 |
0 |
|
n.v. |
0.04 |
n.v. |
n.v. |
n.v. |
|
protein phosphatase PTC7 homolog |
| 255683299 |
|
Ppwd1 |
|
0 |
0 |
300 |
82 |
0 |
|
n.v. |
n.v. |
0.04 |
0.06 |
n.v. |
|
peptidylprolyl isomerase domain and WD repeat-containing
protein 1 |
| 238550113 |
|
Pqlc3 |
|
0 |
92 |
19 |
0 |
0 |
|
n.v. |
0.98 |
-0.27 |
n.v. |
n.v. |
|
PQ-loop repeat-containing protein 3 isoform 1
precursor |
| 238550118 |
|
Pqlc3 |
|
0 |
92 |
19 |
0 |
0 |
|
n.v. |
0.98 |
-0.27 |
n.v. |
n.v. |
|
PQ-loop repeat-containing protein 3 isoform 2
precursor |
| 254750692 |
|
Pradc1 |
|
0 |
0 |
3 |
0 |
0 |
|
n.v. |
n.v. |
-0.14 |
n.v. |
n.v. |
|
protease-associated domain-containing protein 1 isoform b
precursor |
| 20070422 |
|
Praf2 |
|
1208 |
2006 |
628 |
327 |
0 |
|
-0.32 |
-0.21 |
-0.4 |
-1 |
n.v. |
|
PRA1 family protein 2 |
| 255308896 |
|
Pram1 |
|
0 |
0 |
69 |
0 |
0 |
|
n.v. |
n.v. |
2.47 |
n.v. |
n.v. |
|
PML-RARA-regulated adapter molecule 1 |
| 188219557 |
|
Prc1 |
|
0 |
0 |
111 |
0 |
0 |
|
n.v. |
n.v. |
-0.96 |
n.v. |
n.v. |
|
protein regulator of cytokinesis 1 |
| 33469015 |
|
Prcp |
|
384 |
3649 |
217 |
0 |
5023 |
|
0.41 |
-0.17 |
-0.2 |
n.v. |
-0.14 |
|
lysosomal Pro-X carboxypeptidase precursor |
| 172073164 |
|
Prdm1 |
|
0 |
0 |
121 |
0 |
0 |
|
n.v. |
n.v. |
0.08 |
n.v. |
n.v. |
|
PR domain zinc finger protein 1 |
| 294712532 |
|
Prdm11 |
|
0 |
455 |
0 |
0 |
0 |
|
n.v. |
0.12 |
n.v. |
n.v. |
n.v. |
|
PR domain-containing protein 11 |
| 6754976 |
|
Prdx1 |
|
123163 |
159129 |
116886 |
774477 |
1194966 |
|
0.08 |
0.1 |
-0.03 |
0.13 |
-0.02 |
|
peroxiredoxin-1 |
| 148747558 |
|
Prdx2 |
|
23670 |
21825 |
45746 |
298225 |
77954 |
|
0.17 |
0.14 |
-0.01 |
0.24 |
0 |
|
peroxiredoxin-2 |
| 6680690 |
|
Prdx3 |
|
277153 |
47080 |
5531 |
1113 |
28027 |
|
0.04 |
-0.1 |
-0.41 |
-1.79 |
-0.22 |
|
thioredoxin-dependent peroxide reductase, mitochondrial
precursor |
| 7948999 |
|
Prdx4 |
|
100335 |
82968 |
41223 |
302383 |
107748 |
|
0.03 |
-0.21 |
-0.12 |
0.03 |
-0.08 |
|
peroxiredoxin-4 precursor |
| 6755114 |
|
Prdx5 |
|
248230 |
94813 |
75005 |
80710 |
165237 |
|
0.03 |
-0.04 |
-0.04 |
0.04 |
0.07 |
|
peroxiredoxin-5, mitochondrial precursor |
| 6671549 |
|
Prdx6 |
|
14279 |
35269 |
38278 |
17231 |
582104 |
|
0.3 |
0.18 |
0.08 |
0.11 |
0.14 |
|
peroxiredoxin-6 |
| 28916703 |
|
Prdx6b |
|
1501 |
22441 |
14074 |
7825 |
256825 |
|
-0.61 |
0.09 |
0.04 |
0.1 |
0 |
|
peroxiredoxin 6, related sequence 1 |
| 158749640 |
|
Preb |
|
0 |
2785 |
0 |
0 |
0 |
|
n.v. |
-0.2 |
n.v. |
n.v. |
n.v. |
|
prolactin regulatory element-binding protein |
| 6755152 |
|
Prep |
|
714 |
9354 |
14038 |
9700 |
34099 |
|
0.74 |
0.16 |
0.01 |
0.15 |
0.08 |
|
prolyl endopeptidase |
| 6679459 |
|
Prim1 |
|
0 |
637 |
707 |
20709 |
7871 |
|
n.v. |
0.14 |
0.09 |
0.08 |
0.18 |
|
DNA primase small subunit |
| 6679461 |
|
Prim2 |
|
3094 |
1025 |
1554 |
33536 |
17639 |
|
0.11 |
0.05 |
0.01 |
0.12 |
-0.2 |
|
DNA primase large subunit |
| 94681061 |
|
Prkaa1 |
|
77984 |
1989 |
10975 |
60524 |
16214 |
|
-4.1 |
-0.11 |
-0.03 |
0.07 |
0.11 |
|
5'-AMP-activated protein kinase catalytic subunit alpha-1 |
| 227452236 |
|
Prkaa2 |
|
0 |
35 |
2229 |
3978 |
14790 |
|
n.v. |
-0.12 |
-0.01 |
0.12 |
-0.14 |
|
5'-AMP-activated protein kinase catalytic subunit alpha-2 |
| 23956234 |
|
Prkab1 |
|
0 |
977 |
2104 |
8366 |
4830 |
|
n.v. |
0.22 |
-0.09 |
0.3 |
0.1 |
|
5'-AMP-activated protein kinase subunit beta-1 |
| 72384347 |
|
Prkab2 |
|
0 |
0 |
1092 |
3405 |
4059 |
|
n.v. |
n.v. |
-0.09 |
0.28 |
0.16 |
|
5'-AMP-activated protein kinase subunit beta-2 |
| 483968030 |
|
Prkaca |
|
15157 |
0 |
515 |
0 |
0 |
|
-0.02 |
n.v. |
0.11 |
n.v. |
n.v. |
|
cAMP-dependent protein kinase catalytic subunit alpha
isoform 2 |
| 7110693 |
|
Prkaca |
|
16768 |
756 |
3007 |
59124 |
54940 |
|
-0.02 |
0.13 |
0.02 |
-0.14 |
-0.05 |
|
cAMP-dependent protein kinase catalytic subunit alpha
isoform 1 |
| 255958156 |
|
Prkacb |
|
2599 |
19 |
2521 |
32366 |
31422 |
|
0.01 |
0.32 |
0.25 |
-0.17 |
0.03 |
|
cAMP-dependent protein kinase catalytic subunit beta
isoform 4 |
| 255958318 |
|
Prkacb |
|
2599 |
19 |
2521 |
32366 |
31422 |
|
0.01 |
0.32 |
0.25 |
-0.17 |
0.03 |
|
cAMP-dependent protein kinase catalytic subunit beta
isoform 2 |
| 255958320 |
|
Prkacb |
|
2599 |
19 |
2521 |
32366 |
31422 |
|
0.01 |
0.32 |
0.25 |
-0.17 |
0.03 |
|
cAMP-dependent protein kinase catalytic subunit beta
isoform 3 |
| 6755076 |
|
Prkacb |
|
2599 |
19 |
2521 |
32366 |
31422 |
|
0.01 |
0.32 |
0.25 |
-0.17 |
0.03 |
|
cAMP-dependent protein kinase catalytic subunit beta
isoform 1 |
| 124107596 |
|
Prkag1 |
|
5272 |
5839 |
8391 |
40117 |
41639 |
|
-0.23 |
0.08 |
-0.05 |
0.05 |
0.11 |
|
5'-AMP-activated protein kinase subunit gamma-1 |
| 282847325 |
|
Prkag2 |
|
0 |
484 |
2988 |
3487 |
5837 |
|
n.v. |
-0.01 |
-0.09 |
-0.48 |
0.03 |
|
5'-AMP-activated protein kinase subunit gamma-2 isoform
1 |
| 282847327 |
|
Prkag2 |
|
0 |
484 |
2988 |
3487 |
5837 |
|
n.v. |
-0.01 |
-0.09 |
-0.48 |
0.03 |
|
5'-AMP-activated protein kinase subunit gamma-2 isoform
2 |
| 282847331 |
|
Prkag2 |
|
0 |
484 |
2988 |
3487 |
5837 |
|
n.v. |
-0.01 |
-0.09 |
-0.48 |
0.03 |
|
5'-AMP-activated protein kinase subunit gamma-2 isoform
3 |
| 30794476 |
|
Prkar1a |
|
0 |
678 |
1708 |
4993 |
29269 |
|
n.v. |
-0.64 |
-0.3 |
0.35 |
-0.02 |
|
cAMP-dependent protein kinase type I-alpha regulatory
subunit |
| 359751382;254675178 |
|
Prkar1b |
|
0 |
0 |
771 |
1801 |
2495 |
|
n.v. |
n.v. |
-0.3 |
0.37 |
0.01 |
|
cAMP-dependent protein kinase type I-beta regulatory
subunit |
| 22550094 |
|
Prkar2a |
|
0 |
3058 |
4708 |
15430 |
20209 |
|
n.v. |
0.33 |
0.04 |
0.19 |
0.11 |
|
cAMP-dependent protein kinase type II-alpha regulatory
subunit |
| 45598396 |
|
Prkar2b |
|
7670 |
8310 |
9335 |
46134 |
49446 |
|
0.27 |
0.02 |
0.05 |
0.03 |
-0.06 |
|
cAMP-dependent protein kinase type II-beta regulatory
subunit |
| 164663791 |
|
Prkca |
|
0 |
536 |
342 |
0 |
0 |
|
n.v. |
-0.01 |
0.22 |
n.v. |
n.v. |
|
protein kinase C alpha type |
| 6679345 |
|
Prkcb |
|
0 |
127 |
294 |
0 |
0 |
|
n.v. |
0 |
0.07 |
n.v. |
n.v. |
|
protein kinase C beta type |
| 6755082 |
|
Prkcd |
|
1098 |
2332 |
6485 |
6172 |
150 |
|
-0.1 |
0.14 |
0.04 |
0.14 |
2.21 |
|
protein kinase C delta type |
| 6755084 |
|
Prkce |
|
0 |
0 |
751 |
0 |
0 |
|
n.v. |
n.v. |
0.08 |
n.v. |
n.v. |
|
protein kinase C epsilon type |
| 6755080 |
|
Prkcg |
|
0 |
0 |
0 |
1040 |
0 |
|
n.v. |
n.v. |
n.v. |
0.44 |
n.v. |
|
protein kinase C gamma type |
| 31543511 |
|
Prkch |
|
0 |
0 |
294 |
0 |
0 |
|
n.v. |
n.v. |
0.07 |
n.v. |
n.v. |
|
protein kinase C eta type |
| 133778989 |
|
Prkci |
|
2746 |
2586 |
7239 |
83239 |
1564 |
|
-0.01 |
0.25 |
0.01 |
0.09 |
0.52 |
|
protein kinase C iota type |
| 6679353 |
|
Prkcq |
|
0 |
0 |
294 |
0 |
0 |
|
n.v. |
n.v. |
0.07 |
n.v. |
n.v. |
|
protein kinase C theta type |
| 6679465 |
|
Prkcsh |
|
186136 |
7127 |
21348 |
1285 |
47229 |
|
0.08 |
-0.11 |
-0.29 |
-0.36 |
-0.4 |
|
glucosidase 2 subunit beta precursor |
| 84872200 |
|
Prkcz |
|
0 |
0 |
746 |
0 |
0 |
|
n.v. |
n.v. |
0.09 |
n.v. |
n.v. |
|
protein kinase C zeta type isoform a |
| 84872205 |
|
Prkcz |
|
0 |
0 |
739 |
0 |
0 |
|
n.v. |
n.v. |
0.09 |
n.v. |
n.v. |
|
protein kinase C zeta type isoform b |
| 356995870;30725754 |
|
Prkd2 |
|
0 |
0 |
1652 |
0 |
0 |
|
n.v. |
n.v. |
0.06 |
n.v. |
n.v. |
|
serine/threonine-protein kinase D2 |
| 30725754 |
|
Prkd2 |
|
13327 |
0 |
0 |
3749 |
0 |
|
-0.07 |
n.v. |
n.v. |
0.16 |
n.v. |
|
serine/threonine-protein kinase D2 |
| 124517706 |
|
Prkdc |
|
0 |
104 |
331 |
22306 |
0 |
|
n.v. |
0.22 |
0.24 |
0.15 |
n.v. |
|
DNA-dependent protein kinase catalytic subunit |
| 6755162 |
|
Prkra |
|
4503 |
2062 |
28406 |
35468 |
4948 |
|
-0.03 |
0.28 |
0.12 |
0.02 |
-0.1 |
|
interferon-inducible double stranded RNA-dependent
protein kinase activator A |
| 357197160 |
|
Prmt1 |
|
0 |
4296 |
13290 |
117422 |
127486 |
|
n.v. |
0.31 |
0.1 |
0.15 |
0.03 |
|
protein arginine N-methyltransferase 1 isoform 3 |
| 357197158 |
|
Prmt1 |
|
2142 |
9674 |
20176 |
171930 |
157387 |
|
0.27 |
0.34 |
0.11 |
0.19 |
0.03 |
|
protein arginine N-methyltransferase 1 isoform 2 |
| 9790109 |
|
Prmt1 |
|
2142 |
9674 |
20176 |
171930 |
157387 |
|
0.27 |
0.34 |
0.11 |
0.19 |
0.03 |
|
protein arginine N-methyltransferase 1 isoform 1 |
| 117938280 |
|
Prmt2 |
|
3661 |
0 |
2919 |
5984 |
0 |
|
0.14 |
n.v. |
0.04 |
0 |
n.v. |
|
protein arginine N-methyltransferase 2 |
| 29789323 |
|
Prmt3 |
|
0 |
0 |
63 |
0 |
1478 |
|
n.v. |
n.v. |
0.18 |
n.v. |
0.26 |
|
protein arginine N-methyltransferase 3 |
| 188528624 |
|
Prmt5 |
|
0 |
6148 |
6112 |
110219 |
14576 |
|
n.v. |
-0.03 |
-0.05 |
0.06 |
-0.15 |
|
protein arginine N-methyltransferase 5 |
| 126432554 |
|
Prmt6 |
|
0 |
0 |
0 |
205 |
1960 |
|
n.v. |
n.v. |
n.v. |
0.1 |
0.63 |
|
protein arginine N-methyltransferase 6 |
| 21703808 |
|
Prmt7 |
|
0 |
0 |
0 |
0 |
632 |
|
n.v. |
n.v. |
n.v. |
n.v. |
0.3 |
|
protein arginine N-methyltransferase 7 |
| 357527369 |
|
Prmt8 |
|
0 |
0 |
4068 |
45708 |
44241 |
|
n.v. |
n.v. |
0.21 |
0.14 |
0.1 |
|
protein arginine N-methyltransferase 8 |
| 118601004 |
|
Prodh |
|
7780 |
13153 |
0 |
0 |
0 |
|
0.31 |
-0.1 |
n.v. |
n.v. |
n.v. |
|
proline dehydrogenase 1, mitochondrial precursor |
| 254675296 |
|
Prom1 |
|
0 |
384 |
2461 |
5722 |
0 |
|
n.v. |
0.1 |
-0.22 |
-0.25 |
n.v. |
|
prominin-1 isoform s1 precursor |
| 254675298 |
|
Prom1 |
|
0 |
384 |
2461 |
5722 |
0 |
|
n.v. |
0.1 |
-0.22 |
-0.25 |
n.v. |
|
prominin-1 isoform s2 precursor |
| 254675304 |
|
Prom1 |
|
0 |
384 |
2461 |
5722 |
0 |
|
n.v. |
0.1 |
-0.22 |
-0.25 |
n.v. |
|
prominin-1 isoform s3 precursor |
| 254675312 |
|
Prom1 |
|
0 |
384 |
2461 |
5722 |
0 |
|
n.v. |
0.1 |
-0.22 |
-0.25 |
n.v. |
|
prominin-1 isoform s4 |
| 254675314 |
|
Prom1 |
|
0 |
384 |
2461 |
5722 |
0 |
|
n.v. |
0.1 |
-0.22 |
-0.25 |
n.v. |
|
prominin-1 isoform s5 |
| 254675316 |
|
Prom1 |
|
0 |
384 |
2461 |
5722 |
0 |
|
n.v. |
0.1 |
-0.22 |
-0.25 |
n.v. |
|
prominin-1 isoform s6 precursor |
| 254675318 |
|
Prom1 |
|
0 |
384 |
2461 |
5722 |
0 |
|
n.v. |
0.1 |
-0.22 |
-0.25 |
n.v. |
|
prominin-1 isoform s7 precursor |
| 254675320 |
|
Prom1 |
|
0 |
384 |
2461 |
5722 |
0 |
|
n.v. |
0.1 |
-0.22 |
-0.25 |
n.v. |
|
prominin-1 isoform s8 precursor |
| 224994182 |
|
Prom2 |
|
458 |
653 |
3976 |
0 |
0 |
|
0.14 |
-0.08 |
-0.23 |
n.v. |
n.v. |
|
prominin-2 isoform 1 precursor |
| 224994184 |
|
Prom2 |
|
458 |
653 |
3976 |
0 |
0 |
|
0.14 |
-0.08 |
-0.23 |
n.v. |
n.v. |
|
prominin-2 isoform 2 precursor |
| 254540216 |
|
Prorsd1 |
|
0 |
0 |
0 |
0 |
1906 |
|
n.v. |
n.v. |
n.v. |
n.v. |
0.09 |
|
prolyl-tRNA synthetase associated domain-containing
protein 1 isoform 1 |
| 21312706 |
|
Prorsd1 |
|
0 |
29 |
72 |
0 |
8289 |
|
n.v. |
0.65 |
0.07 |
n.v. |
0.29 |
|
prolyl-tRNA synthetase associated domain-containing
protein 1 isoform 2 |
| 84872187 |
|
Prosc |
|
0 |
299 |
0 |
0 |
26238 |
|
n.v. |
0.25 |
n.v. |
n.v. |
-0.11 |
|
proline synthase co-transcribed bacterial homolog protein
isoform c |
| 16930823 |
|
Prosc |
|
458 |
553 |
0 |
0 |
53954 |
|
0.64 |
0.36 |
n.v. |
n.v. |
0.04 |
|
proline synthase co-transcribed bacterial homolog protein
isoform a |
| 84872182 |
|
Prosc |
|
458 |
553 |
0 |
0 |
38169 |
|
0.64 |
0.36 |
n.v. |
n.v. |
0.05 |
|
proline synthase co-transcribed bacterial homolog protein
isoform b |
| 110625904 |
|
Proser2 |
|
0 |
0 |
658 |
0 |
568 |
|
n.v. |
n.v. |
0.06 |
n.v. |
0.77 |
|
proline and serine-rich protein 2 |
| 40254503 |
|
Prpf18 |
|
0 |
0 |
0 |
25 |
0 |
|
n.v. |
n.v. |
n.v. |
-0.18 |
n.v. |
|
pre-mRNA-splicing factor 18 |
| 19527358 |
|
Prpf19 |
|
113552 |
7667 |
29007 |
84655 |
28894 |
|
-0.03 |
-0.05 |
0 |
-0.06 |
-0.1 |
|
pre-mRNA-processing factor 19 isoform 2 |
| 359718917 |
|
Prpf19 |
|
113040 |
7667 |
29007 |
82134 |
28894 |
|
-0.03 |
-0.05 |
0 |
-0.05 |
-0.1 |
|
pre-mRNA-processing factor 19 isoform 1 |
| 359718922 |
|
Prpf19 |
|
110458 |
7667 |
29007 |
78295 |
28894 |
|
-0.01 |
-0.05 |
0 |
-0.05 |
-0.1 |
|
pre-mRNA-processing factor 19 isoform 3 |
| 31980657 |
|
Prpf3 |
|
9171 |
0 |
3837 |
31015 |
0 |
|
-0.22 |
n.v. |
0.04 |
0.1 |
n.v. |
|
U4/U6 small nuclear ribonucleoprotein Prp3 |
| 228480236 |
|
Prpf31 |
|
0 |
528 |
1384 |
7850 |
0 |
|
n.v. |
0.28 |
0.2 |
0.11 |
n.v. |
|
U4/U6 small nuclear ribonucleoprotein Prp31 isoform
1 |
| 228480238 |
|
Prpf31 |
|
0 |
528 |
1384 |
7850 |
0 |
|
n.v. |
0.28 |
0.2 |
0.11 |
n.v. |
|
U4/U6 small nuclear ribonucleoprotein Prp31 isoform
2 |
| 227497256 |
|
Prpf38a |
|
0 |
372 |
170 |
0 |
0 |
|
n.v. |
0.21 |
0.12 |
n.v. |
n.v. |
|
pre-mRNA-splicing factor 38A |
| 30794464 |
|
Prpf38b |
|
0 |
2968 |
658 |
0 |
0 |
|
n.v. |
-0.12 |
-0.11 |
n.v. |
n.v. |
|
pre-mRNA-splicing factor 38B |
| 156546892 |
|
Prpf39 |
|
0 |
0 |
0 |
0 |
10710 |
|
n.v. |
n.v. |
n.v. |
n.v. |
0.09 |
|
pre-mRNA-processing factor 39 |
| 55925589 |
|
Prpf4 |
|
13254 |
2353 |
1643 |
47902 |
0 |
|
-0.38 |
-0.23 |
0.1 |
0.07 |
n.v. |
|
U4/U6 small nuclear ribonucleoprotein Prp4 |
| 9055218 |
|
Prpf40a |
|
6370 |
5668 |
742 |
2030 |
0 |
|
0.04 |
-0.05 |
0.03 |
-0.05 |
n.v. |
|
pre-mRNA-processing factor 40 homolog A |
| 9055244 |
|
Prpf40b |
|
0 |
50 |
0 |
0 |
0 |
|
n.v. |
0.17 |
n.v. |
n.v. |
n.v. |
|
pre-mRNA-processing factor 40 homolog B |
| 158854005 |
|
Prpf4b |
|
0 |
0 |
189 |
65 |
0 |
|
n.v. |
n.v. |
-0.46 |
0.11 |
n.v. |
|
serine/threonine-protein kinase PRP4 homolog |
| 21539655 |
|
Prpf6 |
|
3698 |
10 |
7805 |
7809 |
0 |
|
0.65 |
-0.01 |
0.09 |
-0.11 |
n.v. |
|
pre-mRNA-processing factor 6 |
| 115583687 |
|
Prpf8 |
|
77087 |
10310 |
19786 |
60238 |
0 |
|
-0.04 |
0.07 |
0.05 |
-0.03 |
n.v. |
|
pre-mRNA-processing-splicing factor 8 |
| 254675335 |
|
Prph |
|
715600 |
0 |
2644 |
0 |
0 |
|
0.01 |
n.v. |
-0.44 |
n.v. |
n.v. |
|
peripherin isoform 1 |
| 254675337 |
|
Prph |
|
715600 |
0 |
2644 |
0 |
0 |
|
0.01 |
n.v. |
-0.44 |
n.v. |
n.v. |
|
peripherin isoform 2 |
| 254675339 |
|
Prph |
|
715600 |
0 |
2644 |
0 |
0 |
|
0.01 |
n.v. |
-0.44 |
n.v. |
n.v. |
|
peripherin isoform 3 |
| 10946854 |
|
Prps1 |
|
275 |
5010 |
4781 |
391532 |
14726 |
|
-0.16 |
0.13 |
0.05 |
0.09 |
-0.06 |
|
ribose-phosphate pyrophosphokinase 1 |
| 30794182 |
|
Prps1l1 |
|
275 |
2720 |
2496 |
291079 |
6297 |
|
-0.16 |
0.11 |
0.03 |
0.08 |
-0.03 |
|
phosphoribosyl pyrophosphate synthetase 1-like 1 |
| 256418956 |
|
Prps1l3 |
|
275 |
5010 |
4781 |
510525 |
14726 |
|
-0.16 |
0.13 |
0.05 |
0.09 |
-0.06 |
|
ribose-phosphate pyrophosphokinase |
| 13386146 |
|
Prps2 |
|
0 |
5213 |
3093 |
458490 |
16407 |
|
n.v. |
0.16 |
0.08 |
0.12 |
-0.07 |
|
ribose-phosphate pyrophosphokinase 2 |
| 254540089 |
|
Prpsap1 |
|
0 |
493 |
1566 |
149829 |
1896 |
|
n.v. |
0.1 |
0.11 |
0.13 |
0.35 |
|
phosphoribosyl pyrophosphate synthase-associated protein
1 |
| 21450169 |
|
Prpsap2 |
|
0 |
0 |
654 |
209223 |
2474 |
|
n.v. |
n.v. |
-0.05 |
0.1 |
-0.29 |
|
phosphoribosyl pyrophosphate synthase-associated protein
2 isoform a |
| 256773295 |
|
Prpsap2 |
|
0 |
0 |
281 |
172912 |
1596 |
|
n.v. |
n.v. |
-0.05 |
0.1 |
-0.29 |
|
phosphoribosyl pyrophosphate synthase-associated protein
2 isoform b |
| 110625811 |
|
Prrc1 |
|
0 |
639 |
29 |
0 |
2120 |
|
n.v. |
0.29 |
0.18 |
n.v. |
0.23 |
|
protein PRRC1 |
| 312261233 |
|
Prrc2a |
|
0 |
0 |
2110 |
0 |
0 |
|
n.v. |
n.v. |
0.24 |
n.v. |
n.v. |
|
protein PRRC2A isoform 2 |
| 92110037 |
|
Prrc2a |
|
0 |
0 |
2110 |
0 |
0 |
|
n.v. |
n.v. |
0.24 |
n.v. |
n.v. |
|
protein PRRC2A isoform 1 |
| 227500365 |
|
Prrc2b |
|
0 |
0 |
91 |
0 |
0 |
|
n.v. |
n.v. |
0.36 |
n.v. |
n.v. |
|
protein PRRC2B isoform 1 |
| 34328385 |
|
Prrc2b |
|
0 |
0 |
91 |
0 |
0 |
|
n.v. |
n.v. |
0.36 |
n.v. |
n.v. |
|
protein PRRC2B isoform 2 |
| 124486835 |
|
Prrc2c |
|
0 |
211 |
7611 |
2292 |
0 |
|
n.v. |
0.04 |
0.36 |
0.41 |
n.v. |
|
protein PRRC2C |
| 16716569 |
|
Prss1 |
|
1757 |
294 |
4064 |
0 |
0 |
|
-4.21 |
-3.02 |
-5.28 |
n.v. |
n.v. |
|
protease, serine, 1 precursor |
| 19111160 |
|
Prss8 |
|
0 |
0 |
389 |
0 |
0 |
|
n.v. |
n.v. |
-0.04 |
n.v. |
n.v. |
|
prostasin precursor |
| 27597069 |
|
Prune |
|
0 |
635 |
1497 |
819 |
55432 |
|
n.v. |
-0.1 |
-0.11 |
0.2 |
0.11 |
|
protein prune homolog |
| 225735645 |
|
Psap |
|
1699018 |
171546 |
151723 |
35632 |
306238 |
|
-0.02 |
-0.18 |
-0.34 |
-0.33 |
-0.28 |
|
sulfated glycoprotein 1 isoform B preproprotein |
| 225735649 |
|
Psap |
|
1699018 |
171546 |
151723 |
40789 |
306238 |
|
-0.02 |
-0.18 |
-0.34 |
-0.3 |
-0.28 |
|
sulfated glycoprotein 1 isoform A preproprotein |
| 225735651 |
|
Psap |
|
1699018 |
171546 |
151723 |
40789 |
306238 |
|
-0.02 |
-0.18 |
-0.34 |
-0.3 |
-0.28 |
|
sulfated glycoprotein 1 isoform C preproprotein |
| 225735653 |
|
Psap |
|
1699018 |
171546 |
151723 |
40789 |
306238 |
|
-0.02 |
-0.18 |
-0.34 |
-0.3 |
-0.28 |
|
sulfated glycoprotein 1 isoform D preproprotein |
| 225735655 |
|
Psap |
|
1699018 |
171546 |
151723 |
40789 |
306238 |
|
-0.02 |
-0.18 |
-0.34 |
-0.3 |
-0.28 |
|
sulfated glycoprotein 1 isoform E preproprotein |
| 225735657 |
|
Psap |
|
1699018 |
171546 |
151723 |
40789 |
306238 |
|
-0.02 |
-0.18 |
-0.34 |
-0.3 |
-0.28 |
|
sulfated glycoprotein 1 isoform F preproprotein |
| 329299029 |
|
Psat1 |
|
34489 |
5540 |
62768 |
74849 |
507331 |
|
0.07 |
-0.09 |
-0.01 |
0.1 |
0.04 |
|
phosphoserine aminotransferase isoform 2 |
| 54292132 |
|
Psat1 |
|
34489 |
8112 |
66872 |
81127 |
662886 |
|
0.07 |
-0.04 |
-0.01 |
0.16 |
0.05 |
|
phosphoserine aminotransferase isoform 1 |
| 6679493 |
|
Psen1 |
|
0 |
0 |
2166 |
90 |
0 |
|
n.v. |
n.v. |
0 |
-0.93 |
n.v. |
|
presenilin-1 |
| 190684663;190684661 |
|
Psen2 |
|
0 |
0 |
1924 |
0 |
0 |
|
n.v. |
n.v. |
0.01 |
n.v. |
n.v. |
|
presenilin-2 |
| 13384922 |
|
Psenen |
|
0 |
664 |
322 |
0 |
0 |
|
n.v. |
-0.33 |
-0.13 |
n.v. |
n.v. |
|
gamma-secretase subunit PEN-2 |
| 19527168 |
|
Psip1 |
|
2599 |
1401 |
2665 |
23558 |
8096 |
|
-0.02 |
0.06 |
-0.02 |
-0.14 |
0.08 |
|
PC4 and SFRS1-interacting protein |
| 33563282 |
|
Psma1 |
|
5675 |
9152 |
11591 |
593347 |
16161 |
|
0.39 |
0.08 |
-0.01 |
0.03 |
-0.16 |
|
proteasome subunit alpha type-1 |
| 134031994 |
|
Psma2 |
|
3881 |
4981 |
6832 |
72197 |
3534 |
|
0.14 |
0.07 |
-0.03 |
0.03 |
-0.16 |
|
proteasome subunit alpha type-2 |
| 261824000 |
|
Psma3 |
|
13345 |
5062 |
13313 |
254285 |
72032 |
|
0.19 |
-0.01 |
0.05 |
0.02 |
-0.22 |
|
proteasome subunit alpha type-3 |
| 6755196 |
|
Psma4 |
|
1190 |
7102 |
13710 |
260931 |
12841 |
|
0.05 |
0.08 |
0 |
-0.04 |
-0.14 |
|
proteasome subunit alpha type-4 |
| 7106387 |
|
Psma5 |
|
2069 |
10154 |
13995 |
242121 |
43598 |
|
0.11 |
0.11 |
0.02 |
-0.02 |
-0.17 |
|
proteasome subunit alpha type-5 |
| 6755198 |
|
Psma6 |
|
56291 |
17525 |
29964 |
477914 |
55957 |
|
-0.1 |
0.1 |
-0.04 |
-0.06 |
-0.18 |
|
proteasome subunit alpha type-6 |
| 7106389 |
|
Psma7 |
|
16311 |
8507 |
23938 |
444206 |
36691 |
|
0.12 |
0.04 |
-0.01 |
-0.02 |
-0.13 |
|
proteasome subunit alpha type-7 |
| 254692831 |
|
Psma8 |
|
11148 |
3165 |
14046 |
41501 |
7507 |
|
-0.02 |
0.01 |
-0.04 |
-0.17 |
-0.13 |
|
proteasome subunit alpha type-7-like |
| 7242197 |
|
Psmb1 |
|
7048 |
3313 |
11734 |
256069 |
30404 |
|
0.12 |
-0.27 |
-0.07 |
-0.05 |
-0.35 |
|
proteasome subunit beta type-1 precursor |
| 227116345 |
|
Psmb2 |
|
10855 |
7133 |
15993 |
129373 |
19620 |
|
0.06 |
0.11 |
-0.04 |
0.04 |
-0.28 |
|
proteasome subunit beta type-2 |
| 6755202 |
|
Psmb3 |
|
23120 |
4722 |
5502 |
135987 |
10581 |
|
0.11 |
-0.06 |
0.05 |
-0.02 |
-0.26 |
|
proteasome subunit beta type-3 |
| 254540082 |
|
Psmb4 |
|
0 |
480 |
2845 |
117275 |
9928 |
|
n.v. |
-0.14 |
-0.06 |
-0.01 |
-0.16 |
|
proteasome subunit beta type-4 precursor |
| 6755204 |
|
Psmb5 |
|
35422 |
10321 |
44040 |
500613 |
45055 |
|
0.14 |
-0.04 |
-0.07 |
-0.01 |
-0.24 |
|
proteasome subunit beta type-5 |
| 238231384 |
|
Psmb6 |
|
58250 |
6455 |
20936 |
249070 |
35084 |
|
0.1 |
0.07 |
-0.02 |
0 |
-0.29 |
|
proteasome subunit beta type-6 precursor |
| 6755206 |
|
Psmb7 |
|
0 |
357 |
3177 |
88862 |
386 |
|
n.v. |
0.45 |
0.12 |
0.24 |
0.24 |
|
proteasome subunit beta type-7 precursor |
| 158303322 |
|
Psmb8 |
|
0 |
184 |
0 |
0 |
0 |
|
n.v. |
0.03 |
n.v. |
n.v. |
n.v. |
|
proteasome subunit beta type-8 precursor |
| 6679501 |
|
Psmc1 |
|
2874 |
7135 |
22943 |
312598 |
16000 |
|
0.32 |
0.09 |
0.03 |
0.05 |
-0.09 |
|
26S protease regulatory subunit 4 |
| 33859604 |
|
Psmc2 |
|
0 |
10260 |
21623 |
403802 |
45922 |
|
n.v. |
0.05 |
0.01 |
0.01 |
-0.16 |
|
26S protease regulatory subunit 7 |
| 228008337 |
|
Psmc3 |
|
7743 |
2136 |
9349 |
480353 |
16503 |
|
0.22 |
0.06 |
0.01 |
0.08 |
-0.02 |
|
26S protease regulatory subunit 6A |
| 124248577 |
|
Psmc4 |
|
860 |
2148 |
7917 |
130691 |
471 |
|
0.04 |
-0.06 |
0.01 |
0.11 |
-0.29 |
|
26S protease regulatory subunit 6B |
| 7110703 |
|
Psmc5 |
|
20301 |
8319 |
11351 |
245362 |
26902 |
|
-0.49 |
0.1 |
-0.03 |
0.11 |
-0.21 |
|
26S protease regulatory subunit 8 |
| 27754103 |
|
Psmc6 |
|
9263 |
1925 |
9156 |
412004 |
21805 |
|
0.02 |
-0.2 |
0.06 |
0.06 |
-0.32 |
|
26S protease regulatory subunit 10B |
| 74315975 |
|
Psmd1 |
|
4778 |
40 |
19074 |
532864 |
27995 |
|
0.04 |
0.29 |
0.03 |
0.05 |
-0.11 |
|
26S proteasome non-ATPase regulatory subunit 1 |
| 255958245 |
|
Psmd10 |
|
0 |
188 |
4 |
1244 |
0 |
|
n.v. |
0.63 |
0.36 |
0.05 |
n.v. |
|
26S proteasome non-ATPase regulatory subunit 10 isoform 2 |
| 31980811 |
|
Psmd10 |
|
0 |
188 |
120 |
6892 |
1692 |
|
n.v. |
0.63 |
0.27 |
0.09 |
0.01 |
|
26S proteasome non-ATPase regulatory subunit 10 isoform 1 |
| 134053905 |
|
Psmd11 |
|
0 |
14120 |
20623 |
348738 |
38008 |
|
n.v. |
0.02 |
0.03 |
-0.01 |
-0.29 |
|
26S proteasome non-ATPase regulatory subunit 11 |
| 13385384 |
|
Psmd12 |
|
366 |
11878 |
14579 |
273488 |
26859 |
|
0.37 |
0.07 |
-0.03 |
0.03 |
-0.1 |
|
26S proteasome non-ATPase regulatory subunit 12 |
| 6755210 |
|
Psmd13 |
|
0 |
48 |
13568 |
408230 |
31293 |
|
n.v. |
0.16 |
0.01 |
0.04 |
-0.04 |
|
26S proteasome non-ATPase regulatory subunit 13 |
| 145966883 |
|
Psmd14 |
|
1300 |
923 |
4405 |
58429 |
0 |
|
0.15 |
0.44 |
0.05 |
0.06 |
n.v. |
|
26S proteasome non-ATPase regulatory subunit 14 |
| 19882201 |
|
Psmd2 |
|
5107 |
1866 |
21820 |
493008 |
16268 |
|
0.36 |
0.21 |
0.04 |
0.05 |
-0.06 |
|
26S proteasome non-ATPase regulatory subunit 2 |
| 19705424 |
|
Psmd3 |
|
5437 |
286 |
25769 |
704875 |
7165 |
|
0.36 |
-0.25 |
0.04 |
0.08 |
-0.07 |
|
26S proteasome non-ATPase regulatory subunit 3 |
| 6679505 |
|
Psmd4 |
|
0 |
2156 |
5906 |
134268 |
38961 |
|
n.v. |
0.16 |
0.06 |
0.04 |
-0.13 |
|
26S proteasome non-ATPase regulatory subunit 4 |
| 134053913 |
|
Psmd5 |
|
0 |
4889 |
12548 |
247744 |
36734 |
|
n.v. |
0.29 |
0.07 |
0.07 |
0.16 |
|
26S proteasome non-ATPase regulatory subunit 5 |
| 46049022 |
|
Psmd6 |
|
5016 |
9062 |
17447 |
425748 |
10913 |
|
0.02 |
0.2 |
0.02 |
0.05 |
0.12 |
|
26S proteasome non-ATPase regulatory subunit 6 |
| 6754724 |
|
Psmd7 |
|
1062 |
4678 |
7224 |
189733 |
9735 |
|
0.06 |
0 |
0.02 |
0.01 |
-0.16 |
|
26S proteasome non-ATPase regulatory subunit 7 |
| 156713423 |
|
Psmd8 |
|
0 |
0 |
1844 |
228737 |
4798 |
|
n.v. |
n.v. |
-0.07 |
0.1 |
0.11 |
|
26S proteasome non-ATPase regulatory subunit 8 |
| 119508441 |
|
Psmd9 |
|
0 |
0 |
0 |
10993 |
43341 |
|
n.v. |
n.v. |
n.v. |
0.05 |
0.14 |
|
26S proteasome non-ATPase regulatory subunit 9 |
| 6755212 |
|
Psme1 |
|
915 |
19660 |
14184 |
143992 |
181098 |
|
0.34 |
0.33 |
0 |
0.14 |
-0.01 |
|
proteasome activator complex subunit 1 |
| 20137004 |
|
Psme2 |
|
0 |
6244 |
9513 |
82068 |
70758 |
|
n.v. |
-0.1 |
-0.07 |
0.16 |
-0.06 |
|
proteasome activator complex subunit 2 isoform 1 |
| 71725358 |
|
Psme2 |
|
55 |
6244 |
9513 |
82068 |
70758 |
|
0.22 |
-0.1 |
-0.07 |
0.16 |
-0.06 |
|
proteasome activator complex subunit 2 isoform 2 |
| 527317390 |
|
Psme2b |
|
55 |
0 |
0 |
0 |
0 |
|
0.22 |
n.v. |
n.v. |
n.v. |
n.v. |
|
protease (prosome, macropain) 28 subunit beta B |
| 6755214 |
|
Psme3 |
|
0 |
2933 |
1759 |
17010 |
29001 |
|
n.v. |
0.21 |
-0.04 |
-0.08 |
0.07 |
|
proteasome activator complex subunit 3 |
| 117956381 |
|
Psme4 |
|
0 |
0 |
7 |
7989 |
0 |
|
n.v. |
n.v. |
0.06 |
0.12 |
n.v. |
|
proteasome activator complex subunit 4 |
| 47078287 |
|
Psmf1 |
|
0 |
983 |
0 |
0 |
5730 |
|
n.v. |
0.2 |
n.v. |
n.v. |
0.13 |
|
proteasome inhibitor PI31 subunit |
| 9506555 |
|
Psmg1 |
|
0 |
785 |
243 |
9143 |
8386 |
|
n.v. |
0.35 |
0.06 |
0.04 |
-0.11 |
|
proteasome assembly chaperone 1 |
| 19527372 |
|
Psmg2 |
|
0 |
92 |
0 |
6950 |
1189 |
|
n.v. |
0.44 |
n.v. |
0.05 |
-0.05 |
|
proteasome assembly chaperone 2 |
| 21313432 |
|
Psmg3 |
|
0 |
0 |
42 |
999 |
3395 |
|
n.v. |
n.v. |
0.18 |
0.14 |
0.04 |
|
proteasome assembly chaperone 3 |
| 160333436 |
|
Psmg4 |
|
0 |
0 |
0 |
0 |
1863 |
|
n.v. |
n.v. |
n.v. |
n.v. |
0.29 |
|
proteasome assembly chaperone 4 isoform a |
| 160333430 |
|
Psmg4 |
|
0 |
0 |
0 |
1424 |
1992 |
|
n.v. |
n.v. |
n.v. |
0.07 |
0.29 |
|
proteasome assembly chaperone 4 isoform b |
| 225543409 |
|
Pspc1 |
|
111978 |
645 |
3442 |
2014 |
0 |
|
-0.04 |
0.53 |
-0.27 |
-0.47 |
n.v. |
|
paraspeckle component 1 |
| 19527116 |
|
Psph |
|
0 |
0 |
209 |
0 |
6983 |
|
n.v. |
n.v. |
0.61 |
n.v. |
0.13 |
|
phosphoserine phosphatase |
| 171184423 |
|
Pstpip1 |
|
0 |
0 |
133 |
0 |
0 |
|
n.v. |
n.v. |
0.01 |
n.v. |
n.v. |
|
proline-serine-threonine phosphatase-interacting protein
1 |
| 258613904 |
|
Ptar1 |
|
0 |
1265 |
0 |
0 |
7336 |
|
n.v. |
-0.03 |
n.v. |
n.v. |
0.1 |
|
protein prenyltransferase alpha subunit repeat containing
1 |
| 545688433 |
|
Ptbp1 |
|
435207 |
0 |
0 |
0 |
0 |
|
-0.02 |
n.v. |
n.v. |
n.v. |
n.v. |
|
polypyrimidine tract-binding protein 1 isoform 3 |
| 116517301 |
|
Ptbp1 |
|
492725 |
26597 |
168599 |
242522 |
386 |
|
-0.01 |
0.11 |
-0.07 |
-0.12 |
0.08 |
|
polypyrimidine tract-binding protein 1 isoform 1 |
| 116517303 |
|
Ptbp1 |
|
492725 |
26597 |
168599 |
242424 |
386 |
|
-0.01 |
0.11 |
-0.07 |
-0.12 |
0.08 |
|
polypyrimidine tract-binding protein 1 isoform 2 |
| 9507003 |
|
Ptbp2 |
|
40804 |
2860 |
70011 |
73433 |
0 |
|
-0.11 |
-0.47 |
-0.11 |
-0.26 |
n.v. |
|
polypyrimidine tract-binding protein 2 |
| 255003709 |
|
Ptbp3 |
|
41079 |
6532 |
131201 |
92882 |
0 |
|
-0.09 |
0.16 |
-0.01 |
-0.06 |
n.v. |
|
polypyrimidine tract-binding protein 3 isoform 1 |
| 30039680 |
|
Ptbp3 |
|
41079 |
6532 |
131201 |
92882 |
0 |
|
-0.09 |
0.16 |
-0.01 |
-0.06 |
n.v. |
|
polypyrimidine tract-binding protein 3 isoform 2 |
| 58037131 |
|
Ptcd2 |
|
0 |
338 |
0 |
1048 |
0 |
|
n.v. |
-0.19 |
n.v. |
0.27 |
n.v. |
|
pentatricopeptide repeat-containing protein 2,
mitochondrial |
| 33469980 |
|
Ptcd3 |
|
2307 |
6440 |
0 |
0 |
0 |
|
-0.09 |
-0.16 |
n.v. |
n.v. |
n.v. |
|
pentatricopeptide repeat domain-containing protein 3,
mitochondrial precursor |
| 6755216 |
|
Ptcra |
|
13327 |
0 |
1652 |
3749 |
0 |
|
-0.07 |
n.v. |
0.06 |
0.16 |
n.v. |
|
pre T-cell antigen receptor alpha precursor |
| 31560651 |
|
Ptdss1 |
|
0 |
0 |
70 |
0 |
0 |
|
n.v. |
n.v. |
-0.86 |
n.v. |
n.v. |
|
phosphatidylserine synthase 1 |
| 6679523 |
|
Pten |
|
0 |
0 |
0 |
0 |
2560 |
|
n.v. |
n.v. |
n.v. |
n.v. |
-0.57 |
|
phosphatidylinositol 3,4,5-trisphosphate 3-phosphatase
and dual-specificity protein phosphatase PTEN |
| 6679525 |
|
Pter |
|
0 |
0 |
0 |
0 |
38511 |
|
n.v. |
2.47 |
n.v. |
n.v. |
0.05 |
|
phosphotriesterase-related protein |
| 260763900 |
|
Ptges2 |
|
5583 |
3494 |
364 |
0 |
0 |
|
0.07 |
-0.19 |
-0.24 |
n.v. |
n.v. |
|
prostaglandin E synthase 2 |
| 50845420 |
|
Ptgfrn |
|
0 |
3282 |
12039 |
1997 |
0 |
|
n.v. |
-0.19 |
-0.03 |
0.22 |
n.v. |
|
prostaglandin F2 receptor negative regulator precursor |
| 13385466 |
|
Ptgr1 |
|
0 |
0 |
0 |
0 |
4359 |
|
n.v. |
n.v. |
n.v. |
n.v. |
0.26 |
|
prostaglandin reductase 1 |
| 357933647 |
|
Ptgr2 |
|
0 |
0 |
28 |
115 |
1285 |
|
n.v. |
n.v. |
0.24 |
0.24 |
0.66 |
|
prostaglandin reductase 2 isoform 2 |
| 85719320 |
|
Ptgr2 |
|
0 |
0 |
193 |
295 |
39336 |
|
n.v. |
n.v. |
0.17 |
0.55 |
0.56 |
|
prostaglandin reductase 2 isoform 1 |
| 6679537 |
|
Ptgs1 |
|
2361 |
4924 |
484 |
0 |
0 |
|
0 |
-0.09 |
-0.41 |
n.v. |
n.v. |
|
prostaglandin G/H synthase 1 precursor |
| 31981525 |
|
Ptgs2 |
|
0 |
2856 |
215 |
0 |
0 |
|
n.v. |
-0.23 |
-0.41 |
n.v. |
n.v. |
|
prostaglandin G/H synthase 2 precursor |
| 194353974 |
|
Ptk2 |
|
0 |
0 |
0 |
0 |
3041 |
|
n.v. |
n.v. |
n.v. |
n.v. |
-0.01 |
|
focal adhesion kinase 1 isoform 2 |
| 194353972 |
|
Ptk2 |
|
0 |
0 |
252 |
0 |
11170 |
|
n.v. |
n.v. |
0.14 |
n.v. |
-0.15 |
|
focal adhesion kinase 1 isoform 1 |
| 241982783 |
|
Ptk2b |
|
0 |
0 |
0 |
0 |
2774 |
|
n.v. |
n.v. |
n.v. |
n.v. |
0.27 |
|
protein-tyrosine kinase 2-beta isoform 3 |
| 241982787 |
|
Ptk2b |
|
0 |
0 |
0 |
0 |
2774 |
|
n.v. |
n.v. |
n.v. |
n.v. |
0.27 |
|
protein-tyrosine kinase 2-beta isoform 2 |
| 241982789 |
|
Ptk2b |
|
0 |
0 |
0 |
0 |
2774 |
|
n.v. |
n.v. |
n.v. |
n.v. |
0.27 |
|
protein-tyrosine kinase 2-beta isoform 1 |
| 30425042 |
|
Ptk7 |
|
0 |
1977 |
8410 |
0 |
0 |
|
n.v. |
-0.16 |
0 |
n.v. |
n.v. |
|
inactive tyrosine-protein kinase 7 precursor |
| 7110705 |
|
Ptma |
|
292933 |
180 |
14886 |
442 |
6147 |
|
0.19 |
0.18 |
0.06 |
0.15 |
0.08 |
|
prothymosin alpha |
| 62460366 |
|
Ptms |
|
6755 |
1733 |
5643 |
5836 |
2131 |
|
0.21 |
0.05 |
0.11 |
-0.1 |
0.23 |
|
parathymosin |
| 258613926;6679545 |
|
Ptp4a2 |
|
0 |
0 |
2050 |
0 |
0 |
|
n.v. |
n.v. |
-0.02 |
n.v. |
n.v. |
|
protein tyrosine phosphatase type IVA 2 |
| 6679545 |
|
Ptp4a2 |
|
0 |
1334 |
0 |
1686 |
2731 |
|
n.v. |
0.22 |
n.v. |
-0.44 |
-0.13 |
|
protein tyrosine phosphatase type IVA 2 |
| 171184435 |
|
Ptplad1 |
|
0 |
0 |
40 |
0 |
0 |
|
n.v. |
n.v. |
-0.65 |
n.v. |
n.v. |
|
3-hydroxyacyl-CoA dehydratase 3 |
| 84872191 |
|
Ptplb |
|
0 |
1966 |
171 |
0 |
0 |
|
n.v. |
-0.11 |
-0.15 |
n.v. |
n.v. |
|
3-hydroxyacyl-CoA dehydratase 2 |
| 23956130 |
|
Ptpmt1 |
|
0 |
837 |
9 |
0 |
0 |
|
n.v. |
-0.01 |
0.51 |
n.v. |
n.v. |
|
phosphatidylglycerophosphatase and protein-tyrosine
phosphatase 1 |
| 133505845 |
|
Ptpn1 |
|
0 |
5440 |
1910 |
0 |
0 |
|
n.v. |
-0.38 |
-0.44 |
n.v. |
n.v. |
|
tyrosine-protein phosphatase non-receptor type 1 |
| 158508568 |
|
Ptpn11 |
|
0 |
209 |
2997 |
892 |
15625 |
|
n.v. |
0.06 |
0.09 |
0.48 |
0.24 |
|
tyrosine-protein phosphatase non-receptor type 11 isoform
b |
| 6755228 |
|
Ptpn11 |
|
0 |
209 |
3471 |
892 |
23122 |
|
n.v. |
0.06 |
0.07 |
0.48 |
0.19 |
|
tyrosine-protein phosphatase non-receptor type 11 isoform
a |
| 34328195 |
|
Ptpn12 |
|
0 |
0 |
13 |
123 |
4209 |
|
n.v. |
n.v. |
0.11 |
-0.84 |
0.24 |
|
tyrosine-protein phosphatase non-receptor type 12 |
| 134948762 |
|
Ptpn13 |
|
0 |
0 |
3266 |
0 |
32 |
|
n.v. |
n.v. |
0.23 |
n.v. |
1.38 |
|
tyrosine-protein phosphatase non-receptor type 13 |
| 110825986 |
|
Ptpn14 |
|
0 |
716 |
1904 |
3708 |
236 |
|
n.v. |
0.24 |
0.26 |
-0.51 |
-0.91 |
|
tyrosine-protein phosphatase non-receptor type 14 |
| 187608416 |
|
Ptpn2 |
|
0 |
92 |
47 |
0 |
0 |
|
n.v. |
0.01 |
0.37 |
n.v. |
n.v. |
|
tyrosine-protein phosphatase non-receptor type 2 isoform
b |
| 6679553 |
|
Ptpn2 |
|
0 |
92 |
47 |
0 |
0 |
|
n.v. |
0.01 |
0.37 |
n.v. |
n.v. |
|
tyrosine-protein phosphatase non-receptor type 2 isoform
a |
| 226246561 |
|
Ptpn21 |
|
0 |
205 |
0 |
0 |
0 |
|
n.v. |
0.3 |
n.v. |
n.v. |
n.v. |
|
tyrosine-protein phosphatase non-receptor type 21 |
| 226246563;226246561 |
|
Ptpn21 |
|
0 |
0 |
1217 |
0 |
0 |
|
n.v. |
n.v. |
0.47 |
n.v. |
n.v. |
|
tyrosine-protein phosphatase non-receptor type 21 |
| 124517678 |
|
Ptpn23 |
|
0 |
2749 |
2583 |
0 |
132916 |
|
n.v. |
0.08 |
0.18 |
n.v. |
0.08 |
|
tyrosine-protein phosphatase non-receptor type 23 |
| 218505829 |
|
Ptpn3 |
|
0 |
0 |
73 |
0 |
0 |
|
n.v. |
n.v. |
0.48 |
n.v. |
n.v. |
|
tyrosine-protein phosphatase non-receptor type 3 |
| 118130771 |
|
Ptpn6 |
|
0 |
998 |
2442 |
4011 |
11277 |
|
n.v. |
0.13 |
-0.04 |
-0.02 |
0.04 |
|
tyrosine-protein phosphatase non-receptor type 6 isoform
a |
| 118130785 |
|
Ptpn6 |
|
0 |
998 |
2442 |
4011 |
11277 |
|
n.v. |
0.13 |
-0.04 |
-0.02 |
0.04 |
|
tyrosine-protein phosphatase non-receptor type 6 isoform
b |
| 61098100 |
|
Ptpn9 |
|
3661 |
1246 |
5324 |
9389 |
17360 |
|
-0.03 |
0.14 |
-0.02 |
0.08 |
0.1 |
|
tyrosine-protein phosphatase non-receptor type 9 |
| 255304936 |
|
Ptpra |
|
23651 |
1301 |
3088 |
1711 |
0 |
|
0.16 |
0.12 |
0.03 |
0.01 |
n.v. |
|
receptor-type tyrosine-protein phosphatase alpha isoform
1 precursor |
| 255304938 |
|
Ptpra |
|
23651 |
1301 |
3088 |
1711 |
0 |
|
0.16 |
0.12 |
0.03 |
0.01 |
n.v. |
|
receptor-type tyrosine-protein phosphatase alpha isoform
2 precursor |
| 90403603 |
|
Ptprd |
|
0 |
0 |
100 |
0 |
0 |
|
n.v. |
n.v. |
0.09 |
n.v. |
n.v. |
|
receptor-type tyrosine-protein phosphatase delta isoform
B precursor |
| 115648048 |
|
Ptprf |
|
0 |
1127 |
603 |
0 |
2988 |
|
n.v. |
0.12 |
0.09 |
n.v. |
-0.36 |
|
receptor-type tyrosine-protein phosphatase F
precursor |
| 208609939 |
|
Ptprj |
|
0 |
812 |
11932 |
0 |
0 |
|
n.v. |
-0.11 |
-0.49 |
n.v. |
n.v. |
|
receptor-type tyrosine-protein phosphatase eta isoform 1 |
| 208609941 |
|
Ptprj |
|
0 |
812 |
11932 |
0 |
0 |
|
n.v. |
-0.11 |
-0.49 |
n.v. |
n.v. |
|
receptor-type tyrosine-protein phosphatase eta isoform 2 |
| 6679561 |
|
Ptprk |
|
0 |
2325 |
5885 |
0 |
12134 |
|
n.v. |
0.34 |
-0.19 |
n.v. |
-0.37 |
|
receptor-type tyrosine-protein phosphatase kappa
precursor |
| 226054321 |
|
Ptprm |
|
0 |
0 |
1635 |
0 |
0 |
|
n.v. |
n.v. |
-0.16 |
n.v. |
n.v. |
|
receptor-type tyrosine-protein phosphatase mu
precursor |
| 257096040 |
|
Ptpro |
|
0 |
0 |
2305 |
0 |
0 |
|
n.v. |
n.v. |
-0.5 |
n.v. |
n.v. |
|
receptor-type tyrosine-protein phosphatase O isoform 1
precursor |
| 257096042 |
|
Ptpro |
|
0 |
0 |
2305 |
0 |
0 |
|
n.v. |
n.v. |
-0.5 |
n.v. |
n.v. |
|
receptor-type tyrosine-protein phosphatase O isoform 2
precursor |
| 257096044 |
|
Ptpro |
|
0 |
0 |
2305 |
0 |
0 |
|
n.v. |
n.v. |
-0.5 |
n.v. |
n.v. |
|
receptor-type tyrosine-protein phosphatase O isoform 3 |
| 257096046 |
|
Ptpro |
|
0 |
0 |
2305 |
0 |
0 |
|
n.v. |
n.v. |
-0.5 |
n.v. |
n.v. |
|
receptor-type tyrosine-protein phosphatase O isoform 4 |
| 6679567 |
|
Ptrf |
|
0 |
612 |
1765 |
24131 |
4691 |
|
n.v. |
0.31 |
-0.44 |
-0.41 |
-0.9 |
|
polymerase I and transcript release factor |
| 149363634 |
|
Ptrh2 |
|
20960 |
6148 |
868 |
147 |
0 |
|
-0.06 |
-0.15 |
-0.27 |
0.28 |
n.v. |
|
peptidyl-tRNA hydrolase 2, mitochondrial isoform b |
| 33239415 |
|
Ptrh2 |
|
20960 |
6148 |
868 |
147 |
0 |
|
-0.06 |
-0.15 |
-0.27 |
0.28 |
n.v. |
|
peptidyl-tRNA hydrolase 2, mitochondrial isoform a |
| 325995166 |
|
Ptrhd1 |
|
0 |
342 |
206 |
0 |
2078 |
|
n.v. |
0.06 |
0.05 |
n.v. |
0.17 |
|
putative peptidyl-tRNA hydrolase PTRHD1 |
| 7110709 |
|
Pts |
|
0 |
1580 |
0 |
0 |
31550 |
|
n.v. |
0.05 |
n.v. |
n.v. |
0.15 |
|
6-pyruvoyl tetrahydrobiopterin synthase |
| 22122339 |
|
Pttg1ip |
|
4924 |
18623 |
23338 |
3323 |
0 |
|
-0.06 |
-0.18 |
-0.31 |
-0.42 |
n.v. |
|
pituitary tumor-transforming gene 1 protein-interacting
protein precursor |
| 257196183 |
|
Puf60 |
|
64089 |
8559 |
25364 |
3299 |
6479 |
|
0 |
-0.01 |
-0.07 |
0.37 |
-0.08 |
|
poly(U)-binding-splicing factor PUF60 isoform a |
| 257196186 |
|
Puf60 |
|
64089 |
8565 |
26387 |
3299 |
6479 |
|
0 |
-0.01 |
-0.07 |
0.37 |
-0.08 |
|
poly(U)-binding-splicing factor PUF60 isoform c |
| 76677895 |
|
Puf60 |
|
64089 |
8565 |
26387 |
3299 |
6479 |
|
0 |
-0.01 |
-0.07 |
0.37 |
-0.08 |
|
poly(U)-binding-splicing factor PUF60 isoform b |
| 227430380 |
|
Pum1 |
|
0 |
0 |
3636 |
8 |
0 |
|
n.v. |
n.v. |
0.27 |
-1.08 |
n.v. |
|
pumilio homolog 1 isoform 1 |
| 227430382 |
|
Pum1 |
|
0 |
0 |
3636 |
8 |
0 |
|
n.v. |
n.v. |
0.27 |
-1.08 |
n.v. |
|
pumilio homolog 1 isoform 2 |
| 227430384 |
|
Pum1 |
|
0 |
0 |
3636 |
8 |
0 |
|
n.v. |
n.v. |
0.27 |
-1.08 |
n.v. |
|
pumilio homolog 1 isoform 3 |
| 227430386 |
|
Pum1 |
|
0 |
0 |
3636 |
8 |
0 |
|
n.v. |
n.v. |
0.27 |
-1.08 |
n.v. |
|
pumilio homolog 1 isoform 4 |
| 227430388 |
|
Pum1 |
|
0 |
0 |
3636 |
8 |
0 |
|
n.v. |
n.v. |
0.27 |
-1.08 |
n.v. |
|
pumilio homolog 1 isoform 5 |
| 237649081;237649070 |
|
Pum2 |
|
0 |
0 |
9728 |
0 |
0 |
|
n.v. |
n.v. |
0.19 |
n.v. |
n.v. |
|
pumilio homolog 2 isoform 1 |
| 237649085;237649083 |
|
Pum2 |
|
0 |
0 |
12045 |
0 |
0 |
|
n.v. |
n.v. |
0.21 |
n.v. |
n.v. |
|
pumilio homolog 2 isoform 2 |
| 237649087 |
|
Pum2 |
|
0 |
0 |
12012 |
0 |
0 |
|
n.v. |
n.v. |
0.21 |
n.v. |
n.v. |
|
pumilio homolog 2 isoform 3 |
| 6679573 |
|
Pura |
|
1831 |
1943 |
9340 |
17599 |
0 |
|
0.06 |
0.2 |
0.25 |
0.13 |
n.v. |
|
transcriptional activator protein Pur-alpha |
| 6755252 |
|
Purb |
|
20759 |
415 |
37994 |
59280 |
71015 |
|
0.1 |
0.1 |
0.15 |
-0.03 |
-0.03 |
|
transcriptional activator protein Pur-beta |
| 70906468 |
|
Pus1 |
|
0 |
1144 |
1438 |
2431 |
22308 |
|
n.v. |
0.02 |
-0.04 |
-0.08 |
0.07 |
|
tRNA pseudouridine synthase A, mitochondrial isoform
1 |
| 70906470 |
|
Pus1 |
|
0 |
1144 |
1438 |
2431 |
23604 |
|
n.v. |
0.02 |
-0.04 |
-0.08 |
0.07 |
|
tRNA pseudouridine synthase A, mitochondrial isoform
2 |
| 70906472 |
|
Pus1 |
|
0 |
1144 |
1438 |
2431 |
23604 |
|
n.v. |
0.02 |
-0.04 |
-0.08 |
0.07 |
|
tRNA pseudouridine synthase A, mitochondrial isoform
3 |
| 68342034 |
|
Pus10 |
|
0 |
0 |
0 |
0 |
2003 |
|
n.v. |
n.v. |
n.v. |
n.v. |
0.17 |
|
putative tRNA pseudouridine synthase Pus10 |
| 89111935 |
|
Pus7 |
|
0 |
384 |
452 |
32775 |
11138 |
|
n.v. |
0.33 |
0.18 |
0.08 |
-0.09 |
|
pseudouridylate synthase 7 homolog |
| 27369583 |
|
Pus7l |
|
0 |
0 |
0 |
0 |
2035 |
|
n.v. |
n.v. |
n.v. |
n.v. |
0.13 |
|
pseudouridylate synthase 7 homolog-like protein |
| 241896974 |
|
Pusl1 |
|
0 |
67 |
0 |
0 |
0 |
|
n.v. |
-0.11 |
n.v. |
n.v. |
n.v. |
|
tRNA pseudouridine synthase-like 1 |
| 228480273 |
|
Pvrl2 |
|
0 |
21 |
0 |
0 |
0 |
|
n.v. |
0.68 |
n.v. |
n.v. |
n.v. |
|
poliovirus receptor-related protein 2 isoform 1
precursor |
| 170014682 |
|
Pvrl4 |
|
0 |
0 |
0 |
0 |
1810 |
|
n.v. |
3.8 |
n.v. |
n.v. |
-0.16 |
|
poliovirus receptor-related protein 4 isoform a
precursor |
| 170014686 |
|
Pvrl4 |
|
0 |
0 |
0 |
0 |
1810 |
|
n.v. |
3.8 |
n.v. |
n.v. |
-0.16 |
|
poliovirus receptor-related protein 4 isoform b
precursor |
| 284005509 |
|
Pwp1 |
|
0 |
0 |
702 |
0 |
2046 |
|
n.v. |
n.v. |
-0.29 |
n.v. |
0.03 |
|
periodic tryptophan protein 1 homolog |
| 407262659 |
|
Pwp2 |
|
0 |
0 |
123 |
57 |
0 |
|
n.v. |
n.v. |
0.04 |
0.36 |
n.v. |
|
PREDICTED: periodic tryptophan protein 2 homolog isoform
1 |
| 407262661 |
|
Pwp2 |
|
0 |
0 |
123 |
57 |
0 |
|
n.v. |
n.v. |
0.04 |
0.36 |
n.v. |
|
PREDICTED: periodic tryptophan protein 2 homolog isoform
2 |
| 268370173 |
|
Pxdn |
|
0 |
50 |
53 |
0 |
0 |
|
n.v. |
-0.22 |
-0.03 |
n.v. |
n.v. |
|
peroxidasin homolog precursor |
| 254692828 |
|
Pxk |
|
0 |
200 |
309 |
0 |
0 |
|
n.v. |
0.02 |
0.06 |
n.v. |
n.v. |
|
PX domain-containing protein kinase-like protein long
isoform |
| 72535128 |
|
Pxk |
|
0 |
200 |
139 |
0 |
0 |
|
n.v. |
0.02 |
0.06 |
n.v. |
n.v. |
|
PX domain-containing protein kinase-like protein short
isoform |
| 10946966 |
|
Pxmp4 |
|
128 |
459 |
120 |
4355 |
0 |
|
0.29 |
-0.3 |
-0.35 |
0 |
n.v. |
|
peroxisomal membrane protein 4 |
| 114326502 |
|
Pxn |
|
0 |
0 |
44 |
0 |
10035 |
|
n.v. |
n.v. |
0.21 |
n.v. |
0.21 |
|
paxillin isoform beta |
| 21281693 |
|
Pxn |
|
0 |
0 |
44 |
0 |
9885 |
|
n.v. |
n.v. |
0.21 |
n.v. |
0.17 |
|
paxillin isoform alpha |
| 21450149 |
|
Pycr1 |
|
181339 |
10964 |
8464 |
4731 |
129 |
|
-0.05 |
-0.15 |
-0.39 |
-0.36 |
-1.27 |
|
pyrroline-5-carboxylate reductase 1, mitochondrial |
| 19526878 |
|
Pycr2 |
|
533218 |
63878 |
12353 |
14202 |
129 |
|
-0.06 |
-0.15 |
-0.37 |
-0.18 |
-1.27 |
|
pyrroline-5-carboxylate reductase 2 |
| 119508439 |
|
Pycrl |
|
0 |
58 |
1447 |
22813 |
38126 |
|
n.v. |
0.18 |
0.04 |
0.22 |
0 |
|
pyrroline-5-carboxylate reductase 3 |
| 24418919 |
|
Pygb |
|
12173 |
17792 |
44596 |
348959 |
442356 |
|
0.27 |
-0.06 |
0 |
0.26 |
-0.02 |
|
glycogen phosphorylase, brain form |
| 268836255 |
|
Pygl |
|
0 |
2334 |
7630 |
58560 |
102768 |
|
n.v. |
0.03 |
-0.04 |
0.14 |
-0.02 |
|
glycogen phosphorylase, liver form |
| 6755256 |
|
Pygm |
|
0 |
2179 |
11464 |
94551 |
204862 |
|
n.v. |
-0.19 |
-0.04 |
0.24 |
-0.03 |
|
glycogen phosphorylase, muscle form |
| 269954677 |
|
Qars |
|
0 |
3002 |
6835 |
460536 |
12444 |
|
n.v. |
0.17 |
0.04 |
0.01 |
-0.18 |
|
glutaminyl-tRNA synthetase isoform 1 |
| 269954679 |
|
Qars |
|
0 |
2505 |
4409 |
328429 |
9157 |
|
n.v. |
0.21 |
0.07 |
0 |
-0.22 |
|
glutaminyl-tRNA synthetase isoform 2 |
| 21312520 |
|
Qdpr |
|
0 |
743 |
686 |
4142 |
90806 |
|
n.v. |
0.06 |
-0.01 |
0.24 |
0.09 |
|
dihydropteridine reductase |
| 11527388 |
|
Qk |
|
0 |
0 |
938 |
1130 |
0 |
|
n.v. |
n.v. |
0.18 |
-0.06 |
n.v. |
|
protein quaking isoform 3 |
| 226958438 |
|
Qk |
|
0 |
0 |
938 |
1130 |
0 |
|
n.v. |
n.v. |
0.18 |
-0.06 |
n.v. |
|
protein quaking isoform 2 |
| 226958440 |
|
Qk |
|
0 |
0 |
938 |
1130 |
0 |
|
n.v. |
n.v. |
0.18 |
-0.06 |
n.v. |
|
protein quaking isoform 1 |
| 166295181 |
|
Qrich1 |
|
0 |
0 |
852 |
0 |
118 |
|
n.v. |
n.v. |
0.06 |
n.v. |
-0.36 |
|
glutamine-rich protein 1 |
| 124486688 |
|
Qrsl1 |
|
0 |
1434 |
0 |
0 |
0 |
|
n.v. |
-0.03 |
n.v. |
n.v. |
n.v. |
|
glutamyl-tRNA(Gln) amidotransferase subunit A,
mitochondrial |
| 158186691 |
|
Qtrt1 |
|
0 |
0 |
0 |
0 |
12155 |
|
n.v. |
n.v. |
n.v. |
n.v. |
0.13 |
|
queuine tRNA-ribosyltransferase |
| 54144622 |
|
Qtrtd1 |
|
0 |
0 |
0 |
0 |
1328 |
|
n.v. |
n.v. |
n.v. |
n.v. |
-0.01 |
|
queuine tRNA-ribosyltransferase subunit QTRTD1 |
| 225579031 |
|
R3hcc1 |
|
0 |
0 |
0 |
0 |
0 |
|
n.v. |
n.v. |
n.v. |
0.88 |
n.v. |
|
R3H and coiled-coil domain-containing protein 1 |
| 50845430 |
|
R3hdm1 |
|
0 |
0 |
0 |
0 |
332 |
|
n.v. |
n.v. |
n.v. |
n.v. |
-0.47 |
|
R3H domain (binds single-stranded nucleic acids) |
| 150010587 |
|
R3hdml |
|
0 |
0 |
300 |
1915 |
0 |
|
n.v. |
n.v. |
0.33 |
0.09 |
n.v. |
|
peptidase inhibitor R3HDML precursor |
| 6679587 |
|
Rab1 |
|
575871 |
125113 |
51210 |
51815 |
86190 |
|
0.01 |
-0.04 |
-0.08 |
-0.32 |
-0.17 |
|
ras-related protein Rab-1A |
| 7710086 |
|
Rab10 |
|
575102 |
73725 |
68485 |
43048 |
59331 |
|
-0.01 |
0 |
-0.04 |
-0.17 |
-0.12 |
|
ras-related protein Rab-10 |
| 31980840 |
|
Rab11a |
|
168031 |
67907 |
109816 |
77476 |
61665 |
|
-0.1 |
0.06 |
-0.12 |
-0.17 |
0.13 |
|
ras-related protein Rab-11A |
| 6679583 |
|
Rab11b |
|
168031 |
67573 |
110590 |
74358 |
61665 |
|
-0.1 |
0.04 |
-0.12 |
-0.17 |
0.13 |
|
ras-related protein Rab-11B |
| 124249097 |
|
Rab11fip1 |
|
0 |
0 |
47 |
0 |
0 |
|
n.v. |
n.v. |
0.27 |
n.v. |
n.v. |
|
rab11 family-interacting protein 1 isoform 1 |
| 297206826 |
|
Rab11fip1 |
|
0 |
0 |
47 |
0 |
0 |
|
n.v. |
n.v. |
0.27 |
n.v. |
n.v. |
|
rab11 family-interacting protein 1 isoform 2 |
| 256773180 |
|
Rab11fip2 |
|
0 |
0 |
4 |
0 |
0 |
|
n.v. |
n.v. |
-0.16 |
n.v. |
n.v. |
|
Rab11-family interacting protein 2 isoform 1 |
| 256773182 |
|
Rab11fip2 |
|
0 |
0 |
4 |
0 |
0 |
|
n.v. |
n.v. |
-0.16 |
n.v. |
n.v. |
|
Rab11-family interacting protein 2 isoform 2 |
| 106507168 |
|
Rab12 |
|
389534 |
38581 |
16724 |
13588 |
23518 |
|
0.01 |
-0.06 |
-0.1 |
-0.3 |
0.05 |
|
ras-related protein Rab-12 |
| 21311975 |
|
Rab13 |
|
118678 |
30513 |
27379 |
17804 |
30533 |
|
-0.14 |
-0.04 |
-0.12 |
-0.39 |
-0.17 |
|
ras-related protein Rab-13 |
| 18390323 |
|
Rab14 |
|
504770 |
63060 |
60931 |
46453 |
41617 |
|
0.07 |
0 |
-0.07 |
-0.1 |
-0.27 |
|
ras-related protein Rab-14 |
| 165377074 |
|
Rab15 |
|
505667 |
58766 |
26782 |
29894 |
53997 |
|
-0.01 |
-0.07 |
-0.09 |
-0.35 |
-0.17 |
|
ras-related protein Rab-15 |
| 229577224 |
|
Rab17 |
|
0 |
1129 |
2094 |
164 |
0 |
|
n.v. |
0.14 |
-0.12 |
-1.04 |
n.v. |
|
ras-related protein Rab-17 |
| 510936915 |
|
Rab18 |
|
30589 |
0 |
0 |
0 |
0 |
|
0.12 |
n.v. |
n.v. |
n.v. |
n.v. |
|
ras-related protein Rab-18 isoform 1 |
| 30841008 |
|
Rab18 |
|
31852 |
10488 |
9266 |
5894 |
2292 |
|
0.12 |
-0.14 |
-0.15 |
-0.49 |
-0.25 |
|
ras-related protein Rab-18 isoform 2 precursor |
| 33859608 |
|
Rab19 |
|
0 |
432 |
378 |
0 |
0 |
|
n.v. |
0.08 |
-0.32 |
n.v. |
n.v. |
|
ras-related protein Rab-19 |
| 21313162 |
|
Rab1b |
|
640509 |
125280 |
59064 |
75045 |
86083 |
|
0.02 |
-0.06 |
-0.08 |
-0.29 |
-0.11 |
|
ras-related protein Rab-1B |
| 45593126 |
|
Rab20 |
|
0 |
967 |
193 |
0 |
0 |
|
n.v. |
0.14 |
-0.61 |
n.v. |
n.v. |
|
ras-related protein Rab-20 |
| 33859751 |
|
Rab21 |
|
13858 |
8290 |
13189 |
9847 |
10806 |
|
-0.1 |
-0.1 |
-0.02 |
-0.08 |
-0.01 |
|
ras-related protein Rab-21 |
| 148747177 |
|
Rab22a |
|
732 |
1442 |
2404 |
2218 |
2088 |
|
-0.03 |
0 |
0 |
-0.08 |
-0.23 |
|
ras-related protein Rab-22A |
| 31543565 |
|
Rab23 |
|
0 |
816 |
1163 |
0 |
0 |
|
n.v. |
0.06 |
0.05 |
n.v. |
n.v. |
|
ras-related protein Rab-23 |
| 6679591 |
|
Rab24 |
|
0 |
2793 |
477 |
0 |
1499 |
|
n.v. |
-0.24 |
0.06 |
n.v. |
-0.39 |
|
ras-related protein Rab-24 |
| 31980838 |
|
Rab25 |
|
2142 |
7158 |
33343 |
23705 |
9349 |
|
-0.96 |
-0.09 |
-0.22 |
-0.11 |
0.3 |
|
ras-related protein Rab-25 |
| 254939698 |
|
Rab26 |
|
389534 |
38341 |
7303 |
13408 |
23518 |
|
0.01 |
-0.15 |
-0.1 |
-0.35 |
0.05 |
|
ras-related protein Rab-26 |
| 13128964 |
|
Rab27a |
|
0 |
891 |
1412 |
0 |
0 |
|
n.v. |
-0.55 |
-0.3 |
n.v. |
n.v. |
|
ras-related protein Rab-27A |
| 127138858 |
|
Rab27b |
|
0 |
376 |
1990 |
131 |
0 |
|
n.v. |
-0.36 |
-0.17 |
-0.63 |
n.v. |
|
ras-related protein Rab-27B |
| 58037191 |
|
Rab28 |
|
0 |
0 |
0 |
0 |
4102 |
|
n.v. |
n.v. |
n.v. |
n.v. |
0.6 |
|
ras-related protein Rab-28 |
| 10946940 |
|
Rab2a |
|
78752 |
35699 |
25005 |
16551 |
13258 |
|
0.05 |
-0.07 |
-0.09 |
-0.28 |
-0.54 |
|
ras-related protein Rab-2A |
| 30525051 |
|
Rab2b |
|
29546 |
15525 |
10514 |
7981 |
4037 |
|
0.06 |
-0.07 |
-0.08 |
-0.27 |
-0.12 |
|
ras-related protein Rab-2B |
| 31560778 |
|
Rab30 |
|
389534 |
38341 |
7388 |
13408 |
23518 |
|
0.01 |
-0.15 |
-0.1 |
-0.35 |
0.05 |
|
ras-related protein Rab-30 |
| 225579124 |
|
Rab31 |
|
732 |
1311 |
2556 |
1179 |
2088 |
|
-0.03 |
-0.03 |
-0.1 |
-0.08 |
-0.23 |
|
ras-related protein Rab-31 |
| 13385896 |
|
Rab32 |
|
0 |
355 |
142 |
0 |
0 |
|
n.v. |
-0.2 |
-0.06 |
n.v. |
n.v. |
|
ras-related protein Rab-32 |
| 6755260 |
|
Rab33a |
|
0 |
0 |
323 |
0 |
0 |
|
n.v. |
n.v. |
-0.2 |
n.v. |
n.v. |
|
ras-related protein Rab-33A |
| 8394133 |
|
Rab33b |
|
389534 |
38341 |
16489 |
13408 |
23518 |
|
0.01 |
-0.15 |
-0.1 |
-0.35 |
0.05 |
|
ras-related protein Rab-33B |
| 31560774 |
|
Rab34 |
|
0 |
63 |
70 |
0 |
0 |
|
n.v. |
0.4 |
0.12 |
n.v. |
n.v. |
|
ras-related protein Rab-34 |
| 37718983 |
|
Rab35 |
|
510189 |
74071 |
38820 |
30860 |
53997 |
|
-0.02 |
-0.08 |
-0.08 |
-0.3 |
-0.17 |
|
ras-related protein Rab-35 |
| 254939625 |
|
Rab37 |
|
389534 |
38341 |
7303 |
13408 |
23518 |
|
0.01 |
-0.15 |
-0.1 |
-0.35 |
0.05 |
|
ras-related protein Rab-37 isoform 1 |
| 254939635 |
|
Rab37 |
|
389534 |
38341 |
7303 |
13408 |
23518 |
|
0.01 |
-0.15 |
-0.1 |
-0.35 |
0.05 |
|
ras-related protein Rab-37 isoform 2 |
| 21105857 |
|
Rab38 |
|
0 |
355 |
119 |
0 |
0 |
|
n.v. |
-0.2 |
-0.09 |
n.v. |
n.v. |
|
ras-related protein Rab-38 |
| 30425356 |
|
Rab39 |
|
389534 |
38341 |
7303 |
13408 |
23518 |
|
0.01 |
-0.15 |
-0.1 |
-0.35 |
0.05 |
|
ras-related protein Rab-39A |
| 30424726 |
|
Rab39b |
|
389534 |
38341 |
7303 |
13408 |
23518 |
|
0.01 |
-0.15 |
-0.1 |
-0.35 |
0.05 |
|
ras-related protein Rab-39B |
| 261862303 |
|
Rab3a |
|
389534 |
42026 |
19104 |
13408 |
24439 |
|
0.01 |
-0.11 |
-0.11 |
-0.35 |
0.08 |
|
ras-related protein Rab-3A |
| 12963723 |
|
Rab3b |
|
389534 |
41208 |
18666 |
13408 |
23518 |
|
0.01 |
-0.16 |
-0.12 |
-0.35 |
0.05 |
|
ras-related protein Rab-3B |
| 13470090 |
|
Rab3c |
|
389534 |
40552 |
18899 |
13408 |
23518 |
|
0.01 |
-0.15 |
-0.1 |
-0.35 |
0.05 |
|
ras-related protein Rab-3C |
| 15042957 |
|
Rab3d |
|
407291 |
42408 |
21978 |
13637 |
23518 |
|
-0.01 |
-0.15 |
-0.16 |
-0.41 |
0.05 |
|
ras-related protein Rab-3D |
| 158966667 |
|
Rab3gap1 |
|
0 |
0 |
427 |
4093 |
2870 |
|
n.v. |
n.v. |
-0.05 |
0.12 |
0.13 |
|
rab3 GTPase-activating protein catalytic subunit |
| 255003810 |
|
Rab3gap2 |
|
0 |
0 |
1798 |
7842 |
5933 |
|
n.v. |
n.v. |
-0.21 |
0.17 |
0.03 |
|
rab3 GTPase-activating protein non-catalytic subunit |
| 51556219 |
|
Rab3ip |
|
0 |
321 |
757 |
491 |
11663 |
|
n.v. |
0.15 |
-0.09 |
-0.28 |
0.56 |
|
rab-3A-interacting protein |
| 253970492 |
|
Rab40b |
|
29894 |
4296 |
18251 |
4355 |
82046 |
|
0.14 |
0.12 |
0.06 |
0.2 |
0.14 |
|
ras-related protein Rab-40B |
| 86476069 |
|
Rab43 |
|
389534 |
38341 |
7303 |
13408 |
23518 |
|
0.01 |
-0.15 |
-0.1 |
-0.35 |
0.05 |
|
ras-related protein Rab-43 isoform a |
| 171184402 |
|
Rab4a |
|
389534 |
39682 |
19079 |
16420 |
24054 |
|
0.01 |
-0.16 |
-0.09 |
-0.23 |
-0.02 |
|
ras-related protein Rab-4A |
| 21313012 |
|
Rab4b |
|
389534 |
39018 |
18128 |
17697 |
23518 |
|
0.01 |
-0.14 |
-0.02 |
-0.28 |
0.05 |
|
ras-related protein Rab-4B |
| 13385374 |
|
Rab5a |
|
116316 |
24839 |
57260 |
66180 |
72739 |
|
0 |
-0.09 |
-0.02 |
-0.21 |
-0.31 |
|
ras-related protein Rab-5A |
| 28916687 |
|
Rab5b |
|
112490 |
23495 |
50918 |
37302 |
64782 |
|
0 |
-0.1 |
-0.05 |
-0.18 |
-0.31 |
|
ras-related protein Rab-5B isoform 1 |
| 113866024 |
|
Rab5c |
|
172040 |
23597 |
54029 |
51323 |
91695 |
|
-0.03 |
-0.07 |
-0.06 |
-0.14 |
-0.29 |
|
ras-related protein Rab-5C |
| 13195674 |
|
Rab6a |
|
402622 |
54895 |
43279 |
21594 |
32182 |
|
0.02 |
-0.18 |
-0.18 |
-0.11 |
0.12 |
|
ras-related protein Rab-6A isoform 2 |
| 254750706 |
|
Rab6a |
|
402622 |
54895 |
43279 |
21594 |
32182 |
|
0.02 |
-0.18 |
-0.18 |
-0.11 |
0.12 |
|
ras-related protein Rab-6A isoform 1 |
| 30424655 |
|
Rab6b |
|
392774 |
43118 |
30923 |
41304 |
112857 |
|
0.01 |
-0.17 |
-0.13 |
-0.23 |
0.11 |
|
ras-related protein Rab-6B |
| 148747526 |
|
Rab7 |
|
210043 |
139868 |
139293 |
69266 |
63411 |
|
0.06 |
-0.07 |
-0.12 |
-0.25 |
-0.17 |
|
ras-related protein Rab-7a |
| 229608951 |
|
Rab7l1 |
|
0 |
365 |
142 |
0 |
0 |
|
n.v. |
0.07 |
-0.12 |
n.v. |
n.v. |
|
ras-related protein Rab-7L1 |
| 38372905 |
|
Rab8a |
|
555826 |
61861 |
44488 |
32734 |
54201 |
|
0.02 |
-0.04 |
-0.07 |
-0.26 |
-0.17 |
|
ras-related protein Rab-8A |
| 27734154 |
|
Rab8b |
|
506656 |
61371 |
37326 |
30393 |
53997 |
|
-0.02 |
-0.07 |
-0.08 |
-0.3 |
-0.17 |
|
ras-related protein Rab-8B |
| 9790227 |
|
Rab9 |
|
238 |
8496 |
4934 |
2341 |
386 |
|
0.04 |
-0.06 |
-0.02 |
-0.32 |
-0.49 |
|
ras-related protein Rab-9A |
| 28892801 |
|
Rab9b |
|
0 |
0 |
72 |
0 |
268 |
|
n.v. |
n.v. |
-0.09 |
n.v. |
0.37 |
|
ras-related protein Rab-9B |
| 33859558 |
|
Rabac1 |
|
0 |
2478 |
97 |
1604 |
0 |
|
n.v. |
0 |
-0.24 |
0.06 |
n.v. |
|
prenylated Rab acceptor protein 1 |
| 238231439 |
|
Rabep1 |
|
0 |
0 |
0 |
0 |
8064 |
|
n.v. |
n.v. |
n.v. |
n.v. |
-0.07 |
|
rab GTPase-binding effector protein 1 |
| 140970573 |
|
Rabep2 |
|
0 |
0 |
301 |
33 |
26710 |
|
n.v. |
n.v. |
-0.24 |
0.53 |
-0.03 |
|
rab GTPase-binding effector protein 2 |
| 76880489 |
|
Rabgap1 |
|
0 |
766 |
1586 |
1711 |
28659 |
|
n.v. |
0.15 |
0.02 |
0.14 |
0.01 |
|
rab GTPase-activating protein 1 isoform a |
| 76880498 |
|
Rabgap1 |
|
0 |
668 |
1267 |
1711 |
17339 |
|
n.v. |
0.33 |
0.02 |
0.14 |
0 |
|
rab GTPase-activating protein 1 isoform b |
| 229577255 |
|
Rabgap1l |
|
0 |
0 |
0 |
0 |
75 |
|
n.v. |
n.v. |
n.v. |
n.v. |
4.27 |
|
rab GTPase-activating protein 1-like isoform a |
| 84490375 |
|
Rabgap1l |
|
0 |
0 |
0 |
0 |
1960 |
|
n.v. |
n.v. |
n.v. |
n.v. |
-0.1 |
|
rab GTPase-activating protein 1-like isoform b |
| 312261269;9910316 |
|
Rabgef1 |
|
0 |
0 |
97 |
0 |
1585 |
|
n.v. |
n.v. |
0.36 |
n.v. |
0.38 |
|
rab5 GDP/GTP exchange factor |
| 9507023 |
|
Rabggta |
|
0 |
0 |
2400 |
0 |
23047 |
|
n.v. |
n.v. |
0 |
n.v. |
0.39 |
|
geranylgeranyl transferase type-2 subunit alpha |
| 254553291 |
|
Rabggtb |
|
0 |
242 |
174 |
0 |
33553 |
|
n.v. |
-0.01 |
-0.18 |
n.v. |
-0.05 |
|
geranylgeranyl transferase type-2 subunit beta isoform
1 |
| 254553293 |
|
Rabggtb |
|
0 |
242 |
174 |
0 |
33553 |
|
n.v. |
-0.01 |
-0.18 |
n.v. |
-0.05 |
|
geranylgeranyl transferase type-2 subunit beta isoform
2 |
| 254553295 |
|
Rabggtb |
|
0 |
242 |
61 |
0 |
10003 |
|
n.v. |
-0.01 |
-0.3 |
n.v. |
0.16 |
|
geranylgeranyl transferase type-2 subunit beta isoform
3 |
| 21704004 |
|
Rabif |
|
0 |
0 |
0 |
0 |
1060 |
|
n.v. |
n.v. |
n.v. |
n.v. |
0.22 |
|
guanine nucleotide exchange factor MSS4 |
| 146134336 |
|
Rabl2 |
|
0 |
0 |
37 |
16 |
996 |
|
n.v. |
n.v. |
0.15 |
0.56 |
-0.09 |
|
RAB, member of RAS oncogene family-like 2A |
| 21313026 |
|
Rabl5 |
|
0 |
0 |
98 |
196 |
4155 |
|
n.v. |
n.v. |
-0.97 |
-1.16 |
0.24 |
|
rab-like protein 5 |
| 112181302 |
|
Rabl6 |
|
696 |
286 |
199 |
4805 |
1467 |
|
-0.21 |
-0.08 |
-0.27 |
0.2 |
-0.24 |
|
rab-like protein 6 |
| 45592934 |
|
Rac1 |
|
50927 |
48650 |
115711 |
427434 |
126597 |
|
0.11 |
0.19 |
0.08 |
0.07 |
0 |
|
ras-related C3 botulinum toxin substrate 1 precursor |
| 6679601 |
|
Rac2 |
|
44813 |
36696 |
88105 |
219627 |
111786 |
|
0.11 |
0.14 |
0.02 |
0.04 |
0.06 |
|
ras-related C3 botulinum toxin substrate 2 precursor |
| 18875380 |
|
Rac3 |
|
44813 |
36918 |
88685 |
321177 |
112910 |
|
0.11 |
0.15 |
0.03 |
0.03 |
0.12 |
|
ras-related C3 botulinum toxin substrate 3 precursor |
| 6755266 |
|
Racgap1 |
|
0 |
192 |
119 |
0 |
0 |
|
n.v. |
-0.29 |
0.31 |
n.v. |
n.v. |
|
rac GTPase-activating protein 1 |
| 84872189 |
|
Rad1 |
|
0 |
0 |
0 |
0 |
1467 |
|
n.v. |
n.v. |
n.v. |
n.v. |
0.11 |
|
cell cycle checkpoint protein RAD1 |
| 254692855 |
|
Rad21 |
|
5638 |
0 |
572 |
25 |
0 |
|
0.04 |
n.v. |
-0.17 |
-0.18 |
n.v. |
|
double-strand-break repair protein rad21 homolog |
| 34447211 |
|
Rad23a |
|
0 |
152 |
0 |
0 |
19823 |
|
n.v. |
0.16 |
n.v. |
n.v. |
0.14 |
|
UV excision repair protein RAD23 homolog A |
| 171906578 |
|
Rad23b |
|
458 |
58 |
1598 |
4150 |
95390 |
|
0.13 |
-0.33 |
0.14 |
0.12 |
0.04 |
|
UV excision repair protein RAD23 homolog B |
| 153945822 |
|
Rad50 |
|
293 |
0 |
15 |
1220 |
10902 |
|
0.14 |
n.v. |
0.06 |
0.12 |
-0.22 |
|
DNA repair protein RAD50 |
| 6755276 |
|
Rad51 |
|
0 |
0 |
0 |
0 |
3491 |
|
n.v. |
n.v. |
n.v. |
n.v. |
-0.22 |
|
DNA repair protein RAD51 homolog 1 |
| 110626102 |
|
Rad51ap1 |
|
0 |
0 |
0 |
0 |
118 |
|
n.v. |
n.v. |
n.v. |
n.v. |
0.07 |
|
RAD51-associated protein 1 |
| 31982072 |
|
Rad51b |
|
0 |
159 |
1487 |
0 |
0 |
|
n.v. |
0.54 |
0.17 |
n.v. |
n.v. |
|
DNA repair protein RAD51 homolog 2 isoform 1 |
| 16716605 |
|
Rad51c |
|
0 |
0 |
0 |
0 |
600 |
|
n.v. |
n.v. |
n.v. |
n.v. |
0.84 |
|
DNA repair protein RAD51 homolog 3 |
| 6755278 |
|
Rad51d |
|
0 |
0 |
0 |
131 |
86 |
|
n.v. |
n.v. |
n.v. |
-0.91 |
0.38 |
|
DNA repair protein RAD51 homolog 4 |
| 126090612 |
|
Rad54l2 |
|
0 |
0 |
0 |
0 |
86 |
|
n.v. |
n.v. |
n.v. |
n.v. |
0.19 |
|
helicase ARIP4 |
| 28201956 |
|
Rae1 |
|
2215 |
1238 |
3121 |
1383 |
4016 |
|
-0.02 |
0.58 |
-0.01 |
-0.16 |
-0.16 |
|
mRNA export factor |
| 6679617 |
|
Raet1a |
|
0 |
0 |
171 |
0 |
0 |
|
n.v. |
n.v. |
-0.01 |
n.v. |
n.v. |
|
retinoic acid early-inducible protein 1-alpha precursor |
| 6679619 |
|
Raet1b |
|
0 |
0 |
171 |
0 |
0 |
|
n.v. |
n.v. |
-0.01 |
n.v. |
n.v. |
|
retinoic acid early-inducible protein 1-beta precursor |
| 6679621 |
|
Raet1c |
|
0 |
0 |
171 |
0 |
0 |
|
n.v. |
n.v. |
-0.01 |
n.v. |
n.v. |
|
retinoic acid early-inducible protein 1-gamma precursor |
| 9910522 |
|
Raet1d |
|
0 |
0 |
171 |
0 |
0 |
|
n.v. |
n.v. |
-0.01 |
n.v. |
n.v. |
|
retinoic acid early-inducible protein 1-delta precursor |
| 38016148 |
|
Raet1e |
|
0 |
0 |
171 |
0 |
0 |
|
n.v. |
n.v. |
-0.01 |
n.v. |
n.v. |
|
retinoic acid early-inducible protein 1-epsilon precursor |
| 18497290 |
|
Raf1 |
|
0 |
0 |
63 |
2562 |
0 |
|
n.v. |
n.v. |
0.66 |
0.32 |
n.v. |
|
RAF proto-oncogene serine/threonine-protein kinase |
| 13507620 |
|
Rai14 |
|
366 |
0 |
337 |
0 |
0 |
|
-0.77 |
n.v. |
0.05 |
n.v. |
n.v. |
|
ankycorbin |
| 34328471 |
|
Rala |
|
41664 |
40702 |
57345 |
17157 |
0 |
|
0.09 |
-0.07 |
-0.11 |
-0.22 |
n.v. |
|
ras-related protein Ral-A precursor |
| 11612509 |
|
Ralb |
|
38790 |
44291 |
67589 |
24409 |
0 |
|
-0.1 |
-0.01 |
-0.09 |
-0.4 |
n.v. |
|
ras-related protein Ral-B precursor |
| 163310721 |
|
Ralgapa1 |
|
0 |
0 |
263 |
0 |
0 |
|
n.v. |
n.v. |
0.03 |
n.v. |
n.v. |
|
ral GTPase-activating protein subunit alpha-1 isoform
2 |
| 51230692 |
|
Ralgapa1 |
|
0 |
0 |
263 |
0 |
0 |
|
n.v. |
n.v. |
0.03 |
n.v. |
n.v. |
|
ral GTPase-activating protein subunit alpha-1 isoform
3 |
| 158187505 |
|
Ralgapa2 |
|
0 |
0 |
149 |
15061 |
0 |
|
n.v. |
n.v. |
0.31 |
-0.11 |
n.v. |
|
ral GTPase-activating protein subunit alpha-2 |
| 124487299 |
|
Ralgapb |
|
0 |
0 |
272 |
336 |
0 |
|
n.v. |
n.v. |
-0.28 |
1.06 |
n.v. |
|
ral GTPase-activating protein subunit beta |
| 213417784;213417775 |
|
Raly |
|
113241 |
0 |
7713 |
0 |
0 |
|
0.08 |
n.v. |
0.11 |
n.v. |
n.v. |
|
RNA-binding protein Raly short isoform |
| 213417775 |
|
Raly |
|
0 |
1219 |
0 |
12025 |
0 |
|
n.v. |
0.14 |
n.v. |
0.04 |
n.v. |
|
RNA-binding protein Raly short isoform |
| 213417812 |
|
Raly |
|
113241 |
1219 |
7713 |
12025 |
0 |
|
0.08 |
0.14 |
0.11 |
0.04 |
n.v. |
|
RNA-binding protein Raly long isoform |
| 153792001 |
|
Ranbp1 |
|
10984 |
7968 |
20159 |
21667 |
219288 |
|
0.05 |
0.12 |
0.04 |
0.18 |
0.08 |
|
ran-specific GTPase-activating protein |
| 40804757 |
|
Ranbp10 |
|
0 |
0 |
0 |
5730 |
0 |
|
n.v. |
n.v. |
0.47 |
-0.07 |
n.v. |
|
ran-binding protein 10 |
| 153792534 |
|
Ranbp2 |
|
5364 |
90 |
20 |
2578 |
6672 |
|
-0.1 |
0.12 |
-0.19 |
-0.39 |
-0.53 |
|
E3 SUMO-protein ligase RanBP2 |
| 357197128 |
|
Ranbp3 |
|
0 |
138 |
1316 |
123 |
31957 |
|
n.v. |
0.09 |
0.05 |
-0.26 |
0.02 |
|
ran-binding protein 3 isoform 1 |
| 357197131 |
|
Ranbp3 |
|
0 |
138 |
1316 |
123 |
31957 |
|
n.v. |
0.09 |
0.05 |
-0.26 |
0.02 |
|
ran-binding protein 3 isoform 3 |
| 83523744 |
|
Ranbp3 |
|
0 |
138 |
1316 |
123 |
31957 |
|
n.v. |
0.09 |
0.05 |
-0.26 |
0.02 |
|
ran-binding protein 3 isoform 2 |
| 53850664 |
|
Ranbp6 |
|
0 |
0 |
2082 |
0 |
0 |
|
n.v. |
n.v. |
0.06 |
n.v. |
n.v. |
|
ran-binding protein 6 |
| 161353515 |
|
Ranbp9 |
|
0 |
0 |
19 |
10510 |
0 |
|
n.v. |
n.v. |
-0.66 |
-0.07 |
n.v. |
|
ran-binding protein 9 |
| 226051567 |
|
Rangap1 |
|
26342 |
706 |
3282 |
47935 |
14651 |
|
0.08 |
-0.04 |
-0.15 |
-0.09 |
-0.15 |
|
ran GTPase-activating protein 1 |
| 21704066 |
|
Rap1a |
|
94935 |
29735 |
87470 |
35615 |
8535 |
|
-0.06 |
-0.14 |
-0.01 |
-0.41 |
1.28 |
|
ras-related protein Rap-1A precursor |
| 33859753 |
|
Rap1b |
|
99200 |
29169 |
89760 |
40469 |
8407 |
|
-0.07 |
-0.1 |
-0.25 |
-0.2 |
1.28 |
|
ras-related protein Rap-1b precursor |
| 100818161 |
|
Rap1gds1 |
|
0 |
0 |
345 |
0 |
32739 |
|
n.v. |
n.v. |
0.19 |
n.v. |
0.09 |
|
RAP1, GTP-GDP dissociation stimulator 1 isoform a |
| 100818462 |
|
Rap1gds1 |
|
0 |
0 |
345 |
0 |
29280 |
|
n.v. |
n.v. |
0.19 |
n.v. |
0.05 |
|
RAP1, GTP-GDP dissociation stimulator 1 isoform b |
| 40254160 |
|
Rap2a |
|
0 |
2119 |
4927 |
0 |
0 |
|
n.v. |
-0.1 |
-0.16 |
n.v. |
n.v. |
|
ras-related protein Rap-2a precursor |
| 13386338 |
|
Rap2b |
|
586 |
2887 |
6070 |
352 |
0 |
|
-0.19 |
-0.09 |
-0.25 |
-0.51 |
n.v. |
|
ras-related protein Rap-2b precursor |
| 27369539 |
|
Rap2c |
|
0 |
3816 |
5343 |
1817 |
2560 |
|
n.v. |
-0.14 |
-0.18 |
-0.06 |
-0.06 |
|
ras-related protein Rap-2c precursor |
| 323637461 |
|
Rapgef4 |
|
0 |
708 |
3521 |
0 |
0 |
|
n.v. |
0.11 |
0.18 |
n.v. |
n.v. |
|
rap guanine nucleotide exchange factor 4 isoform 1 |
| 323637463 |
|
Rapgef4 |
|
0 |
708 |
3521 |
0 |
0 |
|
n.v. |
0.11 |
0.18 |
n.v. |
n.v. |
|
rap guanine nucleotide exchange factor 4 isoform 3 |
| 9790087 |
|
Rapgef4 |
|
0 |
708 |
3521 |
0 |
0 |
|
n.v. |
0.11 |
0.18 |
n.v. |
n.v. |
|
rap guanine nucleotide exchange factor 4 isoform 2 |
| 124257963 |
|
Rapgefl1 |
|
0 |
708 |
3521 |
0 |
0 |
|
n.v. |
0.11 |
0.18 |
n.v. |
n.v. |
|
rap guanine nucleotide exchange factor-like 1 |
| 262118273 |
|
Rars |
|
3277 |
25100 |
29642 |
814897 |
27716 |
|
0.02 |
0.12 |
0 |
0.01 |
-0.12 |
|
arginine--tRNA ligase, cytoplasmic |
| 240120047 |
|
Rars2 |
|
0 |
111 |
0 |
0 |
0 |
|
n.v. |
0.04 |
n.v. |
n.v. |
n.v. |
|
probable arginine--tRNA ligase, mitochondrial
precursor |
| 164663773 |
|
Rasa1 |
|
0 |
0 |
91 |
0 |
7636 |
|
n.v. |
n.v. |
0.19 |
n.v. |
-0.13 |
|
RAS p21 protein activator 1 |
| 31980729 |
|
Rasal1 |
|
2343 |
0 |
0 |
0 |
0 |
|
0.07 |
n.v. |
n.v. |
n.v. |
n.v. |
|
rasGAP-activating-like protein 1 isoform 1 |
| 530537198 |
|
Rasal1 |
|
2343 |
0 |
0 |
0 |
0 |
|
0.07 |
n.v. |
n.v. |
n.v. |
n.v. |
|
rasGAP-activating-like protein 1 isoform 2 |
| 6677677 |
|
Rasl2-9 |
|
201458 |
16792 |
26587 |
55253 |
189526 |
|
0.05 |
-0.02 |
0.03 |
0.03 |
-0.03 |
|
GTP-binding nuclear protein Ran, testis-specific isoform |
| 110431380 |
|
Rassf6 |
|
0 |
0 |
83 |
1342 |
8653 |
|
n.v. |
n.v. |
0.2 |
-0.06 |
0.08 |
|
ras association domain-containing protein 6 |
| 29789209 |
|
Raver1 |
|
5199 |
2578 |
3812 |
0 |
0 |
|
0.04 |
-0.11 |
-0.11 |
n.v. |
n.v. |
|
ribonucleoprotein PTB-binding 1 |
| 226693374 |
|
Rb1cc1 |
|
0 |
0 |
0 |
0 |
343 |
|
n.v. |
n.v. |
n.v. |
n.v. |
-1.89 |
|
RB1-inducible coiled-coil protein 1 |
| 47059484 |
|
Rbbp4 |
|
113955 |
8319 |
11718 |
34363 |
108016 |
|
-0.02 |
-0.1 |
-0.08 |
-0.03 |
-0.06 |
|
histone-binding protein RBBP4 |
| 164450487 |
|
Rbbp5 |
|
1117 |
0 |
0 |
1662 |
54 |
|
-0.16 |
n.v. |
n.v. |
-0.11 |
1.17 |
|
retinoblastoma-binding protein 5 |
| 163937858 |
|
Rbbp6 |
|
0 |
326 |
91 |
0 |
0 |
|
n.v. |
-0.24 |
-0.2 |
n.v. |
n.v. |
|
E3 ubiquitin-protein ligase RBBP6 isoform 1 |
| 157909799 |
|
Rbbp7 |
|
115328 |
7978 |
8740 |
37424 |
103411 |
|
-0.03 |
0 |
-0.07 |
-0.05 |
-0.03 |
|
histone-binding protein RBBP7 |
| 86439977 |
|
Rbbp9 |
|
0 |
960 |
768 |
769 |
22651 |
|
n.v. |
0.07 |
0.11 |
0.05 |
0.19 |
|
putative hydrolase RBBP9 |
| 145046239 |
|
Rbck1 |
|
0 |
17 |
0 |
0 |
600 |
|
n.v. |
-0.14 |
n.v. |
n.v. |
-0.01 |
|
ranBP-type and C3HC4-type zinc finger-containing protein
1 |
| 213417847 |
|
Rbl1 |
|
0 |
0 |
44 |
2300 |
321 |
|
n.v. |
n.v. |
-0.02 |
-0.24 |
0.58 |
|
retinoblastoma-like protein 1 isoform 1 |
| 213417872 |
|
Rbl1 |
|
0 |
0 |
34 |
2300 |
321 |
|
n.v. |
n.v. |
0.01 |
-0.24 |
0.58 |
|
retinoblastoma-like protein 1 isoform 2 |
| 21704124 |
|
Rbm10 |
|
622 |
0 |
0 |
0 |
0 |
|
-0.94 |
n.v. |
n.v. |
n.v. |
n.v. |
|
RNA-binding protein 10 isoform 1 |
| 269847193 |
|
Rbm10 |
|
622 |
0 |
0 |
0 |
0 |
|
-0.94 |
n.v. |
n.v. |
n.v. |
n.v. |
|
RNA-binding protein 10 isoform 2 |
| 269847199 |
|
Rbm10 |
|
622 |
0 |
0 |
0 |
0 |
|
-0.94 |
n.v. |
n.v. |
n.v. |
n.v. |
|
RNA-binding protein 10 isoform 3 |
| 114155120 |
|
Rbm12 |
|
0 |
0 |
923 |
0 |
12905 |
|
n.v. |
n.v. |
-0.08 |
n.v. |
0.08 |
|
RNA-binding protein 12 |
| 86262142 |
|
Rbm14 |
|
105351 |
3743 |
13242 |
0 |
0 |
|
-0.06 |
-0.27 |
-0.1 |
n.v. |
n.v. |
|
RNA-binding protein 14 |
| 124249066 |
|
Rbm15 |
|
2636 |
0 |
25 |
0 |
0 |
|
0.27 |
n.v. |
0.54 |
n.v. |
n.v. |
|
RNA binding motif protein 15 |
| 22779924 |
|
Rbm17 |
|
0 |
0 |
2366 |
0 |
0 |
|
n.v. |
n.v. |
0.06 |
n.v. |
n.v. |
|
splicing factor 45 |
| 30794154 |
|
Rbm19 |
|
0 |
0 |
784 |
0 |
0 |
|
n.v. |
n.v. |
-0.08 |
n.v. |
n.v. |
|
probable RNA-binding protein 19 |
| 110625591 |
|
Rbm22 |
|
0 |
0 |
479 |
0 |
0 |
|
n.v. |
n.v. |
0.16 |
n.v. |
n.v. |
|
pre-mRNA-splicing factor RBM22 |
| 161353449 |
|
Rbm25 |
|
26251 |
820 |
1184 |
0 |
64 |
|
0.11 |
-0.05 |
0.28 |
n.v. |
1.53 |
|
RNA-binding protein 25 |
| 123701991 |
|
Rbm26 |
|
110 |
0 |
230 |
0 |
0 |
|
-0.64 |
n.v. |
-0.05 |
n.v. |
n.v. |
|
RNA-binding protein 26 |
| 166235127 |
|
Rbm28 |
|
0 |
0 |
1320 |
3102 |
0 |
|
n.v. |
n.v. |
-0.17 |
-2.54 |
n.v. |
|
RNA-binding protein 28 |
| 261862339 |
|
Rbm3 |
|
18050 |
159 |
7375 |
2341 |
1210 |
|
0.08 |
0.96 |
0.04 |
0.46 |
0.13 |
|
putative RNA-binding protein 3 isoform 2 |
| 37497112 |
|
Rbm3 |
|
3368 |
159 |
7053 |
3258 |
1167 |
|
0.28 |
0.96 |
0.04 |
0.29 |
-0.09 |
|
putative RNA-binding protein 3 isoform 1 |
| 294610680 |
|
Rbm31y |
|
76775 |
820 |
17168 |
3544 |
7775 |
|
-0.03 |
-0.01 |
-0.07 |
-0.12 |
-0.06 |
|
RNA binding motif 31, Y-linked |
| 145966792 |
|
Rbm33 |
|
0 |
0 |
0 |
213 |
0 |
|
n.v. |
n.v. |
n.v. |
0.26 |
n.v. |
|
RNA-binding protein 33 |
| 42794007 |
|
Rbm34 |
|
0 |
0 |
94 |
0 |
0 |
|
n.v. |
n.v. |
-0.15 |
n.v. |
n.v. |
|
RNA-binding protein 34 |
| 118403314 |
|
Rbm39 |
|
25921 |
8659 |
10128 |
8881 |
0 |
|
0.18 |
-0.09 |
-0.11 |
-0.23 |
n.v. |
|
RNA-binding protein 39 |
| 86262144 |
|
Rbm4 |
|
0 |
0 |
255 |
106 |
0 |
|
n.v. |
n.v. |
0.12 |
-0.2 |
n.v. |
|
RNA-binding protein 4 |
| 224922828 |
|
Rbm42 |
|
0 |
0 |
66 |
450 |
0 |
|
n.v. |
n.v. |
-0.31 |
0.3 |
n.v. |
|
RNA-binding protein 42 |
| 461496486 |
|
Rbm46 |
|
0 |
0 |
1207 |
0 |
0 |
|
n.v. |
n.v. |
0.28 |
n.v. |
n.v. |
|
probable RNA-binding protein 46 |
| 226423939 |
|
Rbm46 |
|
0 |
0 |
2406 |
1375 |
0 |
|
n.v. |
n.v. |
0.27 |
0.08 |
n.v. |
|
probable RNA-binding protein 46 |
| 188497698 |
|
Rbm47 |
|
8695 |
4054 |
25118 |
25948 |
0 |
|
0.18 |
0.21 |
0.23 |
0.12 |
n.v. |
|
RNA-binding protein 47 |
| 27754120 |
|
Rbm4b |
|
0 |
0 |
255 |
106 |
0 |
|
n.v. |
n.v. |
0.12 |
-0.2 |
n.v. |
|
RNA-binding protein 4B |
| 22507333 |
|
Rbm5 |
|
1995 |
0 |
186 |
0 |
0 |
|
0.37 |
n.v. |
0.1 |
n.v. |
n.v. |
|
RNA-binding protein 5 |
| 27753952 |
|
Rbm7 |
|
0 |
0 |
0 |
2963 |
0 |
|
n.v. |
n.v. |
n.v. |
0.11 |
n.v. |
|
RNA-binding protein 7 |
| 162287294 |
|
Rbm8a |
|
3936 |
2455 |
8638 |
14963 |
13419 |
|
0.09 |
0.15 |
0.17 |
0.23 |
0.14 |
|
RNA-binding protein 8A isoform b |
| 162287296 |
|
Rbm8a |
|
3936 |
2455 |
8771 |
14963 |
13419 |
|
0.09 |
0.15 |
0.16 |
0.23 |
0.14 |
|
RNA-binding protein 8A isoform a |
| 213513165 |
|
Rbms1 |
|
0 |
242 |
2641 |
1989 |
6447 |
|
n.v. |
0.19 |
0.25 |
-0.07 |
-0.01 |
|
RNA-binding motif, single-stranded-interacting protein 1
isoform 3 |
| 213513185 |
|
Rbms1 |
|
0 |
242 |
2641 |
1989 |
6447 |
|
n.v. |
0.19 |
0.25 |
-0.07 |
-0.01 |
|
RNA-binding motif, single-stranded-interacting protein 1
isoform 2 |
| 213513205 |
|
Rbms1 |
|
0 |
242 |
2641 |
1989 |
6447 |
|
n.v. |
0.19 |
0.25 |
-0.07 |
-0.01 |
|
RNA-binding motif, single-stranded-interacting protein 1
isoform 1 |
| 84872203 |
|
Rbms2 |
|
0 |
259 |
2870 |
0 |
0 |
|
n.v. |
-0.14 |
0.21 |
n.v. |
n.v. |
|
RNA-binding motif, single-stranded-interacting protein 2
isoform a |
| 84872207 |
|
Rbms2 |
|
0 |
259 |
2728 |
0 |
0 |
|
n.v. |
-0.14 |
0.2 |
n.v. |
n.v. |
|
RNA-binding motif, single-stranded-interacting protein 2
isoform b |
| 148747313 |
|
Rbms3 |
|
0 |
242 |
1699 |
1989 |
6447 |
|
n.v. |
0.19 |
0.16 |
-0.07 |
-0.01 |
|
RNA-binding motif, single-stranded-interacting protein 3
isoform 3 |
| 287324565 |
|
Rbms3 |
|
0 |
242 |
1699 |
1989 |
6447 |
|
n.v. |
0.19 |
0.16 |
-0.07 |
-0.01 |
|
RNA-binding motif, single-stranded-interacting protein 3
isoform 4 |
| 287324670 |
|
Rbms3 |
|
0 |
242 |
1699 |
1989 |
6447 |
|
n.v. |
0.19 |
0.16 |
-0.07 |
-0.01 |
|
RNA-binding motif, single-stranded-interacting protein 3
isoform 2 |
| 287324761 |
|
Rbms3 |
|
0 |
242 |
1699 |
1989 |
6447 |
|
n.v. |
0.19 |
0.16 |
-0.07 |
-0.01 |
|
RNA-binding motif, single-stranded-interacting protein 3
isoform 1 |
| 287324845 |
|
Rbms3 |
|
0 |
242 |
1699 |
1989 |
6447 |
|
n.v. |
0.19 |
0.16 |
-0.07 |
-0.01 |
|
RNA-binding motif, single-stranded-interacting protein 3
isoform 5 |
| 287324984 |
|
Rbms3 |
|
0 |
242 |
1699 |
1989 |
6447 |
|
n.v. |
0.19 |
0.16 |
-0.07 |
-0.01 |
|
RNA-binding motif, single-stranded-interacting protein 3
isoform 6 |
| 6755296 |
|
Rbmx |
|
251580 |
4200 |
6984 |
4216 |
193 |
|
0 |
-0.02 |
0.05 |
-0.07 |
-1.19 |
|
RNA-binding motif protein, X chromosome |
| 27734072 |
|
Rbmx2 |
|
0 |
0 |
0 |
270 |
0 |
|
n.v. |
n.v. |
n.v. |
0 |
n.v. |
|
RNA-binding motif protein, X-linked 2 |
| 83699420 |
|
Rbmxl1 |
|
259598 |
0 |
0 |
0 |
0 |
|
0 |
n.v. |
n.v. |
n.v. |
n.v. |
|
RNA binding motif protein, X-linked-like-1 |
| 83699420;355390287 |
|
Rbmxl1 |
|
0 |
0 |
7115 |
0 |
0 |
|
n.v. |
n.v. |
0.05 |
n.v. |
n.v. |
|
RNA binding motif protein, X-linked-like-1 |
| 355390287;83699420 |
|
Rbmxl1 |
|
0 |
4200 |
0 |
4216 |
193 |
|
n.v. |
-0.02 |
n.v. |
-0.07 |
-1.19 |
|
RNA binding motif protein, X-linked-like-1 |
| 6755300 |
|
Rbp1 |
|
0 |
0 |
345 |
0 |
0 |
|
n.v. |
n.v. |
-0.05 |
n.v. |
n.v. |
|
retinol-binding protein 1 |
| 555290065 |
|
Rbpms |
|
513 |
0 |
0 |
0 |
0 |
|
0.09 |
n.v. |
n.v. |
n.v. |
n.v. |
|
RNA-binding protein with multiple splicing isoform 4 |
| 111185961;33342267 |
|
Rbpms |
|
0 |
0 |
2802 |
0 |
0 |
|
n.v. |
n.v. |
0.05 |
n.v. |
n.v. |
|
RNA-binding protein with multiple splicing isoform 2 |
| 33342267 |
|
Rbpms |
|
513 |
1837 |
0 |
3454 |
31700 |
|
0.09 |
0.11 |
n.v. |
0.13 |
0.03 |
|
RNA-binding protein with multiple splicing isoform 1 |
| 111185959 |
|
Rbpms |
|
513 |
1837 |
2802 |
3454 |
31700 |
|
0.09 |
0.11 |
0.05 |
0.13 |
0.03 |
|
RNA-binding protein with multiple splicing isoform 3 |
| 155030209 |
|
Rc3h2 |
|
0 |
0 |
165 |
0 |
0 |
|
n.v. |
n.v. |
0.29 |
n.v. |
n.v. |
|
RING finger and CCCH-type zinc finger domain-containing
protein 2 |
| 169808411 |
|
Rcbtb1 |
|
0 |
0 |
0 |
8 |
0 |
|
n.v. |
n.v. |
n.v. |
3.66 |
n.v. |
|
RCC1 and BTB domain-containing protein 1 |
| 33239431 |
|
Rcc2 |
|
1355 |
854 |
10025 |
16584 |
20841 |
|
0.14 |
0.06 |
-0.04 |
0.08 |
0.02 |
|
protein RCC2 |
| 12963507 |
|
Rce1 |
|
0 |
8 |
0 |
0 |
0 |
|
n.v. |
-0.09 |
n.v. |
n.v. |
n.v. |
|
CAAX prenyl protease 2 |
| 13386058 |
|
Rchy1 |
|
0 |
2 |
32 |
0 |
1307 |
|
n.v. |
2.57 |
-0.01 |
n.v. |
0.15 |
|
RING finger and CHY zinc finger domain-containing protein
1 isoform 1 |
| 422398909 |
|
Rchy1 |
|
0 |
2 |
32 |
0 |
1307 |
|
n.v. |
2.57 |
-0.01 |
n.v. |
0.15 |
|
RING finger and CHY zinc finger domain-containing protein
1 isoform 2 |
| 506949339 |
|
Rcn2 |
|
1739 |
0 |
0 |
0 |
0 |
|
-0.09 |
n.v. |
n.v. |
n.v. |
n.v. |
|
reticulocalbin-2 isoform 2 precursor |
| 114205428 |
|
Rcn2 |
|
2325 |
2705 |
219 |
0 |
0 |
|
-0.07 |
-0.36 |
-1.08 |
n.v. |
n.v. |
|
reticulocalbin-2 isoform 1 precursor |
| 39930559 |
|
Rcor1 |
|
0 |
0 |
0 |
1261 |
0 |
|
n.v. |
n.v. |
n.v. |
0.09 |
n.v. |
|
REST corepressor 1 |
| 57634523 |
|
Rcor3 |
|
0 |
0 |
0 |
311 |
0 |
|
n.v. |
n.v. |
n.v. |
0.34 |
n.v. |
|
REST corepressor 3 |
| 25141231 |
|
Rdh10 |
|
0 |
301 |
2505 |
0 |
0 |
|
n.v. |
-0.01 |
-0.13 |
n.v. |
n.v. |
|
retinol dehydrogenase 10 |
| 19482172 |
|
Rdh11 |
|
10837 |
5056 |
4029 |
426 |
0 |
|
-0.07 |
-0.41 |
-0.31 |
-1.7 |
n.v. |
|
retinol dehydrogenase 11 precursor |
| 58037513 |
|
Rdh12 |
|
0 |
620 |
407 |
0 |
0 |
|
n.v. |
-0.2 |
-0.51 |
n.v. |
n.v. |
|
retinol dehydrogenase 12 precursor |
| 30425078 |
|
Rdh13 |
|
0 |
1635 |
0 |
0 |
0 |
|
n.v. |
-0.16 |
n.v. |
n.v. |
n.v. |
|
retinol dehydrogenase 13 precursor |
| 12963791 |
|
Rdh14 |
|
0 |
1532 |
407 |
0 |
0 |
|
n.v. |
-0.05 |
-0.51 |
n.v. |
n.v. |
|
retinol dehydrogenase 14 |
| 157277948 |
|
Rdx |
|
753842 |
104678 |
236846 |
102762 |
224054 |
|
0.13 |
-0.01 |
-0.21 |
-0.02 |
0.02 |
|
radixin isoform a |
| 157277952 |
|
Rdx |
|
718584 |
101088 |
198880 |
61515 |
208278 |
|
0.13 |
0.01 |
-0.21 |
-0.01 |
0.02 |
|
radixin isoform b |
| 110625690 |
|
Recql |
|
0 |
0 |
588 |
1424 |
5044 |
|
n.v. |
n.v. |
0.1 |
-0.03 |
-0.07 |
|
ATP-dependent DNA helicase Q1 isoform 1 |
| 326368214 |
|
Recql |
|
0 |
0 |
575 |
1424 |
5044 |
|
n.v. |
n.v. |
-0.02 |
-0.03 |
-0.07 |
|
ATP-dependent DNA helicase Q1 isoform 2 |
| 326368226 |
|
Recql |
|
0 |
0 |
575 |
1424 |
5044 |
|
n.v. |
n.v. |
-0.02 |
-0.03 |
-0.07 |
|
ATP-dependent DNA helicase Q1 isoform 3 |
| 30519927 |
|
Reep3 |
|
0 |
0 |
0 |
1817 |
0 |
|
n.v. |
n.v. |
n.v. |
-0.34 |
n.v. |
|
receptor expression-enhancing protein 3 isoform 2 |
| 326319958 |
|
Reep3 |
|
0 |
0 |
0 |
1817 |
0 |
|
n.v. |
n.v. |
n.v. |
-0.34 |
n.v. |
|
receptor expression-enhancing protein 3 isoform 1 |
| 161016826 |
|
Reep5 |
|
29711 |
5503 |
5125 |
5075 |
0 |
|
0.16 |
-0.12 |
-0.25 |
-0.41 |
n.v. |
|
receptor expression-enhancing protein 5 |
| 21314830 |
|
Reep6 |
|
62735 |
4803 |
3963 |
13613 |
43 |
|
0.04 |
-0.1 |
-0.3 |
-0.53 |
-0.42 |
|
receptor expression-enhancing protein 6 isoform 1 |
| 326368217 |
|
Reep6 |
|
62735 |
4803 |
3963 |
13654 |
43 |
|
0.04 |
-0.1 |
-0.3 |
-0.51 |
-0.42 |
|
receptor expression-enhancing protein 6 isoform 2 |
| 6677709 |
|
Rela |
|
0 |
0 |
294 |
0 |
82099 |
|
n.v. |
n.v. |
0.14 |
n.v. |
-0.04 |
|
transcription factor p65 |
| 110625912 |
|
Rell1 |
|
0 |
202 |
200 |
0 |
0 |
|
n.v. |
0.02 |
0.16 |
n.v. |
n.v. |
|
RELT-like protein 1 precursor |
| 257796226 |
|
Renbp |
|
27001 |
0 |
21757 |
0 |
37901 |
|
0 |
n.v. |
0.13 |
n.v. |
0.03 |
|
N-acylglucosamine 2-epimerase isoform 2 |
| 257796315 |
|
Renbp |
|
27001 |
0 |
21757 |
0 |
37901 |
|
0 |
n.v. |
0.13 |
n.v. |
0.03 |
|
N-acylglucosamine 2-epimerase isoform 1 |
| 161484650 |
|
Reps1 |
|
0 |
50 |
568 |
4060 |
10270 |
|
n.v. |
1.17 |
0.22 |
-0.01 |
-0.25 |
|
ralBP1-associated Eps domain-containing protein 1 isoform
1 |
| 161484652 |
|
Reps1 |
|
0 |
50 |
568 |
4060 |
10270 |
|
n.v. |
1.17 |
0.22 |
-0.01 |
-0.25 |
|
ralBP1-associated Eps domain-containing protein 1 isoform
2 |
| 84490401 |
|
Reps2 |
|
0 |
0 |
0 |
0 |
2977 |
|
n.v. |
n.v. |
n.v. |
n.v. |
-0.22 |
|
ralBP1-associated Eps domain-containing protein 2 |
| 13385882 |
|
Rer1 |
|
531 |
3102 |
3789 |
5967 |
0 |
|
-1.02 |
-0.12 |
-0.15 |
0.08 |
n.v. |
|
protein RER1 |
| 148234285 |
|
Rere |
|
0 |
0 |
0 |
0 |
728 |
|
n.v. |
n.v. |
n.v. |
n.v. |
-0.04 |
|
arginine-glutamic acid dipeptide repeats protein |
| 27229283 |
|
Rexo2 |
|
0 |
557 |
26 |
0 |
11159 |
|
n.v. |
0 |
0.03 |
n.v. |
0.15 |
|
oligoribonuclease, mitochondrial precursor |
| 76563952 |
|
Rexo4 |
|
0 |
0 |
37 |
0 |
0 |
|
n.v. |
n.v. |
-0.12 |
n.v. |
n.v. |
|
RNA exonuclease 4 |
| 188219597 |
|
Rfc1 |
|
11258 |
73 |
748 |
10036 |
0 |
|
0.12 |
-0.19 |
-0.29 |
-0.21 |
n.v. |
|
replication factor C subunit 1 |
| 11177922 |
|
Rfc2 |
|
5345 |
413 |
6215 |
46134 |
25392 |
|
-0.03 |
-0.31 |
-0.11 |
-0.08 |
0 |
|
replication factor C subunit 2 |
| 124249204 |
|
Rfc3 |
|
14480 |
0 |
4615 |
27569 |
8857 |
|
0.15 |
n.v. |
-0.13 |
0.05 |
-0.07 |
|
replication factor C subunit 3 |
| 21703948 |
|
Rfc4 |
|
5290 |
102 |
7902 |
73032 |
16011 |
|
0.1 |
0.03 |
-0.1 |
-0.06 |
0.01 |
|
replication factor C subunit 4 |
| 110625924 |
|
Rfc5 |
|
0 |
4413 |
5199 |
66197 |
17949 |
|
n.v. |
0 |
-0.12 |
-0.08 |
-0.05 |
|
replication factor C subunit 5 |
| 14149726 |
|
Rfk |
|
0 |
562 |
442 |
262 |
8064 |
|
n.v. |
0.33 |
0.32 |
0.19 |
0.39 |
|
riboflavin kinase |
| 239916007 |
|
Rfx1 |
|
934 |
27 |
1791 |
2644 |
3427 |
|
0 |
-0.04 |
-0.08 |
-0.08 |
-0.26 |
|
MHC class II regulatory factor RFX1 |
| 88703055 |
|
Rfx7 |
|
0 |
0 |
348 |
0 |
0 |
|
n.v. |
n.v. |
0.39 |
n.v. |
n.v. |
|
regulatory factor X domain containing 2 |
| 31982627 |
|
Rgl3 |
|
8494 |
8331 |
13858 |
81193 |
25564 |
|
-0.19 |
0.05 |
0.16 |
0.13 |
0.08 |
|
ral guanine nucleotide dissociation stimulator-like 3 |
| 170014730 |
|
Rhbdd1 |
|
128 |
50 |
6 |
0 |
0 |
|
0.21 |
-1.66 |
-1.11 |
n.v. |
n.v. |
|
rhomboid-related protein 4 |
| 22122463 |
|
Rhbdd2 |
|
0 |
94 |
0 |
0 |
0 |
|
n.v. |
-0.23 |
n.v. |
n.v. |
n.v. |
|
rhomboid domain-containing protein 2 |
| 28626508 |
|
Rheb |
|
2654 |
5430 |
2849 |
3839 |
7336 |
|
-0.19 |
0.07 |
-0.13 |
-0.85 |
0 |
|
GTP-binding protein Rheb precursor |
| 31542143 |
|
Rhoa |
|
127428 |
76263 |
72521 |
89214 |
213826 |
|
0.15 |
0.11 |
0.02 |
0.01 |
0.08 |
|
transforming protein RhoA precursor |
| 6680726 |
|
Rhob |
|
6517 |
6119 |
5673 |
164 |
2281 |
|
0.1 |
0.1 |
0.03 |
0.16 |
-0.11 |
|
rho-related GTP-binding protein RhoB precursor |
| 160415213 |
|
Rhoc |
|
123602 |
47967 |
70798 |
80677 |
217564 |
|
0.15 |
0.13 |
0.03 |
0.02 |
0.01 |
|
rho-related GTP-binding protein RhoC precursor |
| 6671573 |
|
Rhod |
|
0 |
86 |
569 |
0 |
0 |
|
n.v. |
-0.04 |
-0.39 |
n.v. |
n.v. |
|
rho-related GTP-binding protein RhoD precursor |
| 28201958 |
|
Rhof |
|
0 |
96 |
120 |
0 |
0 |
|
n.v. |
0.02 |
0.81 |
n.v. |
n.v. |
|
rho-related GTP-binding protein RhoF precursor |
| 9625037 |
|
Rhog |
|
1080 |
12003 |
32736 |
36262 |
2988 |
|
0.33 |
0.16 |
-0.07 |
-0.18 |
0.36 |
|
rho-related GTP-binding protein RhoG precursor |
| 13489097 |
|
Rhoj |
|
0 |
9145 |
22351 |
23599 |
1714 |
|
n.v. |
0.14 |
0.01 |
0.02 |
0.12 |
|
rho-related GTP-binding protein RhoJ precursor |
| 34328361 |
|
Rhoq |
|
0 |
9145 |
22351 |
23599 |
1714 |
|
n.v. |
0.14 |
0.01 |
0.02 |
0.12 |
|
rho-related GTP-binding protein RhoQ precursor |
| 254039727 |
|
Rhot1 |
|
3917 |
7434 |
1261 |
0 |
0 |
|
-0.04 |
-0.16 |
-0.23 |
n.v. |
n.v. |
|
mitochondrial Rho GTPase 1 isoform 2 |
| 254039729 |
|
Rhot1 |
|
3917 |
7434 |
1261 |
0 |
0 |
|
-0.04 |
-0.16 |
-0.23 |
n.v. |
n.v. |
|
mitochondrial Rho GTPase 1 isoform 3 |
| 31559891 |
|
Rhot1 |
|
3917 |
7434 |
1261 |
0 |
0 |
|
-0.04 |
-0.16 |
-0.23 |
n.v. |
n.v. |
|
mitochondrial Rho GTPase 1 isoform 1 |
| 22122457 |
|
Rhot2 |
|
3917 |
6448 |
1220 |
0 |
0 |
|
-0.04 |
-0.04 |
-0.23 |
n.v. |
n.v. |
|
mitochondrial Rho GTPase 2 |
| 229092577 |
|
Rhpn2 |
|
0 |
1607 |
2215 |
5165 |
54415 |
|
n.v. |
0.31 |
-0.1 |
-0.43 |
0 |
|
rhophilin-2 |
| 13385124 |
|
Ribc1 |
|
5473 |
0 |
1826 |
0 |
0 |
|
-0.06 |
n.v. |
-0.04 |
n.v. |
n.v. |
|
RIB43A-like with coiled-coils protein 1 |
| 16716495 |
|
Ric8 |
|
0 |
1996 |
4106 |
11034 |
0 |
|
n.v. |
0.23 |
0.21 |
-0.04 |
n.v. |
|
synembryn-A |
| 34147209 |
|
Ric8b |
|
0 |
0 |
0 |
516 |
0 |
|
n.v. |
n.v. |
n.v. |
-0.31 |
n.v. |
|
synembryn-B isoform 2 |
| 61806725 |
|
Ric8b |
|
0 |
0 |
0 |
516 |
0 |
|
n.v. |
n.v. |
n.v. |
-0.31 |
n.v. |
|
synembryn-B isoform 1 |
| 168480120 |
|
Rictor |
|
0 |
52 |
637 |
16 |
0 |
|
n.v. |
0.39 |
0.12 |
-0.29 |
n.v. |
|
rapamycin-insensitive companion of mTOR |
| 71480154 |
|
Rilp |
|
0 |
812 |
1122 |
0 |
0 |
|
n.v. |
-0.17 |
-0.02 |
n.v. |
n.v. |
|
rab-interacting lysosomal protein |
| 10946796 |
|
Rilpl1 |
|
0 |
0 |
51 |
0 |
3149 |
|
n.v. |
n.v. |
-0.58 |
n.v. |
0.01 |
|
RILP-like protein 1 |
| 21703974 |
|
Rin1 |
|
0 |
0 |
13 |
1613 |
0 |
|
n.v. |
n.v. |
0.29 |
0.1 |
n.v. |
|
ras and Rab interactor 1 |
| 224967114 |
|
Rin2 |
|
0 |
0 |
59 |
0 |
0 |
|
n.v. |
n.v. |
-0.09 |
n.v. |
n.v. |
|
ras and Rab interactor 2 |
| 238624151 |
|
Rin3 |
|
0 |
0 |
0 |
0 |
728 |
|
n.v. |
n.v. |
n.v. |
n.v. |
0.11 |
|
ras and Rab interactor 3 isoform 1 |
| 238624153 |
|
Rin3 |
|
0 |
0 |
0 |
0 |
728 |
|
n.v. |
n.v. |
n.v. |
n.v. |
0.11 |
|
ras and Rab interactor 3 isoform 2 |
| 226958428 |
|
Ring1 |
|
0 |
0 |
1 |
33 |
246 |
|
n.v. |
n.v. |
0.02 |
-0.11 |
-0.13 |
|
E3 ubiquitin-protein ligase RING1 |
| 62899067 |
|
Rint1 |
|
0 |
0 |
427 |
0 |
0 |
|
n.v. |
n.v. |
-0.3 |
n.v. |
n.v. |
|
RAD50-interacting protein 1 |
| 22208995 |
|
Riok1 |
|
0 |
0 |
0 |
1334 |
0 |
|
n.v. |
n.v. |
n.v. |
0.02 |
n.v. |
|
serine/threonine-protein kinase RIO1 |
| 34328467 |
|
Ripk1 |
|
0 |
0 |
0 |
0 |
535 |
|
n.v. |
n.v. |
n.v. |
n.v. |
0.72 |
|
receptor-interacting serine/threonine-protein kinase 1 |
| 31560255 |
|
Rmdn1 |
|
0 |
841 |
0 |
0 |
0 |
|
n.v. |
0.04 |
n.v. |
n.v. |
n.v. |
|
regulator of microtubule dynamics protein 1 |
| 41235741 |
|
Rmdn2 |
|
0 |
0 |
114 |
0 |
0 |
|
n.v. |
n.v. |
0 |
n.v. |
n.v. |
|
regulator of microtubule dynamics protein 2 |
| 85701644 |
|
Rmdn3 |
|
0 |
1136 |
0 |
0 |
0 |
|
n.v. |
-0.56 |
n.v. |
n.v. |
n.v. |
|
regulator of microtubule dynamics protein 3 |
| 267844815 |
|
Rmnd5a |
|
0 |
0 |
0 |
7989 |
0 |
|
n.v. |
n.v. |
n.v. |
0.15 |
n.v. |
|
protein RMD5 homolog A |
| 226246542 |
|
Rnaseh1 |
|
0 |
0 |
0 |
0 |
1617 |
|
n.v. |
n.v. |
n.v. |
n.v. |
-0.01 |
|
ribonuclease H1 |
| 58037175 |
|
Rnaseh2a |
|
0 |
307 |
12 |
131 |
578 |
|
n.v. |
0.49 |
-0.48 |
0.09 |
0.12 |
|
ribonuclease H2 subunit A |
| 58037097 |
|
Rnaseh2b |
|
0 |
405 |
764 |
7383 |
23839 |
|
n.v. |
-1.19 |
0.1 |
0.09 |
-0.29 |
|
ribonuclease H2 subunit B |
| 13386102 |
|
Rnaseh2c |
|
0 |
0 |
34 |
794 |
3373 |
|
n.v. |
n.v. |
-1.23 |
0.17 |
0.03 |
|
ribonuclease H2 subunit C |
| 33239393 |
|
Rnasek |
|
769 |
0 |
634 |
0 |
0 |
|
0.02 |
n.v. |
-0.1 |
n.v. |
n.v. |
|
ribonuclease kappa |
| 21311883 |
|
Rnaset2b |
|
2178 |
1142 |
499 |
0 |
5419 |
|
0.25 |
-0.05 |
-0.18 |
n.v. |
-0.1 |
|
ribonuclease T2B precursor |
| 7305435 |
|
Rnf11 |
|
0 |
35 |
59 |
0 |
0 |
|
n.v. |
-0.95 |
-0.11 |
n.v. |
n.v. |
|
RING finger protein 11 |
| 20127402 |
|
Rnf112 |
|
0 |
0 |
597 |
0 |
0 |
|
n.v. |
n.v. |
0.08 |
n.v. |
n.v. |
|
RING finger protein 112 |
| 23943840 |
|
Rnf113a1 |
|
0 |
0 |
0 |
0 |
557 |
|
n.v. |
n.v. |
n.v. |
n.v. |
-0.11 |
|
RING finger protein 113A |
| 88759341 |
|
Rnf113a2 |
|
0 |
0 |
0 |
0 |
15347 |
|
n.v. |
n.v. |
n.v. |
n.v. |
0.22 |
|
ring finger protein 113A2 |
| 27229275 |
|
Rnf114 |
|
0 |
109 |
0 |
0 |
30137 |
|
n.v. |
-0.01 |
n.v. |
n.v. |
0.02 |
|
RING finger protein 114 |
| 70778932 |
|
Rnf121 |
|
0 |
69 |
0 |
0 |
0 |
|
n.v. |
0.21 |
n.v. |
n.v. |
n.v. |
|
RING finger protein 121 |
| 21362321 |
|
Rnf126 |
|
0 |
0 |
0 |
0 |
867 |
|
n.v. |
n.v. |
n.v. |
n.v. |
0.43 |
|
RING finger protein 126 |
| 31981195 |
|
Rnf130 |
|
4503 |
524 |
17863 |
0 |
0 |
|
-0.03 |
0.32 |
0.19 |
n.v. |
n.v. |
|
E3 ubiquitin-protein ligase RNF130 precursor |
| 46488939 |
|
Rnf138 |
|
0 |
0 |
0 |
0 |
129 |
|
n.v. |
n.v. |
n.v. |
n.v. |
0 |
|
E3 ubiquitin-protein ligase RNF138 isoform 2 |
| 46488941 |
|
Rnf138 |
|
0 |
0 |
0 |
0 |
129 |
|
n.v. |
n.v. |
n.v. |
n.v. |
0 |
|
E3 ubiquitin-protein ligase RNF138 isoform 1 |
| 257471032 |
|
Rnf14 |
|
0 |
0 |
80 |
0 |
610 |
|
n.v. |
n.v. |
0.2 |
n.v. |
0.06 |
|
E3 ubiquitin-protein ligase RNF14 isoform a |
| 255003680 |
|
Rnf157 |
|
0 |
0 |
0 |
1203 |
857 |
|
n.v. |
n.v. |
n.v. |
0.32 |
0.1 |
|
RING finger protein 157 |
| 47059206 |
|
Rnf181 |
|
0 |
0 |
0 |
524 |
471 |
|
n.v. |
n.v. |
n.v. |
0.51 |
-1.21 |
|
E3 ubiquitin-protein ligase RNF181 |
| 33563274 |
|
Rnf2 |
|
531 |
0 |
0 |
0 |
0 |
|
0.15 |
n.v. |
n.v. |
n.v. |
n.v. |
|
E3 ubiquitin-protein ligase RING2 |
| 33859829 |
|
Rnf20 |
|
0 |
0 |
224 |
0 |
7861 |
|
n.v. |
n.v. |
-0.11 |
n.v. |
-0.19 |
|
E3 ubiquitin-protein ligase BRE1A |
| 309262466 |
|
Rnf213 |
|
0 |
8150 |
70135 |
218440 |
4691 |
|
n.v. |
0.2 |
0.07 |
-0.01 |
-0.18 |
|
PREDICTED: LOW QUALITY PROTEIN: E3 ubiquitin-protein
ligase RNF213 |
| 30520119 |
|
Rnf214 |
|
0 |
0 |
506 |
0 |
3074 |
|
n.v. |
n.v. |
0.09 |
n.v. |
0.05 |
|
RING finger protein 214 |
| 40254409 |
|
Rnf31 |
|
0 |
0 |
0 |
0 |
643 |
|
n.v. |
n.v. |
n.v. |
n.v. |
-0.05 |
|
E3 ubiquitin-protein ligase RNF31 |
| 229093990 |
|
Rnf40 |
|
0 |
0 |
0 |
0 |
3909 |
|
n.v. |
n.v. |
n.v. |
n.v. |
-0.39 |
|
E3 ubiquitin-protein ligase BRE1B |
| 110625597 |
|
Rnf7 |
|
0 |
0 |
0 |
892 |
2046 |
|
n.v. |
n.v. |
n.v. |
-0.04 |
0.07 |
|
RING-box protein 2 |
| 158186608 |
|
Rnft2 |
|
0 |
0 |
0 |
0 |
17296 |
|
n.v. |
n.v. |
n.v. |
n.v. |
0.16 |
|
RING finger and transmembrane domain-containing protein 2
isoform 2 |
| 158186791 |
|
Rnft2 |
|
0 |
0 |
0 |
0 |
17296 |
|
n.v. |
n.v. |
n.v. |
n.v. |
0.16 |
|
RING finger and transmembrane domain-containing protein 2
isoform 1 |
| 6755342 |
|
Rngtt |
|
0 |
0 |
12 |
0 |
0 |
|
n.v. |
n.v. |
0.55 |
n.v. |
n.v. |
|
mRNA-capping enzyme |
| 285402659 |
|
Rnh1 |
|
293 |
7590 |
14215 |
0 |
300059 |
|
-0.29 |
0.22 |
0.04 |
n.v. |
0.13 |
|
ribonuclease inhibitor isoform b |
| 31981748 |
|
Rnh1 |
|
293 |
7590 |
14215 |
0 |
286244 |
|
-0.29 |
0.22 |
0.04 |
n.v. |
0.13 |
|
ribonuclease inhibitor isoform a |
| 13385938 |
|
Rnmt |
|
0 |
159 |
174 |
1490 |
26902 |
|
n.v. |
0.27 |
0.13 |
0.06 |
0.03 |
|
mRNA cap guanine-N7 methyltransferase isoform 1 |
| 283945577 |
|
Rnmt |
|
0 |
159 |
174 |
1490 |
26238 |
|
n.v. |
0.27 |
0.13 |
0.06 |
0.02 |
|
mRNA cap guanine-N7 methyltransferase isoform 2 |
| 166197675 |
|
Rnmtl1 |
|
0 |
136 |
0 |
0 |
0 |
|
n.v. |
0.51 |
n.v. |
n.v. |
n.v. |
|
RNA methyltransferase-like protein 1 |
| 227499234 |
|
Rnpep |
|
0 |
6066 |
5350 |
1506 |
52680 |
|
n.v. |
0.27 |
-0.02 |
-0.76 |
0.12 |
|
aminopeptidase B isoform 2 |
| 227499103 |
|
Rnpep |
|
92 |
6302 |
5748 |
2005 |
56268 |
|
1.25 |
0.29 |
-0.02 |
0.56 |
0.1 |
|
aminopeptidase B isoform 1 |
| 318065085 |
|
Rnpepl1 |
|
0 |
0 |
168 |
0 |
0 |
|
n.v. |
n.v. |
-0.16 |
n.v. |
n.v. |
|
arginyl aminopeptidase-like 1 |
| 121674793 |
|
Rnps1 |
|
0 |
2428 |
638 |
3487 |
0 |
|
n.v. |
0.21 |
0.14 |
-0.08 |
n.v. |
|
RNA-binding protein with serine-rich domain 1 isoform 1 |
| 121674799 |
|
Rnps1 |
|
0 |
2428 |
638 |
3487 |
0 |
|
n.v. |
0.21 |
0.14 |
-0.08 |
n.v. |
|
RNA-binding protein with serine-rich domain 1 isoform 2 |
| 6677759 |
|
Rock1 |
|
0 |
15 |
1406 |
7621 |
24557 |
|
n.v. |
0.01 |
0.11 |
-0.04 |
-0.18 |
|
rho-associated protein kinase 1 |
| 134949013 |
|
Rock2 |
|
0 |
100 |
5501 |
34625 |
100402 |
|
n.v. |
-0.17 |
0.04 |
0.14 |
-0.17 |
|
rho-associated protein kinase 2 |
| 119508431 |
|
Rogdi |
|
0 |
0 |
0 |
434 |
0 |
|
n.v. |
n.v. |
n.v. |
0.49 |
n.v. |
|
protein rogdi homolog |
| 255958213 |
|
Romo1 |
|
476 |
0 |
0 |
0 |
0 |
|
0 |
n.v. |
n.v. |
n.v. |
n.v. |
|
reactive oxygen species modulator 1 |
| 255958215 |
|
Romo1 |
|
0 |
1407 |
0 |
0 |
0 |
|
n.v. |
-0.17 |
n.v. |
n.v. |
n.v. |
|
reactive oxygen species modulator 1 |
| 255958213;255958215 |
|
Romo1 |
|
0 |
0 |
426 |
0 |
0 |
|
n.v. |
n.v. |
-0.31 |
n.v. |
n.v. |
|
reactive oxygen species modulator 1 |
| 19526820 |
|
Rp2h |
|
0 |
58 |
3736 |
0 |
0 |
|
n.v. |
0.08 |
-0.12 |
n.v. |
n.v. |
|
protein XRP2 |
| 9055300 |
|
Rp9 |
|
0 |
73 |
0 |
0 |
0 |
|
n.v. |
-0.19 |
n.v. |
n.v. |
n.v. |
|
retinitis pigmentosa 9 protein homolog |
| 18390321 |
|
Rpa1 |
|
0 |
5711 |
8051 |
32529 |
89114 |
|
n.v. |
0.23 |
0.01 |
0.12 |
0 |
|
replication protein A 70 kDa DNA-binding subunit isoform
2 |
| 255982530 |
|
Rpa1 |
|
0 |
5711 |
8051 |
32529 |
89114 |
|
n.v. |
0.23 |
0.01 |
0.12 |
0 |
|
replication protein A 70 kDa DNA-binding subunit isoform
1 |
| 110625961 |
|
Rpa2 |
|
0 |
499 |
244 |
13302 |
28659 |
|
n.v. |
0.65 |
-0.06 |
0.41 |
-0.01 |
|
replication protein A 32 kDa subunit |
| 13386122 |
|
Rpa3 |
|
0 |
332 |
546 |
1195 |
14297 |
|
n.v. |
0.13 |
0.02 |
0.09 |
-0.06 |
|
replication protein A 14 kDa subunit |
| 254540043 |
|
Rpap2 |
|
0 |
0 |
1258 |
33 |
0 |
|
n.v. |
n.v. |
0.33 |
0 |
n.v. |
|
putative RNA polymerase II subunit B1 CTD phosphatase
Rpap2 isoform A |
| 254540045 |
|
Rpap2 |
|
0 |
0 |
1258 |
33 |
0 |
|
n.v. |
n.v. |
0.33 |
0 |
n.v. |
|
putative RNA polymerase II subunit B1 CTD phosphatase
Rpap2 isoform B |
| 13386276 |
|
Rpap3 |
|
0 |
0 |
1131 |
17935 |
11 |
|
n.v. |
n.v. |
-0.11 |
0.1 |
0.62 |
|
RNA polymerase II-associated protein 3 |
| 27532955 |
|
Rpe |
|
0 |
0 |
603 |
7965 |
20873 |
|
n.v. |
n.v. |
0.06 |
0.07 |
0.08 |
|
ribulose-phosphate 3-epimerase |
| 94536844 |
|
Rpia |
|
0 |
106 |
236 |
0 |
14179 |
|
n.v. |
0.1 |
-0.15 |
n.v. |
-0.02 |
|
ribose-5-phosphate isomerase |
| 16418339 |
|
Rpl10 |
|
75659 |
12222 |
79322 |
158702 |
0 |
|
-0.07 |
0.16 |
0.25 |
-0.1 |
n.v. |
|
60S ribosomal protein L10 |
| 255003735 |
|
Rpl10a |
|
120216 |
37383 |
126146 |
407174 |
675 |
|
0.02 |
0.19 |
0.27 |
-0.14 |
-0.06 |
|
60S ribosomal protein L10a |
| 242397462 |
|
Rpl10l |
|
46717 |
9365 |
62272 |
116693 |
0 |
|
0.02 |
0.17 |
0.23 |
-0.09 |
n.v. |
|
60S ribosomal protein L10-like |
| 13385408 |
|
Rpl11 |
|
205467 |
6450 |
33574 |
52543 |
2356 |
|
-0.07 |
0.09 |
0.25 |
-0.32 |
-0.21 |
|
60S ribosomal protein L11 |
| 160333553 |
|
Rpl12 |
|
310745 |
37060 |
155953 |
196445 |
5537 |
|
0 |
0.02 |
0.19 |
-0.18 |
-0.21 |
|
60S ribosomal protein L12 |
| 33186863 |
|
Rpl13 |
|
365022 |
43464 |
257487 |
497437 |
0 |
|
0.02 |
0.09 |
0.23 |
-0.23 |
n.v. |
|
60S ribosomal protein L13 |
| 31981945 |
|
Rpl13a |
|
135117 |
27012 |
178965 |
365674 |
0 |
|
0.07 |
0.13 |
0.2 |
-0.1 |
n.v. |
|
60S ribosomal protein L13a |
| 13385472 |
|
Rpl14 |
|
166749 |
39909 |
120434 |
471439 |
0 |
|
-0.06 |
0.08 |
0.16 |
-0.14 |
n.v. |
|
60S ribosomal protein L14 |
| 13385036 |
|
Rpl15 |
|
113168 |
45957 |
109052 |
166846 |
0 |
|
0.03 |
0.15 |
0.23 |
0.03 |
n.v. |
|
60S ribosomal protein L15 |
| 161484662 |
|
Rpl17 |
|
184360 |
21412 |
89361 |
281919 |
0 |
|
0.02 |
0.2 |
0.29 |
-0.14 |
n.v. |
|
60S ribosomal protein L17 |
| 83699424 |
|
Rpl18 |
|
447600 |
53054 |
249467 |
182825 |
0 |
|
0.01 |
0.11 |
0.2 |
-0.27 |
n.v. |
|
60S ribosomal protein L18 |
| 58037465 |
|
Rpl18a |
|
126495 |
19015 |
87606 |
295196 |
0 |
|
-0.04 |
0.1 |
0.25 |
-0.13 |
n.v. |
|
60S ribosomal protein L18a |
| 226958653 |
|
Rpl19 |
|
244880 |
6033 |
88998 |
102843 |
0 |
|
-0.03 |
0.21 |
0.22 |
-0.12 |
n.v. |
|
60S ribosomal protein L19 isoform 1 |
| 226958657 |
|
Rpl19 |
|
244880 |
6033 |
88998 |
102835 |
0 |
|
-0.03 |
0.21 |
0.22 |
-0.1 |
n.v. |
|
60S ribosomal protein L19 isoform 2 |
| 31560385 |
|
Rpl21 |
|
73096 |
37454 |
114846 |
267119 |
0 |
|
-0.01 |
0.16 |
0.2 |
-0.15 |
n.v. |
|
60S ribosomal protein L21 |
| 459683845 |
|
Rpl22 |
|
81480 |
17771 |
21452 |
0 |
0 |
|
-0.11 |
0.08 |
0.17 |
n.v. |
n.v. |
|
60S ribosomal protein L22 isoform b |
| 459683847 |
|
Rpl22 |
|
81480 |
17771 |
21420 |
0 |
0 |
|
-0.11 |
0.08 |
0.17 |
n.v. |
n.v. |
|
60S ribosomal protein L22 isoform c |
| 13386010 |
|
Rpl22l1 |
|
11386 |
2309 |
48320 |
71345 |
0 |
|
0.13 |
0.1 |
0.26 |
-0.03 |
n.v. |
|
60S ribosomal protein L22-like 1 |
| 46430508 |
|
Rpl23a |
|
150274 |
57056 |
182479 |
525128 |
1810 |
|
0.09 |
0.15 |
0.27 |
-0.11 |
-0.72 |
|
60S ribosomal protein L23a |
| 18250296 |
|
Rpl24 |
|
93690 |
35534 |
151562 |
305084 |
535 |
|
-0.05 |
0.09 |
0.19 |
-0.19 |
-0.53 |
|
60S ribosomal protein L24 |
| 6677777 |
|
Rpl26 |
|
78844 |
52827 |
132223 |
331393 |
0 |
|
-0.04 |
0.08 |
0.24 |
-0.11 |
n.v. |
|
60S ribosomal protein L26 |
| 8567400 |
|
Rpl27 |
|
157487 |
38277 |
140774 |
223294 |
0 |
|
0.07 |
0.12 |
0.2 |
-0.12 |
n.v. |
|
60S ribosomal protein L27 |
| 31560517 |
|
Rpl27a |
|
155766 |
5837 |
68791 |
315553 |
0 |
|
0 |
0.16 |
0.23 |
-0.09 |
n.v. |
|
60S ribosomal protein L27a |
| 6677779 |
|
Rpl28 |
|
19295 |
13968 |
73327 |
142715 |
0 |
|
0.03 |
0.14 |
0.22 |
-0.09 |
n.v. |
|
60S ribosomal protein L28 |
| 255308899 |
|
Rpl3 |
|
240925 |
45347 |
419456 |
405382 |
0 |
|
-0.06 |
0.17 |
0.23 |
-0.1 |
n.v. |
|
60S ribosomal protein L3 |
| 6677783 |
|
Rpl30 |
|
200414 |
21370 |
130925 |
483423 |
793 |
|
-0.01 |
0.12 |
0.24 |
-0.07 |
-0.66 |
|
60S ribosomal protein L30 |
| 16716589;356582309 |
|
Rpl31 |
|
124316 |
0 |
116780 |
0 |
0 |
|
0 |
n.v. |
0.21 |
n.v. |
n.v. |
|
60S ribosomal protein L31 |
| 356582309 |
|
Rpl31 |
|
0 |
8089 |
0 |
114238 |
1210 |
|
n.v. |
0.09 |
n.v. |
-0.18 |
-1.1 |
|
60S ribosomal protein L31 |
| 386365497 |
|
Rpl31-ps12 |
|
41189 |
238 |
7710 |
32210 |
0 |
|
0.01 |
0.12 |
0.29 |
-0.12 |
n.v. |
|
predicted gene, EG665562 |
| 25742730 |
|
Rpl32 |
|
112234 |
8705 |
69910 |
112437 |
0 |
|
-0.06 |
0.25 |
0.21 |
-0.15 |
n.v. |
|
60S ribosomal protein L32 |
| 55741555 |
|
Rpl34 |
|
18324 |
14147 |
94781 |
391385 |
0 |
|
0.05 |
0.12 |
0.17 |
-0.1 |
n.v. |
|
60S ribosomal protein L34 isoform 2 |
| 13385044 |
|
Rpl35 |
|
84629 |
6000 |
105224 |
48516 |
0 |
|
0.03 |
0.24 |
0.19 |
-0.11 |
n.v. |
|
60S ribosomal protein L35 |
| 160333837 |
|
Rpl36 |
|
40072 |
46088 |
100334 |
445786 |
0 |
|
0.14 |
0.16 |
0.23 |
-0.1 |
n.v. |
|
60S ribosomal protein L36 |
| 9845295;13385038 |
|
Rpl36a |
|
45985 |
0 |
37799 |
0 |
0 |
|
-0.05 |
n.v. |
0.22 |
n.v. |
n.v. |
|
60S ribosomal protein L36a |
| 13385038 |
|
Rpl36al |
|
0 |
1117 |
0 |
31498 |
0 |
|
n.v. |
0.14 |
n.v. |
-0.11 |
n.v. |
|
ribosomal protein L36A-like |
| 6677785 |
|
Rpl37a |
|
25830 |
969 |
17703 |
4592 |
0 |
|
0.06 |
0.15 |
0.24 |
-0.02 |
n.v. |
|
60S ribosomal protein L37a |
| 12963655 |
|
Rpl38 |
|
50653 |
19343 |
46364 |
60295 |
0 |
|
0.17 |
0.25 |
0.32 |
-0.02 |
n.v. |
|
60S ribosomal protein L38 |
| 13384820 |
|
Rpl3l |
|
8567 |
1605 |
18725 |
2660 |
0 |
|
-0.01 |
0.03 |
0.26 |
-0.02 |
n.v. |
|
ribosomal protein L3-like isoform 2 |
| 255653009 |
|
Rpl3l |
|
8567 |
1605 |
16894 |
2660 |
0 |
|
-0.01 |
0.03 |
0.27 |
-0.02 |
n.v. |
|
ribosomal protein L3-like isoform 1 |
| 30794450 |
|
Rpl4 |
|
582314 |
136436 |
417321 |
939048 |
0 |
|
0.04 |
0.18 |
0.24 |
-0.06 |
n.v. |
|
60S ribosomal protein L4 |
| 23956082 |
|
Rpl5 |
|
169001 |
54726 |
167149 |
613451 |
2720 |
|
-0.04 |
0.15 |
0.26 |
-0.11 |
0.06 |
|
60S ribosomal protein L5 |
| 84662736 |
|
Rpl6 |
|
279643 |
106772 |
212653 |
1095146 |
0 |
|
-0.01 |
0.1 |
0.21 |
-0.17 |
n.v. |
|
60S ribosomal protein L6 |
| 31981515 |
|
Rpl7 |
|
540247 |
65429 |
230470 |
1010876 |
0 |
|
0 |
0.12 |
0.25 |
-0.1 |
n.v. |
|
60S ribosomal protein L7 |
| 7305443 |
|
Rpl7a |
|
478153 |
58459 |
278786 |
617085 |
0 |
|
-0.03 |
0.2 |
0.29 |
-0.16 |
n.v. |
|
60S ribosomal protein L7a |
| 27754134 |
|
Rpl7l1 |
|
0 |
0 |
0 |
1220 |
0 |
|
n.v. |
n.v. |
n.v. |
-0.11 |
n.v. |
|
60S ribosomal protein L7-like 1 |
| 6755358 |
|
Rpl8 |
|
314461 |
10264 |
109152 |
88527 |
0 |
|
-0.02 |
0.13 |
0.23 |
-0.16 |
n.v. |
|
60S ribosomal protein L8 |
| 14149647 |
|
Rpl9 |
|
310470 |
24601 |
122369 |
105471 |
0 |
|
-0.04 |
-0.11 |
0.18 |
-0.16 |
n.v. |
|
60S ribosomal protein L9 |
| 6671569 |
|
Rplp0 |
|
255589 |
138525 |
309871 |
461731 |
6265 |
|
-0.04 |
0.05 |
0.17 |
-0.14 |
-0.24 |
|
60S acidic ribosomal protein P0 |
| 9256519 |
|
Rplp1 |
|
25299 |
507 |
18982 |
31866 |
2892 |
|
-0.07 |
0.92 |
0.2 |
-0.16 |
-0.24 |
|
60S acidic ribosomal protein P1 |
| 83745120 |
|
Rplp2 |
|
139217 |
16337 |
60097 |
151940 |
8985 |
|
0.13 |
0.23 |
0.26 |
-0.05 |
-0.39 |
|
60S acidic ribosomal protein P2 |
| 282398108 |
|
Rpn1 |
|
335842 |
60077 |
60360 |
8186 |
0 |
|
-0.04 |
-0.29 |
-0.36 |
-0.68 |
n.v. |
|
dolichyl-diphosphooligosaccharide--protein
glycosyltransferase subunit 1 precursor |
| 34996495 |
|
Rpn2 |
|
319916 |
22113 |
21948 |
2767 |
0 |
|
0.01 |
-0.24 |
-0.32 |
-0.31 |
n.v. |
|
dolichyl-diphosphooligosaccharide--protein
glycosyltransferase subunit 2 precursor |
| 13385432 |
|
Rpp14 |
|
0 |
0 |
0 |
172 |
0 |
|
n.v. |
n.v. |
n.v. |
-0.33 |
n.v. |
|
ribonuclease P protein subunit p14 |
| 13385804 |
|
Rpp21 |
|
0 |
0 |
0 |
336 |
0 |
|
n.v. |
n.v. |
n.v. |
0.28 |
n.v. |
|
ribonuclease P protein subunit p21 |
| 227430284 |
|
Rpp25l |
|
0 |
69 |
244 |
622 |
0 |
|
n.v. |
0.2 |
-0.04 |
0.04 |
n.v. |
|
ribonuclease P protein subunit p25-like protein |
| 257196209 |
|
Rpp30 |
|
0 |
276 |
423 |
13547 |
139 |
|
n.v. |
0.06 |
-0.11 |
0.04 |
0 |
|
ribonuclease P protein subunit p30 |
| 247300905 |
|
Rpp38 |
|
0 |
0 |
394 |
14398 |
0 |
|
n.v. |
n.v. |
-0.13 |
-0.01 |
n.v. |
|
ribonuclease P protein subunit p38 |
| 172072663 |
|
Rpp40 |
|
0 |
0 |
455 |
1105 |
396 |
|
n.v. |
n.v. |
-0.09 |
0.47 |
-0.66 |
|
ribonuclease P protein subunit p40 |
| 21450083 |
|
Rprd1a |
|
421 |
472 |
0 |
606 |
782 |
|
-0.74 |
-0.01 |
n.v. |
-0.02 |
-0.06 |
|
regulation of nuclear pre-mRNA domain-containing protein
1A |
| 34328077 |
|
Rprd1b |
|
11423 |
6599 |
3522 |
19801 |
76273 |
|
0.06 |
-0.01 |
-0.03 |
-0.02 |
-0.06 |
|
regulation of nuclear pre-mRNA domain-containing protein
1B |
| 124486841 |
|
Rprd2 |
|
805 |
0 |
0 |
0 |
0 |
|
-0.57 |
n.v. |
n.v. |
n.v. |
n.v. |
|
regulation of nuclear pre-mRNA domain-containing protein
2 |
| 13399310 |
|
Rps10 |
|
64071 |
10268 |
43335 |
217458 |
0 |
|
0.1 |
0.47 |
0.24 |
-0.22 |
n.v. |
|
40S ribosomal protein S10 |
| 21426889 |
|
Rps11 |
|
99896 |
31820 |
143089 |
408059 |
0 |
|
0.03 |
0.1 |
0.29 |
-0.06 |
n.v. |
|
40S ribosomal protein S11 |
| 40254577 |
|
Rps12 |
|
107163 |
18189 |
116908 |
248653 |
1788 |
|
0.02 |
0.18 |
0.23 |
-0.11 |
0.09 |
|
40S ribosomal protein S12 |
| 149258592 |
|
Rps12l2 |
|
59916 |
3238 |
53618 |
158972 |
1510 |
|
0 |
0.11 |
0.17 |
-0.12 |
0.09 |
|
PREDICTED: 40S ribosomal protein S12-like |
| 149250091 |
|
Rps12-ps10 |
|
107163 |
18189 |
116908 |
248653 |
1788 |
|
0.02 |
0.18 |
0.23 |
-0.11 |
0.09 |
|
PREDICTED: 40S ribosomal protein S12-like |
| 51772387 |
|
Rps12-ps11 |
|
98377 |
17431 |
104320 |
190044 |
1788 |
|
0.02 |
0.18 |
0.23 |
-0.11 |
0.09 |
|
PREDICTED: 40S ribosomal protein S12-like |
| 149272239 |
|
Rps12-ps16 |
|
98377 |
17431 |
104320 |
211580 |
1788 |
|
0.02 |
0.18 |
0.23 |
-0.11 |
0.09 |
|
PREDICTED: 40S ribosomal protein S12-like isoform 1 |
| 13386034 |
|
Rps13 |
|
146613 |
51449 |
132826 |
231930 |
0 |
|
0 |
0.12 |
0.25 |
-0.15 |
n.v. |
|
40S ribosomal protein S13 |
| 31981100 |
|
Rps14 |
|
232157 |
30056 |
179479 |
233919 |
1917 |
|
0 |
0.13 |
0.26 |
-0.19 |
-0.76 |
|
40S ribosomal protein S14 |
| 6677799 |
|
Rps15 |
|
604 |
2042 |
10924 |
96524 |
0 |
|
0.07 |
0.31 |
0.35 |
-0.03 |
n.v. |
|
40S ribosomal protein S15 |
| 24762230 |
|
Rps15a |
|
205320 |
58068 |
180474 |
240459 |
2260 |
|
-0.05 |
0.1 |
0.2 |
-0.11 |
-1.94 |
|
40S ribosomal protein S15a |
| 309265366 |
|
Rps15a-ps5 |
|
128417 |
29910 |
82152 |
194718 |
2260 |
|
-0.13 |
-0.15 |
0.16 |
-0.15 |
-1.94 |
|
PREDICTED: 40S ribosomal protein S15a-like |
| 158966704 |
|
Rps16 |
|
273730 |
95994 |
227132 |
698474 |
0 |
|
0.06 |
0.13 |
0.21 |
-0.1 |
n.v. |
|
40S ribosomal protein S16 |
| 6677801 |
|
Rps17 |
|
85141 |
18516 |
167332 |
414812 |
268 |
|
0.18 |
0.19 |
0.25 |
-0.14 |
-0.77 |
|
40S ribosomal protein S17 |
| 6755368 |
|
Rps18 |
|
540412 |
49620 |
285147 |
453079 |
2442 |
|
-0.1 |
0.09 |
0.21 |
-0.19 |
-2.08 |
|
40S ribosomal protein S18 |
| 12963511 |
|
Rps19 |
|
181413 |
44848 |
235066 |
346847 |
1992 |
|
0 |
0.24 |
0.2 |
-0.14 |
-1.62 |
|
40S ribosomal protein S19 |
| 30424711 |
|
Rps19bp1 |
|
0 |
73 |
224 |
917 |
75 |
|
n.v. |
-0.07 |
-0.05 |
-0.16 |
-0.14 |
|
active regulator of SIRT1 |
| 18087805 |
|
Rps2 |
|
194630 |
52612 |
254809 |
572703 |
0 |
|
0.02 |
0.11 |
0.27 |
-0.17 |
n.v. |
|
40S ribosomal protein S2 |
| 13385652 |
|
Rps20 |
|
249877 |
16053 |
173301 |
103367 |
1060 |
|
-0.06 |
0.09 |
0.21 |
-0.14 |
-0.71 |
|
40S ribosomal protein S20 |
| 21536222 |
|
Rps21 |
|
21821 |
2156 |
29885 |
28731 |
2035 |
|
-0.02 |
0.18 |
0.25 |
-0.16 |
-0.24 |
|
40S ribosomal protein S21 |
| 13195604 |
|
Rps23 |
|
86789 |
2221 |
31340 |
147872 |
0 |
|
0.04 |
-0.02 |
0.18 |
-0.09 |
n.v. |
|
40S ribosomal protein S23 |
| 46519156 |
|
Rps24 |
|
23981 |
5342 |
24193 |
150999 |
0 |
|
-0.04 |
0.37 |
0.23 |
-0.08 |
n.v. |
|
40S ribosomal protein S24 isoform 1 |
| 46519160 |
|
Rps24 |
|
23981 |
5342 |
24193 |
158964 |
0 |
|
-0.04 |
0.37 |
0.23 |
-0.08 |
n.v. |
|
40S ribosomal protein S24 isoform 3 |
| 28372479 |
|
Rps25 |
|
216469 |
55242 |
149142 |
176309 |
4027 |
|
-0.04 |
0.08 |
0.19 |
-0.19 |
-0.52 |
|
40S ribosomal protein S25 |
| 255003793 |
|
Rps26 |
|
98816 |
6914 |
140284 |
324877 |
214 |
|
-0.03 |
0.18 |
0.15 |
-0.08 |
-0.9 |
|
40S ribosomal protein S26 |
| 26024336;298231238 |
|
Rps27 |
|
0 |
0 |
68870 |
0 |
0 |
|
n.v. |
n.v. |
0.2 |
n.v. |
n.v. |
|
40S ribosomal protein S27 |
| 13195690 |
|
Rps27a |
|
1897089 |
69781 |
114790 |
379384 |
146013 |
|
0.01 |
-0.03 |
-0.01 |
0 |
-0.02 |
|
ubiquitin-40S ribosomal protein S27a precursor |
| 13385958 |
|
Rps27l |
|
47284 |
10206 |
54572 |
50832 |
139 |
|
0.04 |
0.12 |
0.21 |
-0.11 |
-0.25 |
|
40S ribosomal protein S27-like |
| 298231238 |
|
Rps27rt |
|
53399 |
8736 |
0 |
60770 |
139 |
|
0.05 |
0.12 |
n.v. |
-0.11 |
-0.25 |
|
ribosomal protein S27-like |
| 21426821 |
|
Rps28 |
|
26544 |
3799 |
39940 |
2513 |
0 |
|
-0.04 |
0.13 |
0.18 |
-0.14 |
n.v. |
|
40S ribosomal protein S28 |
| 6677803 |
|
Rps29 |
|
12045 |
1624 |
26957 |
7891 |
0 |
|
-0.13 |
0.22 |
0.17 |
-0.09 |
n.v. |
|
40S ribosomal protein S29 |
| 6755372 |
|
Rps3 |
|
582150 |
98163 |
416663 |
884949 |
0 |
|
0 |
0.13 |
0.2 |
-0.12 |
n.v. |
|
40S ribosomal protein S3 |
| 254553321 |
|
Rps3a1 |
|
167592 |
75290 |
362865 |
541950 |
1981 |
|
-0.03 |
0.11 |
0.2 |
-0.13 |
-0.24 |
|
40S ribosomal protein S3a |
| 6677805 |
|
Rps4x |
|
236807 |
24374 |
150238 |
598627 |
182 |
|
0.1 |
0.12 |
0.23 |
-0.1 |
-0.5 |
|
40S ribosomal protein S4, X isoform |
| 254675270 |
|
Rps5 |
|
93892 |
4597 |
65374 |
301957 |
257 |
|
0.02 |
0.08 |
0.22 |
-0.14 |
-0.45 |
|
40S ribosomal protein S5 |
| 158636007 |
|
Rps6ka1 |
|
0 |
1789 |
702 |
7948 |
22651 |
|
n.v. |
0.45 |
0.36 |
0.16 |
0.1 |
|
ribosomal protein S6 kinase alpha-1 |
| 6755374 |
|
Rps6ka2 |
|
0 |
791 |
784 |
2218 |
16782 |
|
n.v. |
0.2 |
0.36 |
-0.01 |
0.04 |
|
ribosomal protein S6 kinase alpha-2 |
| 22507357 |
|
Rps6ka3 |
|
0 |
1071 |
2815 |
3839 |
40450 |
|
n.v. |
0.54 |
0.33 |
0.48 |
0.04 |
|
ribosomal protein S6 kinase alpha-3 |
| 9910454 |
|
Rps6ka4 |
|
0 |
0 |
1791 |
7211 |
1928 |
|
n.v. |
n.v. |
-0.02 |
-0.01 |
-0.21 |
|
ribosomal protein S6 kinase alpha-4 |
| 23956386 |
|
Rps6ka5 |
|
0 |
491 |
372 |
941 |
7143 |
|
n.v. |
0.12 |
-0.02 |
0.15 |
0.05 |
|
ribosomal protein S6 kinase alpha-5 |
| 67625733 |
|
Rps6ka6 |
|
0 |
0 |
0 |
0 |
2527 |
|
n.v. |
n.v. |
n.v. |
n.v. |
0.08 |
|
ribosomal protein S6 kinase alpha-6 |
| 166999987 |
|
Rps6kb1 |
|
0 |
0 |
0 |
0 |
1981 |
|
n.v. |
n.v. |
n.v. |
n.v. |
0.23 |
|
ribosomal protein S6 kinase beta-1 isoform 1 |
| 29789225 |
|
Rps6kb1 |
|
0 |
0 |
0 |
0 |
278 |
|
n.v. |
n.v. |
n.v. |
n.v. |
0.34 |
|
ribosomal protein S6 kinase beta-1 isoform 2 |
| 10946894 |
|
Rps6kb2 |
|
0 |
0 |
107 |
2709 |
7539 |
|
n.v. |
n.v. |
-0.7 |
-0.09 |
0.13 |
|
ribosomal protein S6 kinase beta-2 |
| 94367038 |
|
Rps6-ps4 |
|
132426 |
42531 |
103705 |
361802 |
0 |
|
-0.09 |
0.16 |
0.25 |
-0.14 |
n.v. |
|
PREDICTED: 40S ribosomal protein S6-like isoform 2 |
| 6755376 |
|
Rps7 |
|
67073 |
864 |
44434 |
345431 |
0 |
|
0.04 |
0.21 |
0.26 |
-0.21 |
n.v. |
|
40S ribosomal protein S7 |
| 33504483 |
|
Rps9 |
|
531021 |
87911 |
410119 |
1359483 |
0 |
|
-0.02 |
0.13 |
0.22 |
-0.08 |
n.v. |
|
40S ribosomal protein S9 |
| 154146249 |
|
Rptor |
|
0 |
29 |
916 |
246 |
225 |
|
n.v. |
0.38 |
0.09 |
-0.11 |
-0.62 |
|
regulatory-associated protein of mTOR |
| 27734094 |
|
Rpusd2 |
|
0 |
0 |
0 |
0 |
2442 |
|
n.v. |
n.v. |
n.v. |
n.v. |
0.08 |
|
RNA pseudouridylate synthase domain-containing protein 2 |
| 10946722 |
|
Rqcd1 |
|
1208 |
718 |
7260 |
9102 |
0 |
|
-0.04 |
0.26 |
0.15 |
-0.21 |
n.v. |
|
cell differentiation protein RCD1 homolog |
| 31541819 |
|
Rraga |
|
0 |
2589 |
4018 |
1670 |
10624 |
|
n.v. |
0.24 |
-0.23 |
0.4 |
0.09 |
|
ras-related GTP-binding protein A |
| 51921311 |
|
Rragb |
|
0 |
2340 |
4018 |
1670 |
10624 |
|
n.v. |
0.71 |
-0.23 |
0.4 |
0.09 |
|
ras-related GTP-binding protein B |
| 114145487 |
|
Rragc |
|
0 |
4167 |
6225 |
4527 |
39807 |
|
n.v. |
-0.09 |
-0.29 |
0.01 |
0.31 |
|
ras-related GTP-binding protein C |
| 120444910 |
|
Rragd |
|
0 |
2348 |
4187 |
3544 |
31090 |
|
n.v. |
-0.15 |
-0.29 |
0.23 |
0.06 |
|
ras-related GTP-binding protein D |
| 6677819 |
|
Rras |
|
2929 |
2722 |
5809 |
0 |
268 |
|
0.12 |
0.21 |
-0.06 |
n.v. |
-1.89 |
|
ras-related protein R-Ras precursor |
| 165972315 |
|
Rras2 |
|
17720 |
5757 |
16417 |
2726 |
4487 |
|
-0.16 |
0.13 |
-0.09 |
-0.74 |
-0.64 |
|
ras-related protein R-Ras2 precursor |
| 19482168 |
|
Rrbp1 |
|
1977 |
347 |
69 |
0 |
0 |
|
0.04 |
-0.96 |
-0.03 |
n.v. |
n.v. |
|
ribosome-binding protein 1 isoform b |
| 124486712 |
|
Rrbp1 |
|
1977 |
2401 |
17637 |
9659 |
0 |
|
0.04 |
-0.05 |
-0.38 |
-0.61 |
n.v. |
|
ribosome-binding protein 1 isoform a |
| 295424113 |
|
Rreb1 |
|
0 |
0 |
192 |
0 |
0 |
|
n.v. |
n.v. |
-0.04 |
n.v. |
n.v. |
|
ras-responsive element-binding protein 1 isoform 1 |
| 295424118 |
|
Rreb1 |
|
0 |
0 |
192 |
0 |
0 |
|
n.v. |
n.v. |
-0.04 |
n.v. |
n.v. |
|
ras-responsive element-binding protein 1 isoform 2 |
| 31982026 |
|
Rrm1 |
|
0 |
1733 |
3124 |
64191 |
45451 |
|
n.v. |
0.56 |
0.06 |
0.22 |
0.05 |
|
ribonucleoside-diphosphate reductase large subunit |
| 7106399 |
|
Rrm2 |
|
0 |
1019 |
1390 |
810 |
57210 |
|
n.v. |
0.57 |
0.36 |
0.46 |
0.19 |
|
ribonucleoside-diphosphate reductase subunit M2 |
| 41054952 |
|
Rrm2b |
|
0 |
0 |
0 |
0 |
2699 |
|
n.v. |
n.v. |
n.v. |
n.v. |
0.1 |
|
ribonucleoside-diphosphate reductase subunit M2 B |
| 117676367 |
|
Rrp1 |
|
0 |
0 |
22 |
16 |
21 |
|
n.v. |
n.v. |
0.06 |
-0.31 |
-0.2 |
|
ribosomal RNA processing protein 1 homolog A |
| 40789092 |
|
Rrp12 |
|
0 |
0 |
0 |
1293 |
0 |
|
n.v. |
n.v. |
n.v. |
0.14 |
n.v. |
|
RRP12-like protein |
| 21704248 |
|
Rrp9 |
|
330 |
0 |
0 |
57 |
0 |
|
-0.93 |
n.v. |
n.v. |
-0.18 |
n.v. |
|
U3 small nucleolar RNA-interacting protein 2 |
| 227908779 |
|
Rrs1 |
|
659 |
0 |
0 |
0 |
0 |
|
2.18 |
n.v. |
n.v. |
n.v. |
n.v. |
|
ribosome biogenesis regulatory protein homolog |
| 67906201 |
|
Rsbn1 |
|
0 |
0 |
1700 |
0 |
0 |
|
n.v. |
n.v. |
-0.32 |
n.v. |
n.v. |
|
round spermatid basic protein 1 |
| 124430547 |
|
Rsbn1l |
|
0 |
0 |
22 |
33 |
0 |
|
n.v. |
n.v. |
0.25 |
-0.33 |
n.v. |
|
round spermatid basic protein 1-like |
| 30794470 |
|
Rsl1d1 |
|
26342 |
278 |
5168 |
26570 |
0 |
|
-0.03 |
0.02 |
-0.27 |
-0.19 |
n.v. |
|
ribosomal L1 domain-containing protein 1 |
| 13385292 |
|
Rsrc1 |
|
0 |
685 |
3 |
0 |
0 |
|
n.v. |
0.12 |
0.16 |
n.v. |
n.v. |
|
serine/Arginine-related protein 53 |
| 53988374 |
|
Rsrc2 |
|
0 |
1772 |
269 |
0 |
0 |
|
n.v. |
-0.27 |
-0.5 |
n.v. |
n.v. |
|
arginine/serine-rich coiled-coil protein 2 isoform 3 |
| 53988372 |
|
Rsrc2 |
|
0 |
2131 |
367 |
0 |
203 |
|
n.v. |
-0.04 |
-0.05 |
n.v. |
-0.38 |
|
arginine/serine-rich coiled-coil protein 2 isoform 2 |
| 53988376 |
|
Rsrc2 |
|
0 |
2854 |
367 |
0 |
203 |
|
n.v. |
-0.06 |
-0.05 |
n.v. |
-0.38 |
|
arginine/serine-rich coiled-coil protein 2 |
| 31982028 |
|
Rsu1 |
|
0 |
4901 |
4200 |
20398 |
10142 |
|
n.v. |
0.19 |
0.13 |
0.03 |
0.25 |
|
ras suppressor protein 1 |
| 254587958 |
|
Rtca |
|
0 |
1870 |
1933 |
11730 |
13869 |
|
n.v. |
0.2 |
0.14 |
0.13 |
0.12 |
|
RNA 3'-terminal phosphate cyclase |
| 21703842 |
|
Rtcb |
|
17647 |
12575 |
96415 |
176865 |
76284 |
|
-0.28 |
0.09 |
0.04 |
0.15 |
-0.05 |
|
tRNA-splicing ligase RtcB homolog |
| 195976788 |
|
Rtf1 |
|
0 |
3073 |
648 |
917 |
514 |
|
n.v. |
0.32 |
0.06 |
0.01 |
0.03 |
|
RNA polymerase-associated protein RTF1 homolog precursor |
| 30794468 |
|
Rtfdc1 |
|
1519 |
0 |
101 |
0 |
1264 |
|
0.34 |
n.v. |
0.13 |
n.v. |
-0.01 |
|
protein RTF2 homolog |
| 557129040 |
|
Rtn1 |
|
11954 |
0 |
0 |
0 |
0 |
|
0.01 |
n.v. |
n.v. |
n.v. |
n.v. |
|
reticulon-1 isoform A2 |
| 31982561 |
|
Rtn1 |
|
11954 |
4666 |
1671 |
3381 |
0 |
|
0.01 |
-0.21 |
-0.25 |
-0.42 |
n.v. |
|
reticulon-1 isoform RTN1-A |
| 56090141 |
|
Rtn1 |
|
11954 |
4666 |
1671 |
3381 |
0 |
|
0.01 |
-0.21 |
-0.25 |
-0.42 |
n.v. |
|
reticulon-1 isoform RTN1-C |
| 16716353 |
|
Rtn3 |
|
273053 |
11947 |
14406 |
20595 |
0 |
|
0 |
-0.31 |
-0.36 |
-0.43 |
n.v. |
|
reticulon-3 isoform 4 |
| 407339783 |
|
Rtn3 |
|
232926 |
11494 |
13707 |
20472 |
0 |
|
-0.05 |
-0.27 |
-0.34 |
-0.43 |
n.v. |
|
reticulon-3 isoform 5 |
| 407339785 |
|
Rtn3 |
|
232926 |
11494 |
13707 |
20472 |
0 |
|
-0.05 |
-0.27 |
-0.34 |
-0.43 |
n.v. |
|
reticulon-3 isoform 6 |
| 51511741 |
|
Rtn3 |
|
232926 |
11494 |
13707 |
20472 |
0 |
|
-0.05 |
-0.27 |
-0.34 |
-0.43 |
n.v. |
|
reticulon-3 isoform 2 |
| 54607016 |
|
Rtn3 |
|
232926 |
11494 |
13707 |
20472 |
0 |
|
-0.05 |
-0.27 |
-0.34 |
-0.43 |
n.v. |
|
reticulon-3 isoform 1 |
| 13195648 |
|
Rtn4 |
|
115676 |
15049 |
13455 |
3561 |
0 |
|
-0.15 |
-0.2 |
-0.26 |
0.05 |
n.v. |
|
reticulon-4 isoform C |
| 34610233 |
|
Rtn4 |
|
219874 |
31242 |
18492 |
5124 |
0 |
|
-0.03 |
-0.19 |
-0.18 |
0.03 |
n.v. |
|
reticulon-4 isoform B1 |
| 34610235 |
|
Rtn4 |
|
218006 |
31242 |
18684 |
4920 |
0 |
|
-0.02 |
-0.19 |
-0.22 |
0.05 |
n.v. |
|
reticulon-4 isoform A |
| 34610237 |
|
Rtn4 |
|
116152 |
15049 |
13647 |
3561 |
0 |
|
-0.15 |
-0.2 |
-0.27 |
0.05 |
n.v. |
|
reticulon-4 isoform D |
| 34610241 |
|
Rtn4 |
|
217530 |
31242 |
18492 |
4920 |
0 |
|
-0.03 |
-0.19 |
-0.18 |
0.05 |
n.v. |
|
reticulon-4 isoform B2 |
| 31543608 |
|
Rtn4ip1 |
|
1428 |
290 |
0 |
0 |
0 |
|
0.18 |
-0.13 |
n.v. |
n.v. |
n.v. |
|
reticulon-4-interacting protein 1, mitochondrial
precursor |
| 37704389 |
|
Rttn |
|
7689 |
1459 |
30212 |
36868 |
0 |
|
0.02 |
0.17 |
0.24 |
-0.03 |
n.v. |
|
rotatin |
| 27369788 |
|
Rufy1 |
|
0 |
184 |
78 |
0 |
0 |
|
-2.67 |
0.13 |
-0.06 |
n.v. |
n.v. |
|
RUN and FYVE domain-containing protein 1 |
| 119637825 |
|
Rufy2 |
|
0 |
1253 |
121 |
0 |
0 |
|
n.v. |
-0.15 |
-0.07 |
n.v. |
n.v. |
|
RUN and FYVE domain-containing protein 2 |
| 21312036 |
|
Rufy3 |
|
0 |
0 |
48 |
0 |
1896 |
|
n.v. |
n.v. |
0.56 |
n.v. |
-0.01 |
|
protein RUFY3 |
| 139947575 |
|
Rusc1 |
|
0 |
0 |
7 |
0 |
0 |
|
n.v. |
n.v. |
0.53 |
n.v. |
n.v. |
|
RUN and SH3 domain-containing protein 1 isoform 2 |
| 139948764 |
|
Rusc1 |
|
0 |
0 |
7 |
0 |
0 |
|
n.v. |
n.v. |
0.53 |
n.v. |
n.v. |
|
RUN and SH3 domain-containing protein 1 isoform 1 |
| 139949087 |
|
Rusc1 |
|
0 |
0 |
7 |
0 |
0 |
|
n.v. |
n.v. |
0.53 |
n.v. |
n.v. |
|
RUN and SH3 domain-containing protein 1 isoform 3 |
| 9790083 |
|
Ruvbl1 |
|
33372 |
13851 |
20978 |
174451 |
24043 |
|
-0.09 |
0.07 |
0.03 |
0.05 |
-0.13 |
|
ruvB-like 1 |
| 6755382 |
|
Ruvbl2 |
|
26324 |
15627 |
43250 |
250445 |
81553 |
|
-0.06 |
0.05 |
0.02 |
0.02 |
0.09 |
|
ruvB-like 2 |
| 21735427 |
|
Rwdd1 |
|
0 |
255 |
1905 |
1408 |
15861 |
|
n.v. |
0.3 |
0.08 |
0.36 |
0.18 |
|
RWD domain-containing protein 1 |
| 45356139 |
|
Rwdd4a |
|
0 |
0 |
0 |
0 |
1103 |
|
n.v. |
n.v. |
n.v. |
n.v. |
0.46 |
|
RWD domain-containing protein 4 |
| 38348308 |
|
Rybp |
|
0 |
0 |
0 |
25 |
0 |
|
n.v. |
0.93 |
n.v. |
-0.5 |
n.v. |
|
RING1 and YY1-binding protein |
| 6755386 |
|
S100a1 |
|
73 |
140 |
88 |
0 |
0 |
|
-0.05 |
0.12 |
-0.03 |
n.v. |
n.v. |
|
protein S100-A1 |
| 6677833 |
|
S100a10 |
|
13473 |
1413 |
2548 |
0 |
0 |
|
0.05 |
-0.12 |
-0.22 |
n.v. |
n.v. |
|
protein S100-A10 |
| 21886811 |
|
S100a11 |
|
44008 |
420 |
17160 |
180 |
13537 |
|
0.18 |
0.25 |
-0.03 |
0.07 |
0.01 |
|
protein S100-A11 |
| 347582617 |
|
S100a13 |
|
1611 |
248 |
552 |
6638 |
3095 |
|
0 |
0.22 |
0.06 |
0.17 |
-0.06 |
|
protein S100-A13 |
| 254587910 |
|
S100a14 |
|
16695 |
129 |
2709 |
0 |
0 |
|
0.21 |
-0.07 |
-0.14 |
n.v. |
n.v. |
|
protein S100-A14 isoform b |
| 254587908;254587904 |
|
S100a14 |
|
39431 |
1981 |
22030 |
1670 |
482 |
|
0.05 |
-0.09 |
-0.11 |
-0.23 |
-0.39 |
|
protein S100-A14 isoform a |
| 21312760 |
|
S100a16 |
|
23542 |
1954 |
13937 |
7367 |
793 |
|
0 |
-0.03 |
-0.08 |
-0.05 |
-0.01 |
|
S100 calcium binding protein A16 |
| 33859624 |
|
S100a4 |
|
0 |
0 |
6 |
0 |
0 |
|
n.v. |
n.v. |
-0.13 |
n.v. |
n.v. |
|
protein S100-A4 |
| 6755392 |
|
S100a6 |
|
142183 |
9195 |
43799 |
7956 |
5601 |
|
0.07 |
0.09 |
-0.03 |
-0.21 |
0.09 |
|
protein S100-A6 |
| 198278397 |
|
Saal1 |
|
0 |
603 |
383 |
2971 |
0 |
|
n.v. |
-0.35 |
-0.22 |
0.02 |
n.v. |
|
protein SAAL1 |
| 13507622 |
|
Sacm1l |
|
10032 |
6043 |
11118 |
0 |
0 |
|
0.21 |
-0.17 |
-0.36 |
n.v. |
n.v. |
|
phosphatidylinositide phosphatase SAC1 |
| 9790247 |
|
Sae1 |
|
0 |
52 |
3320 |
0 |
54961 |
|
n.v. |
0.24 |
0.01 |
n.v. |
0.05 |
|
SUMO-activating enzyme subunit 1 |
| 254028159 |
|
Safb |
|
29143 |
0 |
138 |
0 |
0 |
|
0.09 |
n.v. |
0.1 |
n.v. |
n.v. |
|
scaffold attachment factor B1 |
| 153945866 |
|
Safb2 |
|
30132 |
0 |
138 |
0 |
0 |
|
0.09 |
n.v. |
0.1 |
n.v. |
n.v. |
|
scaffold attachment factor B2 |
| 159032064 |
|
Sall1 |
|
0 |
0 |
0 |
24982 |
0 |
|
n.v. |
n.v. |
n.v. |
-0.02 |
n.v. |
|
sal-like protein 1 |
| 28893263 |
|
Samd12 |
|
0 |
0 |
0 |
0 |
600 |
|
n.v. |
n.v. |
n.v. |
n.v. |
-0.09 |
|
sterile alpha motif domain-containing protein 12 |
| 226958514 |
|
Samd9l |
|
659 |
186 |
73574 |
77951 |
62276 |
|
-0.69 |
0.21 |
0 |
0.14 |
-0.1 |
|
sterile alpha motif domain-containing protein 9-like |
| 213418055 |
|
Samhd1 |
|
0 |
2465 |
5306 |
71435 |
25510 |
|
n.v. |
0.16 |
-0.03 |
0.22 |
0.12 |
|
SAM domain and HD domain-containing protein 1 isoform
1 |
| 213418079 |
|
Samhd1 |
|
0 |
2465 |
4674 |
66606 |
25510 |
|
n.v. |
0.16 |
-0.07 |
0.22 |
0.12 |
|
SAM domain and HD domain-containing protein 1 isoform
2 |
| 30519943 |
|
Samm50 |
|
23230 |
32670 |
1834 |
0 |
0 |
|
0.13 |
-0.21 |
-0.57 |
n.v. |
n.v. |
|
sorting and assembly machinery component 50 homolog |
| 31560336 |
|
Sap30bp |
|
0 |
319 |
566 |
0 |
4798 |
|
n.v. |
0.48 |
0.09 |
n.v. |
0 |
|
SAP30-binding protein |
| 21703344 |
|
Sar1a |
|
4595 |
14558 |
10839 |
14840 |
42999 |
|
0.02 |
0.12 |
-0.06 |
-0.07 |
0.03 |
|
GTP-binding protein SAR1a |
| 21313476 |
|
Sar1b |
|
4595 |
17374 |
8635 |
11533 |
33221 |
|
0.02 |
0.13 |
-0.08 |
0.07 |
0.05 |
|
GTP-binding protein SAR1b |
| 20149748 |
|
Sardh |
|
0 |
1768 |
0 |
0 |
0 |
|
n.v. |
-0.39 |
n.v. |
n.v. |
n.v. |
|
sarcosine dehydrogenase, mitochondrial |
| 13384730 |
|
Sarnp |
|
20796 |
190 |
2404 |
17452 |
6758 |
|
0.12 |
-0.1 |
-0.01 |
-0.17 |
-0.21 |
|
SAP domain-containing ribonucleoprotein |
| 326381098 |
|
Sars |
|
12906 |
16763 |
35023 |
138655 |
114056 |
|
0.17 |
0.14 |
0.06 |
0.22 |
0.12 |
|
serine--tRNA ligase, cytoplasmic isoform 2 |
| 33468931 |
|
Sars |
|
12906 |
16763 |
35023 |
138655 |
114056 |
|
0.17 |
0.14 |
0.06 |
0.22 |
0.12 |
|
serine--tRNA ligase, cytoplasmic isoform 1 |
| 228008415 |
|
Sars2 |
|
0 |
1200 |
0 |
0 |
300 |
|
n.v. |
-0.31 |
n.v. |
n.v. |
-0.55 |
|
serine--tRNA ligase, mitochondrial precursor |
| 124244096 |
|
Sart1 |
|
12906 |
31 |
6425 |
7703 |
0 |
|
-0.01 |
-0.18 |
-0.07 |
-0.17 |
n.v. |
|
U4/U6.U5 tri-snRNP-associated protein 1 |
| 8394239 |
|
Sart3 |
|
0 |
2695 |
9386 |
164964 |
85162 |
|
n.v. |
0.01 |
0.05 |
-0.06 |
-0.01 |
|
squamous cell carcinoma antigen recognized by T-cells 3 |
| 124249210 |
|
Sat2 |
|
0 |
0 |
0 |
0 |
3738 |
|
n.v. |
n.v. |
n.v. |
n.v. |
0.12 |
|
diamine acetyltransferase 2 |
| 218751888 |
|
Saysd1 |
|
0 |
48 |
0 |
0 |
0 |
|
n.v. |
-0.9 |
n.v. |
n.v. |
n.v. |
|
SAYSvFN domain-containing protein 1 |
| 23956138 |
|
Sbds |
|
0 |
2340 |
7571 |
129201 |
1628 |
|
n.v. |
0.23 |
0.13 |
0.1 |
0.29 |
|
ribosome maturation protein SBDS |
| 124487087 |
|
Sbno1 |
|
0 |
234 |
0 |
467 |
9617 |
|
n.v. |
-0.33 |
n.v. |
1.95 |
0.32 |
|
protein strawberry notch homolog 1 |
| 34556193 |
|
Sbno2 |
|
0 |
234 |
0 |
467 |
4048 |
|
n.v. |
-0.31 |
n.v. |
1.95 |
0.5 |
|
protein strawberry notch homolog 2 |
| 13384836 |
|
Sc4mol |
|
0 |
129 |
0 |
0 |
0 |
|
n.v. |
0.12 |
n.v. |
n.v. |
n.v. |
|
methylsterol monooxygenase 1 |
| 56605682 |
|
Scaf1 |
|
0 |
0 |
4 |
0 |
0 |
|
n.v. |
n.v. |
0.56 |
n.v. |
n.v. |
|
splicing factor, arginine/serine-rich 19 |
| 109150409 |
|
Scaf4 |
|
1794 |
0 |
53 |
0 |
0 |
|
-0.02 |
n.v. |
0.01 |
n.v. |
n.v. |
|
splicing factor, arginine/serine-rich 15 |
| 30527367 |
|
Scaf8 |
|
1794 |
0 |
53 |
0 |
0 |
|
-0.02 |
n.v. |
0.01 |
n.v. |
n.v. |
|
protein SCAF8 |
| 58037395 |
|
Scamp1 |
|
0 |
3814 |
2382 |
5779 |
0 |
|
n.v. |
-0.7 |
-0.16 |
-0.54 |
n.v. |
|
secretory carrier-associated membrane protein 1 |
| 12331398 |
|
Scamp2 |
|
0 |
1142 |
2957 |
4224 |
0 |
|
n.v. |
-0.23 |
-0.1 |
-0.35 |
n.v. |
|
secretory carrier-associated membrane protein 2 |
| 118601011 |
|
Scamp3 |
|
4284 |
6010 |
8790 |
14005 |
0 |
|
0.11 |
-0.02 |
0.2 |
0.07 |
n.v. |
|
secretory carrier-associated membrane protein 3 |
| 9625033 |
|
Scamp4 |
|
0 |
981 |
939 |
229 |
0 |
|
n.v. |
-0.12 |
0.05 |
-0.47 |
n.v. |
|
secretory carrier-associated membrane protein 4 |
| 9937988 |
|
Scamp5 |
|
0 |
2785 |
541 |
0 |
0 |
|
n.v. |
0.1 |
-0.34 |
n.v. |
n.v. |
|
secretory carrier-associated membrane protein 5 |
| 124486797 |
|
Scaper |
|
0 |
0 |
5553 |
0 |
0 |
|
n.v. |
n.v. |
0.26 |
n.v. |
n.v. |
|
S phase cyclin A-associated protein in the endoplasmic
reticulum |
| 14389423 |
|
Scarb1 |
|
0 |
1054 |
421 |
0 |
0 |
|
n.v. |
-0.25 |
-0.32 |
n.v. |
n.v. |
|
scavenger receptor class B member 1 isoform 1 |
| 326537322 |
|
Scarb1 |
|
0 |
1054 |
421 |
0 |
0 |
|
n.v. |
-0.25 |
-0.32 |
n.v. |
n.v. |
|
scavenger receptor class B member 1 isoform 2 |
| 326537324 |
|
Scarb1 |
|
0 |
1054 |
421 |
0 |
0 |
|
n.v. |
-0.25 |
-0.32 |
n.v. |
n.v. |
|
scavenger receptor class B member 1 isoform 3 |
| 6680878 |
|
Scarb2 |
|
6499 |
11220 |
23126 |
10396 |
0 |
|
0.17 |
-0.14 |
-0.23 |
-0.14 |
n.v. |
|
lysosome membrane protein 2 |
| 30520019 |
|
Sccpdh |
|
0 |
605 |
19 |
0 |
0 |
|
n.v. |
-0.42 |
0.03 |
n.v. |
n.v. |
|
saccharopine dehydrogenase-like oxidoreductase |
| 70909345 |
|
Scel |
|
641 |
8 |
5193 |
188 |
600 |
|
0.66 |
0.95 |
0.38 |
-0.33 |
-0.68 |
|
sciellin |
| 58037481 |
|
Scfd1 |
|
43934 |
12805 |
8298 |
11558 |
0 |
|
0.04 |
-0.11 |
-0.21 |
-0.18 |
n.v. |
|
sec1 family domain-containing protein 1 |
| 167900448 |
|
Scfd2 |
|
0 |
1048 |
0 |
0 |
0 |
|
n.v. |
0.06 |
n.v. |
n.v. |
n.v. |
|
sec1 family domain-containing protein 2 isoform a |
| 21703798 |
|
Scgn |
|
0 |
0 |
0 |
0 |
1274 |
|
n.v. |
n.v. |
n.v. |
n.v. |
0.01 |
|
secretagogin |
| 226246550 |
|
Scin |
|
153899 |
31054 |
155093 |
511811 |
432750 |
|
0.14 |
0.25 |
0.08 |
0.19 |
0.1 |
|
adseverin isoform 1 |
| 226246552 |
|
Scin |
|
147821 |
27561 |
108195 |
444492 |
321349 |
|
0.17 |
0.26 |
0.08 |
0.2 |
0.09 |
|
adseverin isoform 2 |
| 27804323 |
|
Scly |
|
0 |
566 |
2185 |
0 |
61087 |
|
n.v. |
0.01 |
0.12 |
n.v. |
0.06 |
|
selenocysteine lyase |
| 133987591 |
|
Scn11a |
|
0 |
0 |
0 |
0 |
332 |
|
n.v. |
n.v. |
n.v. |
n.v. |
0.18 |
|
sodium channel protein type 11 subunit alpha |
| 90991710 |
|
Sco1 |
|
0 |
29 |
0 |
0 |
0 |
|
n.v. |
-0.03 |
n.v. |
n.v. |
n.v. |
|
protein SCO1 homolog, mitochondrial |
| 162329549 |
|
Sco2 |
|
0 |
3507 |
0 |
0 |
0 |
|
n.v. |
-0.14 |
n.v. |
n.v. |
n.v. |
|
protein SCO2 homolog, mitochondrial |
| 85362711 |
|
Scoc |
|
0 |
0 |
6 |
0 |
96 |
|
n.v. |
n.v. |
0.07 |
n.v. |
0.15 |
|
short coiled-coil protein isoform a |
| 9790207 |
|
Scoc |
|
0 |
0 |
6 |
0 |
96 |
|
n.v. |
n.v. |
0.07 |
n.v. |
0.15 |
|
short coiled-coil protein isoform b |
| 45476581 |
|
Scp2 |
|
45710 |
27100 |
31618 |
0 |
6458 |
|
0.08 |
-0.11 |
-0.22 |
n.v. |
-0.17 |
|
non-specific lipid-transfer protein |
| 253970508 |
|
Scpep1 |
|
24036 |
14107 |
3739 |
1752 |
17007 |
|
0.07 |
-0.13 |
-0.25 |
-0.2 |
-0.19 |
|
retinoid-inducible serine carboxypeptidase precursor |
| 20373163 |
|
Scrib |
|
11624 |
5490 |
10249 |
0 |
0 |
|
-0.22 |
-0.09 |
-0.1 |
n.v. |
n.v. |
|
protein scribble homolog |
| 22122499 |
|
Scrn2 |
|
0 |
635 |
120 |
65 |
90977 |
|
n.v. |
0.23 |
0.19 |
-0.48 |
0.16 |
|
secernin-2 |
| 12963867 |
|
Scyl1 |
|
0 |
399 |
638 |
10281 |
0 |
|
n.v. |
0.16 |
-0.09 |
0.42 |
n.v. |
|
N-terminal kinase-like protein |
| 37574121 |
|
Scyl2 |
|
805 |
1265 |
3720 |
0 |
10185 |
|
-0.39 |
0.15 |
0.21 |
n.v. |
0.36 |
|
SCY1-like protein 2 |
| 21311917 |
|
Scyl3 |
|
0 |
106 |
4 |
49 |
0 |
|
n.v. |
0.26 |
-0.14 |
0.08 |
n.v. |
|
protein-associating with the carboxyl-terminal domain of
ezrin |
| 27370042 |
|
Sdad1 |
|
0 |
0 |
0 |
753 |
0 |
|
n.v. |
n.v. |
n.v. |
0.22 |
n.v. |
|
protein SDA1 homolog |
| 6755438 |
|
Sdc1 |
|
0 |
447 |
1474 |
0 |
0 |
|
n.v. |
-0.1 |
-0.11 |
n.v. |
n.v. |
|
syndecan-1 precursor |
| 6755442 |
|
Sdc4 |
|
3570 |
3545 |
1261 |
13850 |
0 |
|
0.08 |
-0.21 |
-0.15 |
-1.73 |
n.v. |
|
syndecan-4 precursor |
| 148277591 |
|
Sdcbp |
|
0 |
480 |
694 |
761 |
0 |
|
n.v. |
-0.21 |
0.45 |
-0.04 |
n.v. |
|
syntenin-1 isoform 2 |
| 148277640 |
|
Sdcbp |
|
0 |
480 |
694 |
761 |
0 |
|
n.v. |
-0.21 |
0.45 |
-0.04 |
n.v. |
|
syntenin-1 isoform 1 |
| 29789245 |
|
Sdccag8 |
|
0 |
0 |
219 |
0 |
3791 |
|
n.v. |
n.v. |
0.06 |
n.v. |
-0.07 |
|
serologically defined colon cancer antigen 8 homolog |
| 11612505 |
|
Sdf2l1 |
|
1483 |
1207 |
1681 |
0 |
0 |
|
-0.15 |
-0.32 |
-0.28 |
n.v. |
n.v. |
|
stromal cell-derived factor 2-like protein 1
precursor |
| 54607098 |
|
Sdha |
|
196771 |
70092 |
12738 |
0 |
0 |
|
0.3 |
-0.08 |
-0.26 |
n.v. |
n.v. |
|
succinate dehydrogenase [ubiquinone] flavoprotein
subunit, mitochondrial precursor |
| 110815822 |
|
Sdhaf1 |
|
0 |
15 |
0 |
16 |
0 |
|
n.v. |
-0.48 |
n.v. |
-0.42 |
n.v. |
|
succinate dehydrogenase assembly factor 1, mitochondrial |
| 34328286 |
|
Sdhb |
|
25171 |
27520 |
3304 |
0 |
0 |
|
-0.06 |
-0.13 |
-0.36 |
n.v. |
n.v. |
|
succinate dehydrogenase [ubiquinone] iron-sulfur subunit,
mitochondrial precursor |
| 228008307 |
|
Sdhc |
|
952 |
3874 |
410 |
0 |
0 |
|
-0.16 |
-0.22 |
-0.51 |
n.v. |
n.v. |
|
succinate dehydrogenase cytochrome b560 subunit,
mitochondrial precursor |
| 27229021 |
|
Sdhd |
|
2014 |
647 |
0 |
0 |
0 |
|
0.35 |
-0.18 |
n.v. |
n.v. |
n.v. |
|
succinate dehydrogenase [ubiquinone] cytochrome b small
subunit, mitochondrial |
| 131889222 |
|
Sdr39u1 |
|
1043 |
3780 |
0 |
0 |
0 |
|
-0.02 |
-0.09 |
n.v. |
n.v. |
n.v. |
|
epimerase family protein SDR39U1 |
| 20589949 |
|
Sdsl |
|
0 |
0 |
0 |
0 |
2806 |
|
n.v. |
n.v. |
n.v. |
n.v. |
-0.47 |
|
serine dehydratase-like |
| 9910550 |
|
Sec11a |
|
46534 |
7895 |
4230 |
1473 |
0 |
|
0.01 |
-0.25 |
-0.35 |
-0.57 |
n.v. |
|
signal peptidase complex catalytic subunit SEC11A |
| 29150272 |
|
Sec13 |
|
1739 |
5265 |
7984 |
14071 |
29023 |
|
0.07 |
0.14 |
0.03 |
-0.07 |
-0.13 |
|
protein SEC13 homolog |
| 262073064 |
|
Sec14l1 |
|
3661 |
0 |
2919 |
5984 |
0 |
|
0.14 |
n.v. |
0.04 |
0 |
n.v. |
|
SEC14-like 1 isoform 1 |
| 262073066 |
|
Sec14l1 |
|
3661 |
0 |
2919 |
5984 |
0 |
|
0.14 |
n.v. |
0.04 |
0 |
n.v. |
|
SEC14-like 1 isoform 2 |
| 262073068 |
|
Sec14l1 |
|
3661 |
0 |
2919 |
5984 |
0 |
|
0.14 |
n.v. |
0.04 |
0 |
n.v. |
|
SEC14-like 1 isoform 3 |
| 189181692 |
|
Sec14l5 |
|
0 |
0 |
597 |
0 |
0 |
|
n.v. |
n.v. |
0.08 |
n.v. |
n.v. |
|
SEC14-like protein 5 |
| 124378050 |
|
Sec16a |
|
0 |
0 |
10 |
237 |
2110 |
|
n.v. |
n.v. |
-0.07 |
0.53 |
0.25 |
|
SEC16 homolog A |
| 27819645 |
|
Sec22a |
|
0 |
670 |
0 |
0 |
0 |
|
n.v. |
-0.25 |
n.v. |
n.v. |
n.v. |
|
vesicle-trafficking protein SEC22a |
| 6755448 |
|
Sec22b |
|
81315 |
16303 |
21741 |
19760 |
450 |
|
-0.2 |
-0.22 |
-0.21 |
-0.17 |
-0.85 |
|
vesicle-trafficking protein SEC22b precursor |
| 67906177 |
|
Sec23a |
|
4943 |
8868 |
19762 |
22952 |
12969 |
|
0.33 |
-0.1 |
0.03 |
0.03 |
0.01 |
|
protein transport protein Sec23A |
| 529250183 |
|
Sec23b |
|
3972 |
0 |
0 |
0 |
0 |
|
0.33 |
n.v. |
n.v. |
n.v. |
n.v. |
|
protein transport protein Sec23B isoform 2 |
| 357527456;31980969 |
|
Sec23b |
|
0 |
0 |
23909 |
0 |
0 |
|
n.v. |
n.v. |
-0.02 |
n.v. |
n.v. |
|
protein transport protein Sec23B |
| 31980969 |
|
Sec23b |
|
5565 |
8317 |
0 |
43187 |
10078 |
|
0.29 |
0.12 |
n.v. |
0.11 |
-0.14 |
|
protein transport protein Sec23B isoform 1 |
| 254692911 |
|
Sec23ip |
|
0 |
0 |
3538 |
2701 |
2174 |
|
n.v. |
n.v. |
-0.03 |
0.6 |
-0.31 |
|
SEC23-interacting protein |
| 116174774 |
|
Sec24a |
|
0 |
0 |
22 |
0 |
1360 |
|
n.v. |
n.v. |
1.24 |
n.v. |
0.45 |
|
protein transport protein Sec24A |
| 46402179 |
|
Sec24b |
|
275 |
353 |
1569 |
5370 |
2067 |
|
0.16 |
0.06 |
0.1 |
0.05 |
0 |
|
protein transport protein Sec24B |
| 269954698 |
|
Sec24c |
|
183 |
65 |
10375 |
2668 |
36798 |
|
-0.81 |
0.53 |
-0.02 |
-0.26 |
0.13 |
|
Sec24 related gene family, member C isoform 1 |
| 269954700 |
|
Sec24c |
|
183 |
65 |
10375 |
2668 |
36798 |
|
-0.81 |
0.53 |
-0.02 |
-0.26 |
0.13 |
|
Sec24 related gene family, member C isoform 2 |
| 46560565 |
|
Sec24d |
|
0 |
0 |
236 |
0 |
1756 |
|
n.v. |
n.v. |
-0.75 |
n.v. |
-1.61 |
|
SEC24 related gene family, member D |
| 244791271 |
|
Sec31a |
|
19880 |
4693 |
20274 |
13711 |
50892 |
|
-1.65 |
0.1 |
0.08 |
-0.04 |
0.06 |
|
protein transport protein Sec31A |
| 133504851 |
|
Sec31b |
|
33573 |
624 |
136 |
0 |
407 |
|
0.03 |
-0.24 |
-0.33 |
n.v. |
-0.38 |
|
protein transport protein Sec31B |
| 8394252 |
|
Sec61a1 |
|
11661 |
0 |
8123 |
671 |
0 |
|
0 |
n.v. |
-0.33 |
0.59 |
n.v. |
|
protein transport protein Sec61 subunit alpha isoform 1 |
| 10946604 |
|
Sec61a2 |
|
0 |
0 |
3168 |
0 |
0 |
|
n.v. |
n.v. |
-0.4 |
n.v. |
n.v. |
|
protein transport protein Sec61 subunit alpha isoform 2 |
| 13324684 |
|
Sec61b |
|
9391 |
1482 |
2662 |
729 |
0 |
|
0.1 |
-0.21 |
-0.26 |
-0.47 |
n.v. |
|
protein transport protein Sec61 subunit beta |
| 39930429 |
|
Sec62 |
|
22040 |
2244 |
7321 |
98 |
0 |
|
0.05 |
-0.33 |
-0.23 |
-0.67 |
n.v. |
|
translocation protein SEC62 |
| 158937300 |
|
Sec63 |
|
0 |
1714 |
12163 |
0 |
0 |
|
n.v. |
-0.16 |
-0.25 |
n.v. |
n.v. |
|
translocation protein SEC63 homolog |
| 20532338 |
|
Seh1l |
|
0 |
0 |
467 |
3070 |
0 |
|
n.v. |
n.v. |
-0.08 |
0.27 |
n.v. |
|
nucleoporin SEH1 isoform b |
| 84875515 |
|
Seh1l |
|
0 |
0 |
467 |
3070 |
0 |
|
n.v. |
n.v. |
-0.08 |
0.27 |
n.v. |
|
nucleoporin SEH1 isoform a |
| 46309573 |
|
Sel1l |
|
2435 |
1194 |
214 |
0 |
0 |
|
-0.16 |
-0.45 |
-0.55 |
n.v. |
n.v. |
|
protein sel-1 homolog 1 isoform b precursor |
| 84875513 |
|
Sel1l |
|
2435 |
1194 |
214 |
0 |
0 |
|
-0.16 |
-0.45 |
-0.55 |
n.v. |
n.v. |
|
protein sel-1 homolog 1 isoform a precursor |
| 22164798 |
|
Selenbp1 |
|
2984 |
34064 |
40006 |
23828 |
643116 |
|
0.26 |
0.15 |
-0.03 |
0.04 |
0 |
|
selenium-binding protein 1 |
| 9507079 |
|
Selenbp2 |
|
2984 |
27605 |
31678 |
18082 |
643363 |
|
0.26 |
0.14 |
-0.03 |
0.07 |
0 |
|
selenium-binding protein 2 |
| 111119001 |
|
Selk |
|
0 |
202 |
63 |
0 |
0 |
|
n.v. |
-0.11 |
-0.25 |
n.v. |
n.v. |
|
selenoprotein K |
| 81295807 |
|
Selo |
|
0 |
804 |
0 |
0 |
7871 |
|
n.v. |
-0.43 |
n.v. |
n.v. |
0.14 |
|
selenoprotein O |
| 143770878 |
|
Selt |
|
4503 |
1509 |
972 |
180 |
0 |
|
0.6 |
-0.09 |
-0.25 |
-0.15 |
n.v. |
|
selenoprotein T precursor |
| 46048361 |
|
Sema3c |
|
0 |
13 |
0 |
0 |
0 |
|
n.v. |
0.43 |
n.v. |
n.v. |
n.v. |
|
semaphorin-3C precursor |
| 110625636 |
|
Sema4b |
|
0 |
61 |
0 |
0 |
0 |
|
n.v. |
-1.03 |
n.v. |
n.v. |
n.v. |
|
semaphorin-4B precursor |
| 530232771 |
|
Sema4d |
|
50946 |
0 |
0 |
0 |
0 |
|
0.14 |
n.v. |
n.v. |
n.v. |
n.v. |
|
semaphorin-4D precursor |
| 49274623 |
|
Sema4d |
|
0 |
0 |
0 |
524 |
739 |
|
n.v. |
n.v. |
n.v. |
0.31 |
-0.67 |
|
semaphorin-4D precursor |
| 164698454 |
|
Sema4f |
|
0 |
0 |
0 |
0 |
7561 |
|
n.v. |
n.v. |
n.v. |
n.v. |
0.1 |
|
semaphorin-4F isoform a precursor |
| 164698456 |
|
Sema4f |
|
0 |
0 |
0 |
0 |
7561 |
|
n.v. |
n.v. |
n.v. |
n.v. |
0.1 |
|
semaphorin-4F isoform b precursor |
| 6755462 |
|
Sema4g |
|
0 |
0 |
82 |
0 |
0 |
|
n.v. |
n.v. |
0.71 |
n.v. |
n.v. |
|
semaphorin-4G precursor |
| 254939663 |
|
Senp3 |
|
0 |
0 |
4 |
3749 |
0 |
|
n.v. |
n.v. |
0.54 |
-0.1 |
n.v. |
|
sentrin-specific protease 3 |
| 16716395 |
|
Sep15 |
|
1940 |
781 |
1127 |
0 |
1478 |
|
0.1 |
-0.13 |
-0.23 |
n.v. |
-0.58 |
|
15 kDa selenoprotein precursor |
| 156713463 |
|
Sephs1 |
|
0 |
1699 |
958 |
3700 |
25810 |
|
n.v. |
0.05 |
0.15 |
0.46 |
0.21 |
|
selenide, water dikinase 1 |
| 15011843 |
|
Sephs2 |
|
0 |
0 |
0 |
0 |
1649 |
|
n.v. |
n.v. |
n.v. |
n.v. |
0.2 |
|
selenide, water dikinase 2 |
| 111118964 |
|
Sepn1 |
|
0 |
65 |
0 |
0 |
0 |
|
n.v. |
-0.87 |
n.v. |
n.v. |
n.v. |
|
selenoprotein N, 1 |
| 27369676 |
|
Sepsecs |
|
0 |
0 |
0 |
3217 |
0 |
|
n.v. |
n.v. |
n.v. |
0.14 |
n.v. |
|
O-phosphoseryl-tRNA(Sec) selenium transferase |
| 226442740 |
|
Sept10 |
|
30095 |
9613 |
22045 |
23836 |
23400 |
|
0.07 |
0.22 |
-0.05 |
-0.24 |
-0.09 |
|
septin-10 isoform 1 |
| 67906175 |
|
Sept10 |
|
30095 |
9613 |
22045 |
34085 |
23400 |
|
0.07 |
0.22 |
-0.05 |
-0.24 |
-0.09 |
|
septin-10 isoform 2 |
| 57634518 |
|
Sept11 |
|
47010 |
21449 |
54705 |
68947 |
67813 |
|
0.17 |
0.12 |
-0.04 |
0.01 |
-0.01 |
|
septin-11 |
| 160333377 |
|
Sept14 |
|
28539 |
3058 |
19651 |
32055 |
16964 |
|
0.07 |
0.1 |
-0.04 |
-0.14 |
-0.07 |
|
septin-14 |
| 228480253 |
|
Sept2 |
|
95100 |
16268 |
23126 |
146481 |
85226 |
|
0.07 |
0.08 |
-0.07 |
0.02 |
-0.12 |
|
septin-2 isoform b |
| 228480255 |
|
Sept2 |
|
98743 |
16268 |
23717 |
153618 |
85226 |
|
0.08 |
0.08 |
-0.09 |
0.02 |
-0.12 |
|
septin-2 isoform a |
| 548923742 |
|
Sept4 |
|
293 |
0 |
0 |
0 |
0 |
|
-0.12 |
n.v. |
n.v. |
n.v. |
n.v. |
|
septin-4 isoform 2 |
| 548923858 |
|
Sept4 |
|
293 |
0 |
0 |
0 |
0 |
|
-0.12 |
n.v. |
n.v. |
n.v. |
n.v. |
|
septin-4 isoform 4 |
| 548923884 |
|
Sept4 |
|
293 |
0 |
0 |
0 |
0 |
|
-0.12 |
n.v. |
n.v. |
n.v. |
n.v. |
|
septin-4 isoform 3 |
| 6755120 |
|
Sept4 |
|
293 |
670 |
1465 |
14407 |
0 |
|
-0.12 |
-0.19 |
-0.02 |
-0.01 |
n.v. |
|
septin-4 |
| 158508501 |
|
Sept5 |
|
0 |
674 |
1538 |
13252 |
0 |
|
n.v. |
0.35 |
0.02 |
0.09 |
n.v. |
|
septin-5 |
| 293597551 |
|
Sept6 |
|
0 |
6601 |
16009 |
26955 |
13408 |
|
n.v. |
0.29 |
0.03 |
0.13 |
0.07 |
|
septin-6 isoform 3 |
| 293597553 |
|
Sept6 |
|
0 |
6601 |
16009 |
26955 |
13408 |
|
n.v. |
0.29 |
0.03 |
0.13 |
0.07 |
|
septin-6 isoform 1 |
| 31560370 |
|
Sept6 |
|
0 |
6601 |
16009 |
26955 |
13408 |
|
n.v. |
0.29 |
0.03 |
0.13 |
0.07 |
|
septin-6 isoform 2 |
| 358679344 |
|
Sept6 |
|
0 |
6601 |
16009 |
26955 |
13408 |
|
n.v. |
0.29 |
0.03 |
0.13 |
0.07 |
|
septin-6 isoform 4 |
| 28173550 |
|
Sept7 |
|
58231 |
17445 |
56828 |
160282 |
98163 |
|
0.13 |
0.05 |
0.01 |
-0.04 |
-0.05 |
|
septin-7 isoform 1 |
| 329299065 |
|
Sept7 |
|
58231 |
17305 |
56162 |
158579 |
96396 |
|
0.13 |
0.03 |
0.01 |
-0.04 |
-0.06 |
|
septin-7 isoform 2 |
| 356640208 |
|
Sept8 |
|
28539 |
7763 |
22826 |
48532 |
27909 |
|
0.07 |
0.1 |
-0.02 |
-0.14 |
-0.06 |
|
septin-8 isoform 2 |
| 356640210 |
|
Sept8 |
|
28539 |
7763 |
22826 |
48532 |
27909 |
|
0.07 |
0.1 |
-0.02 |
-0.14 |
-0.06 |
|
septin-8 isoform 3 |
| 39930477 |
|
Sept8 |
|
28539 |
7763 |
22826 |
48532 |
27909 |
|
0.07 |
0.1 |
-0.02 |
-0.14 |
-0.06 |
|
septin-8 isoform 1 |
| 164698479 |
|
Sept9 |
|
68227 |
4129 |
17790 |
67948 |
10624 |
|
0.23 |
0.15 |
-0.01 |
-0.19 |
-0.51 |
|
septin-9 isoform a |
| 164698481 |
|
Sept9 |
|
68227 |
4129 |
17790 |
67948 |
10624 |
|
0.23 |
0.15 |
-0.01 |
-0.19 |
-0.51 |
|
septin-9 isoform b |
| 8393784 |
|
Sept9 |
|
10910 |
1144 |
8562 |
21381 |
932 |
|
0.25 |
0.12 |
-0.01 |
-0.34 |
-0.02 |
|
septin-9 isoform c |
| 6677917 |
|
Sepw1 |
|
92 |
0 |
6 |
0 |
0 |
|
-0.07 |
n.v. |
0.23 |
n.v. |
n.v. |
|
selenoprotein W |
| 161169008 |
|
Serac1 |
|
0 |
0 |
15 |
0 |
0 |
|
n.v. |
n.v. |
-0.04 |
n.v. |
n.v. |
|
protein SERAC1 isoform 2 |
| 161169010 |
|
Serac1 |
|
0 |
0 |
15 |
0 |
0 |
|
n.v. |
n.v. |
-0.04 |
n.v. |
n.v. |
|
protein SERAC1 isoform 3 |
| 165932375 |
|
Serbp1 |
|
24493 |
14803 |
100713 |
62251 |
21 |
|
0.04 |
0.27 |
0.15 |
-0.04 |
-0.87 |
|
plasminogen activator inhibitor 1 RNA-binding protein
isoform 1 |
| 165932377 |
|
Serbp1 |
|
24493 |
14803 |
91308 |
61523 |
21 |
|
0.04 |
0.27 |
0.15 |
-0.04 |
-0.87 |
|
plasminogen activator inhibitor 1 RNA-binding protein
isoform 2 |
| 165932379 |
|
Serbp1 |
|
24493 |
14727 |
94533 |
64682 |
21 |
|
0.04 |
0.26 |
0.15 |
-0.05 |
-0.87 |
|
plasminogen activator inhibitor 1 RNA-binding protein
isoform 3 |
| 165932381 |
|
Serbp1 |
|
24493 |
14727 |
85129 |
64036 |
21 |
|
0.04 |
0.26 |
0.15 |
-0.05 |
-0.87 |
|
plasminogen activator inhibitor 1 RNA-binding protein
isoform 4 |
| 6755472 |
|
Serf2 |
|
165 |
0 |
130 |
0 |
64 |
|
0.22 |
n.v. |
0.08 |
n.v. |
0.18 |
|
small EDRK-rich factor 2 |
| 13443008 |
|
Serhl |
|
14956 |
7987 |
2117 |
0 |
0 |
|
-0.07 |
-0.21 |
-0.26 |
n.v. |
n.v. |
|
serine hydrolase-like protein |
| 9790269 |
|
Serinc1 |
|
0 |
0 |
117 |
0 |
0 |
|
n.v. |
n.v. |
-0.07 |
n.v. |
n.v. |
|
serine incorporator 1 precursor |
| 148277027 |
|
Serinc2 |
|
0 |
0 |
18 |
0 |
0 |
|
n.v. |
n.v. |
-0.45 |
n.v. |
n.v. |
|
serine incorporator 2 isoform 1 precursor |
| 358356409 |
|
Serinc2 |
|
0 |
0 |
18 |
0 |
0 |
|
n.v. |
n.v. |
-0.45 |
n.v. |
n.v. |
|
serine incorporator 2 isoform 2 |
| 213385301 |
|
Serinc3 |
|
0 |
0 |
59 |
0 |
0 |
|
n.v. |
n.v. |
-0.84 |
n.v. |
n.v. |
|
serine incorporator 3 precursor |
| 6680856 |
|
Serpina6 |
|
0 |
0 |
0 |
0 |
20487 |
|
n.v. |
n.v. |
n.v. |
n.v. |
-0.04 |
|
corticosteroid-binding globulin precursor |
| 160333613 |
|
Serpinb3c |
|
0 |
0 |
224 |
229 |
0 |
|
n.v. |
n.v. |
0.03 |
0.19 |
n.v. |
|
serine (or cysteine) proteinase inhibitor, clade B,
member 3C |
| 6678103 |
|
Serpinb5 |
|
0 |
0 |
0 |
0 |
3470 |
|
n.v. |
n.v. |
n.v. |
n.v. |
-0.06 |
|
serpin B5 |
| 255759941 |
|
Serpinb6a |
|
2526 |
23290 |
26890 |
14325 |
394292 |
|
0.1 |
-0.11 |
0.03 |
0.1 |
0.15 |
|
serpin B6 isoform a |
| 255759943 |
|
Serpinb6a |
|
2526 |
23290 |
26890 |
14325 |
430447 |
|
0.1 |
-0.11 |
0.03 |
0.1 |
0.15 |
|
serpin B6 isoform b |
| 15826844 |
|
Serpinb6b |
|
0 |
0 |
42 |
0 |
73842 |
|
n.v. |
n.v. |
0.05 |
n.v. |
0.38 |
|
serine (or cysteine) proteinase inhibitor, clade B,
member 6b |
| 142347364 |
|
Serpinb6c |
|
0 |
0 |
42 |
0 |
910 |
|
n.v. |
n.v. |
0.05 |
n.v. |
0.2 |
|
serine proteinase inhibitor member 6C |
| 115647930 |
|
Serpinb6d |
|
0 |
0 |
0 |
0 |
6426 |
|
n.v. |
n.v. |
n.v. |
n.v. |
0.19 |
|
serine (or cysteine) peptidase inhibitor, clade B, member
6d |
| 6678101 |
|
Serpinb9 |
|
55 |
1651 |
4930 |
0 |
109355 |
|
0.85 |
-0.23 |
0.05 |
n.v. |
0.06 |
|
serine (or cysteine) proteinase inhibitor, clade B,
member 9 |
| 15826842 |
|
Serpinb9b |
|
0 |
0 |
1115 |
0 |
17478 |
|
n.v. |
n.v. |
0.2 |
n.v. |
0.02 |
|
serine (or cysteine) proteinase inhibitor, clade B,
member 9b |
| 33468935 |
|
Serpinb9d |
|
0 |
0 |
0 |
0 |
19588 |
|
n.v. |
n.v. |
n.v. |
n.v. |
-0.04 |
|
serine (or cysteine) proteinase inhibitor, clade B,
member 9d |
| 15826846 |
|
Serpinb9e |
|
0 |
0 |
0 |
0 |
19588 |
|
n.v. |
n.v. |
n.v. |
n.v. |
-0.04 |
|
serine (or cysteine) proteinase inhibitor, clade B,
member 9e |
| 60593101 |
|
Serpinb9f |
|
0 |
0 |
0 |
0 |
19588 |
|
n.v. |
n.v. |
n.v. |
n.v. |
-0.04 |
|
serine (or cysteine) proteinase inhibitor, clade B,
member 9f |
| 254675225 |
|
Serpinb9g |
|
0 |
0 |
0 |
0 |
19588 |
|
n.v. |
n.v. |
n.v. |
n.v. |
-0.04 |
|
serine (or cysteine) proteinase inhibitor, clade B,
member 9g |
| 170172562 |
|
Serpine1 |
|
0 |
136 |
86 |
0 |
0 |
|
n.v. |
-0.1 |
-0.3 |
n.v. |
n.v. |
|
plasminogen activator inhibitor 1 precursor |
| 161353502 |
|
Serpinh1 |
|
18214 |
9087 |
1659 |
0 |
1992 |
|
-0.05 |
-0.19 |
-0.5 |
n.v. |
0.28 |
|
serpin H1 precursor |
| 30425210 |
|
Sestd1 |
|
0 |
939 |
1971 |
10715 |
27116 |
|
n.v. |
-0.19 |
0.02 |
-0.03 |
0.09 |
|
SEC14 domain and spectrin repeat-containing protein
1 |
| 13591862 |
|
Set |
|
24109 |
6981 |
28460 |
14611 |
506217 |
|
0.24 |
0.18 |
-0.03 |
0.12 |
0.02 |
|
protein SET isoform 1 |
| 325910859 |
|
Set |
|
24109 |
6981 |
28223 |
19613 |
492819 |
|
0.24 |
0.18 |
-0.04 |
0.12 |
0.02 |
|
protein SET isoform 2 |
| 119508422 |
|
Setd1a |
|
0 |
0 |
0 |
82 |
161 |
|
n.v. |
n.v. |
n.v. |
3 |
-1.09 |
|
SET domain containing 1A |
| 268370088 |
|
Setd3 |
|
0 |
1451 |
32468 |
30565 |
0 |
|
n.v. |
0.24 |
0.02 |
-0.12 |
n.v. |
|
histone-lysine N-methyltransferase setd3 |
| 84490382 |
|
Setd7 |
|
0 |
0 |
0 |
0 |
4937 |
|
n.v. |
n.v. |
n.v. |
n.v. |
-0.08 |
|
histone-lysine N-methyltransferase SETD7 |
| 113722131 |
|
Setx |
|
0 |
0 |
86 |
0 |
0 |
|
n.v. |
n.v. |
-0.15 |
n.v. |
n.v. |
|
probable helicase senataxin |
| 160707945 |
|
Sf1 |
|
7835 |
555 |
440 |
434 |
14286 |
|
0.14 |
0.06 |
0.24 |
0.05 |
0.09 |
|
splicing factor 1 isoform 2 |
| 160707947 |
|
Sf1 |
|
7835 |
555 |
440 |
434 |
14286 |
|
0.14 |
0.06 |
0.24 |
0.05 |
0.09 |
|
splicing factor 1 isoform 1 |
| 165932270 |
|
Sf3a1 |
|
82542 |
15 |
5126 |
17828 |
8632 |
|
0.1 |
-0.87 |
0.08 |
0.05 |
-0.02 |
|
splicing factor 3A subunit 1 |
| 158749553 |
|
Sf3a2 |
|
0 |
0 |
29 |
7408 |
0 |
|
n.v. |
n.v. |
0.07 |
0.02 |
n.v. |
|
splicing factor 3A subunit 2 |
| 22095003 |
|
Sf3a3 |
|
9629 |
2131 |
3317 |
4928 |
0 |
|
-0.05 |
0.12 |
-0.04 |
0.1 |
n.v. |
|
splicing factor 3A subunit 3 |
| 153791358 |
|
Sf3b1 |
|
234225 |
1493 |
16250 |
35247 |
1714 |
|
0 |
-0.03 |
0.01 |
0.01 |
0.34 |
|
splicing factor 3B subunit 1 |
| 268837785 |
|
Sf3b2 |
|
70734 |
3234 |
14898 |
1727 |
10902 |
|
-0.14 |
-0.06 |
0.07 |
-0.06 |
0.07 |
|
splicing factor 3b, subunit 2 |
| 19527174 |
|
Sf3b3 |
|
253465 |
12243 |
31707 |
105757 |
44958 |
|
-0.04 |
0 |
0.02 |
0.03 |
-0.08 |
|
splicing factor 3B subunit 3 |
| 23346437 |
|
Sf3b4 |
|
0 |
278 |
1119 |
0 |
0 |
|
n.v. |
0.19 |
0.11 |
n.v. |
n.v. |
|
splicing factor 3B subunit 4 |
| 85540445 |
|
Sf3b5 |
|
6114 |
111 |
653 |
1342 |
707 |
|
0.06 |
0.04 |
-0.03 |
-0.05 |
0.18 |
|
splicing factor 3B subunit 5 |
| 134023662 |
|
Sfn |
|
322863 |
52399 |
63893 |
293231 |
492584 |
|
0.05 |
0.18 |
-0.03 |
0.02 |
0.07 |
|
14-3-3 protein sigma |
| 23956214 |
|
Sfpq |
|
347119 |
2881 |
31078 |
9356 |
0 |
|
-0.09 |
-0.14 |
-0.12 |
-0.27 |
n.v. |
|
splicing factor, proline- and glutamine-rich |
| 125662573 |
|
Sfr1 |
|
0 |
0 |
0 |
74 |
12262 |
|
n.v. |
n.v. |
n.v. |
0.49 |
0.16 |
|
swi5-dependent recombination DNA repair protein 1
homolog |
| 226437597 |
|
Sfrs18 |
|
0 |
1017 |
189 |
0 |
0 |
|
n.v. |
-0.21 |
0.04 |
n.v. |
n.v. |
|
arginine/serine-rich protein PNISR |
| 21704008 |
|
Sft2d2 |
|
1227 |
0 |
323 |
25 |
0 |
|
0.03 |
n.v. |
0.05 |
-0.36 |
n.v. |
|
vesicle transport protein SFT2B |
| 242247185 |
|
Sft2d3 |
|
0 |
992 |
0 |
0 |
0 |
|
n.v. |
-0.24 |
n.v. |
n.v. |
n.v. |
|
vesicle transport protein SFT2C |
| 15147224 |
|
Sfxn1 |
|
52868 |
12592 |
1954 |
0 |
0 |
|
-0.13 |
-0.22 |
-0.39 |
n.v. |
n.v. |
|
sideroflexin-1 |
| 86439984 |
|
Sfxn2 |
|
0 |
2474 |
0 |
0 |
0 |
|
n.v. |
-0.31 |
n.v. |
n.v. |
n.v. |
|
sideroflexin-2 |
| 16716499 |
|
Sfxn3 |
|
3991 |
24810 |
160 |
0 |
0 |
|
0.63 |
-0.15 |
-0.42 |
n.v. |
n.v. |
|
sideroflexin-3 isoform 1 |
| 295821210 |
|
Sfxn3 |
|
3991 |
24810 |
160 |
0 |
0 |
|
0.63 |
-0.15 |
-0.42 |
n.v. |
n.v. |
|
sideroflexin-3 isoform 2 |
| 295821212 |
|
Sfxn3 |
|
3991 |
23796 |
160 |
0 |
0 |
|
0.63 |
-0.15 |
-0.42 |
n.v. |
n.v. |
|
sideroflexin-3 isoform 3 |
| 31543694 |
|
Sgpl1 |
|
3515 |
3401 |
10375 |
0 |
0 |
|
-0.42 |
-0.26 |
-0.32 |
n.v. |
n.v. |
|
sphingosine-1-phosphate lyase 1 |
| 31543697 |
|
Sgsh |
|
0 |
800 |
97 |
0 |
8407 |
|
n.v. |
0.12 |
-0.98 |
n.v. |
0.05 |
|
N-sulfoglucosamine sulfohydrolase precursor |
| 21313588 |
|
Sgta |
|
494 |
4129 |
3770 |
5894 |
120503 |
|
0.17 |
-0.02 |
0.02 |
0.04 |
0.02 |
|
small glutamine-rich tetratricopeptide repeat-containing
protein alpha |
| 206597474 |
|
Sh2d4a |
|
0 |
2330 |
2315 |
0 |
36616 |
|
n.v. |
0.15 |
-0.26 |
n.v. |
0.02 |
|
SH2 domain-containing protein 4A |
| 9910548 |
|
Sh3bgrl |
|
73 |
528 |
1690 |
794 |
9296 |
|
0.48 |
0.25 |
0.08 |
0.25 |
0.19 |
|
SH3 domain-binding glutamic acid-rich-like protein |
| 27369694 |
|
Sh3bgrl2 |
|
1025 |
820 |
1440 |
958 |
1349 |
|
0.13 |
0.09 |
-0.03 |
-0.08 |
-0.12 |
|
SH3 domain-binding glutamic acid-rich-like protein 2 |
| 18017602 |
|
Sh3bgrl3 |
|
5400 |
35 |
1352 |
33 |
2817 |
|
-0.04 |
-0.1 |
-0.22 |
-0.57 |
0.05 |
|
SH3 domain-binding glutamic acid-rich-like protein 3 |
| 85838509 |
|
Sh3bp1 |
|
0 |
58 |
328 |
1989 |
150 |
|
n.v. |
-0.98 |
0.31 |
0.1 |
0.02 |
|
SH3 domain-binding protein 1 |
| 19527036 |
|
Sh3bp4 |
|
0 |
0 |
1553 |
0 |
0 |
|
n.v. |
n.v. |
0.08 |
n.v. |
n.v. |
|
SH3 domain-binding protein 4 |
| 170671710 |
|
Sh3d19 |
|
0 |
0 |
85 |
0 |
0 |
|
n.v. |
n.v. |
0.49 |
n.v. |
n.v. |
|
SH3 domain-containing protein 19 |
| 357197145 |
|
Sh3gl1 |
|
0 |
1657 |
537 |
2660 |
4851 |
|
n.v. |
0.36 |
0.28 |
0.08 |
0.38 |
|
endophilin-A2 isoform 2 |
| 7305485 |
|
Sh3gl1 |
|
0 |
1657 |
607 |
2718 |
6490 |
|
n.v. |
0.36 |
0.38 |
0.08 |
0.22 |
|
endophilin-A2 isoform 1 |
| 31560792 |
|
Sh3gl2 |
|
0 |
399 |
318 |
3094 |
2495 |
|
n.v. |
0.53 |
0.38 |
0.23 |
-0.23 |
|
endophilin-A1 |
| 530677952 |
|
Sh3glb1 |
|
494 |
0 |
0 |
0 |
0 |
|
0.01 |
n.v. |
n.v. |
n.v. |
n.v. |
|
endophilin-B1 isoform 1 |
| 530677964 |
|
Sh3glb1 |
|
494 |
0 |
0 |
0 |
0 |
|
0.01 |
n.v. |
n.v. |
n.v. |
n.v. |
|
endophilin-B1 isoform 3 |
| 9507097 |
|
Sh3glb1 |
|
494 |
2649 |
5884 |
5951 |
5676 |
|
0.01 |
0.52 |
0.07 |
-0.35 |
0.21 |
|
endophilin-B1 isoform 2 |
| 21314838 |
|
Sh3glb2 |
|
0 |
0 |
759 |
0 |
857 |
|
n.v. |
n.v. |
-0.02 |
n.v. |
-0.68 |
|
endophilin-B2 |
| 7305487 |
|
Sh3yl1 |
|
0 |
2503 |
3194 |
1252 |
0 |
|
n.v. |
0.28 |
0.13 |
0.08 |
n.v. |
|
SH3 domain-containing YSC84-like protein 1 |
| 15778828 |
|
Shc1 |
|
0 |
983 |
316 |
0 |
1371 |
|
n.v. |
0.18 |
-0.37 |
n.v. |
0.13 |
|
SHC-transforming protein 1 isoform b |
| 164664522 |
|
Shc1 |
|
0 |
983 |
316 |
0 |
1371 |
|
n.v. |
0.18 |
-0.37 |
n.v. |
0.13 |
|
SHC-transforming protein 1 isoform a |
| 6755508 |
|
Shcbp1 |
|
0 |
0 |
0 |
0 |
289 |
|
n.v. |
n.v. |
n.v. |
n.v. |
0.21 |
|
SHC SH2 domain-binding protein 1 |
| 21617861 |
|
Shh |
|
0 |
328 |
549 |
0 |
0 |
|
n.v. |
0.03 |
-0.2 |
n.v. |
n.v. |
|
sonic hedgehog protein precursor |
| 291463305 |
|
Shisa9 |
|
0 |
0 |
45 |
0 |
0 |
|
n.v. |
n.v. |
-0.13 |
n.v. |
n.v. |
|
protein shisa-9 isoform 2 |
| 291463307 |
|
Shisa9 |
|
0 |
0 |
45 |
0 |
0 |
|
n.v. |
n.v. |
-0.13 |
n.v. |
n.v. |
|
protein shisa-9 isoform 1 precursor |
| 67846103 |
|
Shmt1 |
|
33921 |
16729 |
5689 |
47042 |
94618 |
|
0 |
-0.07 |
-0.07 |
0.06 |
0.05 |
|
serine hydroxymethyltransferase, cytosolic |
| 21312298 |
|
Shmt2 |
|
382211 |
91446 |
7243 |
12606 |
9992 |
|
-0.1 |
-0.14 |
-0.34 |
-0.1 |
0.12 |
|
serine hydroxymethyltransferase, mitochondrial isoform
1 |
| 356640163 |
|
Shmt2 |
|
382211 |
91446 |
7243 |
12606 |
9992 |
|
-0.1 |
-0.14 |
-0.34 |
-0.1 |
0.12 |
|
serine hydroxymethyltransferase, mitochondrial isoform
2 |
| 31543701 |
|
Shoc2 |
|
0 |
2152 |
2453 |
704 |
0 |
|
n.v. |
0 |
-0.15 |
0.44 |
n.v. |
|
leucine-rich repeat protein SHOC-2 |
| 22095001 |
|
Shpk |
|
0 |
0 |
0 |
0 |
21 |
|
n.v. |
n.v. |
n.v. |
n.v. |
0.3 |
|
sedoheptulokinase |
| 166998470 |
|
Shq1 |
|
0 |
0 |
0 |
0 |
1007 |
|
n.v. |
n.v. |
n.v. |
n.v. |
-0.24 |
|
protein SHQ1 homolog |
| 94818779 |
|
Shroom4 |
|
0 |
0 |
19 |
0 |
0 |
|
n.v. |
n.v. |
0.4 |
n.v. |
n.v. |
|
protein Shroom4 |
| 31560532 |
|
Siae |
|
0 |
3039 |
702 |
0 |
17392 |
|
n.v. |
-0.18 |
-0.28 |
n.v. |
-0.34 |
|
sialate O-acetylesterase precursor |
| 26986551 |
|
Sidt2 |
|
0 |
140 |
440 |
0 |
0 |
|
n.v. |
-0.06 |
-0.17 |
n.v. |
n.v. |
|
SID1 transmembrane family member 2 precursor |
| 134032002 |
|
Siglece |
|
0 |
2551 |
0 |
0 |
0 |
|
n.v. |
-2.81 |
n.v. |
n.v. |
n.v. |
|
sialic acid-binding Ig-like lectin 12 precursor |
| 13385140 |
|
Sike1 |
|
0 |
0 |
0 |
0 |
54 |
|
n.v. |
n.v. |
n.v. |
n.v. |
1.11 |
|
suppressor of IKBKE 1 |
| 257196264 |
|
Sil1 |
|
0 |
79 |
18 |
0 |
0 |
|
n.v. |
-0.36 |
-0.11 |
n.v. |
n.v. |
|
nucleotide exchange factor SIL1 precursor |
| 160333357 |
|
Sin3a |
|
110 |
0 |
0 |
0 |
0 |
|
-0.12 |
n.v. |
n.v. |
n.v. |
n.v. |
|
paired amphipathic helix protein Sin3a isoform 1 |
| 160333360 |
|
Sin3a |
|
110 |
0 |
0 |
0 |
0 |
|
-0.12 |
n.v. |
n.v. |
n.v. |
n.v. |
|
paired amphipathic helix protein Sin3a isoform 2 |
| 227430309 |
|
Sirt1 |
|
0 |
0 |
0 |
0 |
1028 |
|
n.v. |
n.v. |
n.v. |
n.v. |
-0.19 |
|
NAD-dependent protein deacetylase sirtuin-1 isoform 2 |
| 9790229 |
|
Sirt1 |
|
0 |
0 |
0 |
0 |
1028 |
|
n.v. |
n.v. |
n.v. |
n.v. |
-0.19 |
|
NAD-dependent protein deacetylase sirtuin-1 isoform 1 |
| 170650630 |
|
Sirt2 |
|
0 |
616 |
307 |
0 |
8075 |
|
n.v. |
0.35 |
0.07 |
n.v. |
0.21 |
|
NAD-dependent protein deacetylase sirtuin-2 isoform 1 |
| 170650632 |
|
Sirt2 |
|
0 |
616 |
307 |
0 |
8075 |
|
n.v. |
0.35 |
0.07 |
n.v. |
0.21 |
|
NAD-dependent protein deacetylase sirtuin-2 isoform 2 |
| 170650634 |
|
Sirt2 |
|
0 |
324 |
48 |
0 |
6115 |
|
n.v. |
0.37 |
0.19 |
n.v. |
0.14 |
|
NAD-dependent protein deacetylase sirtuin-2 isoform 3 |
| 267844847 |
|
Sirt4 |
|
0 |
94 |
0 |
0 |
0 |
|
n.v. |
-0.53 |
n.v. |
n.v. |
n.v. |
|
NAD-dependent protein deacetylase sirtuin-4 |
| 30578432 |
|
Sirt5 |
|
0 |
188 |
6 |
0 |
1328 |
|
n.v. |
-0.44 |
0.33 |
n.v. |
0.02 |
|
NAD-dependent protein deacylase sirtuin-5,
mitochondrial |
| 254939656 |
|
Sirt6 |
|
0 |
0 |
89 |
0 |
0 |
|
n.v. |
n.v. |
-0.51 |
n.v. |
n.v. |
|
NAD-dependent protein deacetylase sirtuin-6 isoform 2 |
| 31712018 |
|
Sirt6 |
|
0 |
0 |
89 |
0 |
0 |
|
n.v. |
n.v. |
-0.51 |
n.v. |
n.v. |
|
NAD-dependent protein deacetylase sirtuin-6 isoform 1 |
| 240120126 |
|
Siva1 |
|
0 |
50 |
0 |
0 |
2752 |
|
n.v. |
1.31 |
n.v. |
n.v. |
0.15 |
|
apoptosis regulatory protein Siva isoform 1 |
| 240120128 |
|
Siva1 |
|
0 |
50 |
0 |
0 |
1382 |
|
n.v. |
1.31 |
n.v. |
n.v. |
0.17 |
|
apoptosis regulatory protein Siva isoform 2 |
| 87252727 |
|
Skiv2l |
|
0 |
0 |
1510 |
786 |
0 |
|
n.v. |
n.v. |
-0.06 |
0.07 |
n.v. |
|
superkiller viralicidic activity 2-like |
| 21312352 |
|
Skiv2l2 |
|
0 |
0 |
2555 |
28494 |
2292 |
|
n.v. |
n.v. |
-0.16 |
-0.03 |
-0.17 |
|
superkiller viralicidic activity 2-like 2 |
| 158854016 |
|
Skp1a |
|
11588 |
5094 |
6712 |
34535 |
27898 |
|
0.04 |
0.13 |
-0.02 |
0.13 |
0.07 |
|
S-phase kinase-associated protein 1 |
| 371119693 |
|
Slc10a3 |
|
1556 |
0 |
0 |
0 |
0 |
|
0.03 |
n.v. |
n.v. |
n.v. |
n.v. |
|
P3 protein |
| 119226231 |
|
Slc12a1 |
|
0 |
0 |
480 |
0 |
0 |
|
n.v. |
n.v. |
-0.46 |
n.v. |
n.v. |
|
solute carrier family 12 member 1 isoform A |
| 119226233 |
|
Slc12a1 |
|
0 |
0 |
480 |
0 |
0 |
|
n.v. |
n.v. |
-0.46 |
n.v. |
n.v. |
|
solute carrier family 12 member 1 isoform F |
| 124517716 |
|
Slc12a2 |
|
330 |
4430 |
8123 |
0 |
0 |
|
0.08 |
0.14 |
0.02 |
n.v. |
n.v. |
|
solute carrier family 12 member 2 |
| 6755534 |
|
Slc12a7 |
|
0 |
119 |
2562 |
0 |
0 |
|
n.v. |
0.11 |
-0.04 |
n.v. |
n.v. |
|
solute carrier family 12 member 7 |
| 281371456 |
|
Slc12a9 |
|
0 |
507 |
1234 |
0 |
0 |
|
n.v. |
-0.04 |
-0.14 |
n.v. |
n.v. |
|
solute carrier family 12 member 9 |
| 19527112 |
|
Slc15a4 |
|
0 |
4 |
4 |
0 |
0 |
|
n.v. |
1.24 |
-0.74 |
n.v. |
n.v. |
|
solute carrier family 15 member 4 |
| 6677995 |
|
Slc16a1 |
|
64236 |
12373 |
70852 |
5280 |
0 |
|
0.18 |
0.19 |
0.07 |
0.11 |
n.v. |
|
monocarboxylate transporter 1 |
| 166999494 |
|
Slc16a10 |
|
0 |
380 |
544 |
0 |
0 |
|
n.v. |
0.2 |
0.02 |
n.v. |
n.v. |
|
monocarboxylate transporter 10 isoform 1 |
| 30794382 |
|
Slc16a10 |
|
0 |
127 |
306 |
0 |
0 |
|
n.v. |
0.05 |
-0.1 |
n.v. |
n.v. |
|
monocarboxylate transporter 10 isoform 2 |
| 114326474 |
|
Slc1a5 |
|
0 |
649 |
1263 |
0 |
0 |
|
n.v. |
-0.06 |
0 |
n.v. |
n.v. |
|
neutral amino acid transporter B(0) |
| 42741686 |
|
Slc23a1 |
|
0 |
0 |
373 |
0 |
0 |
|
n.v. |
n.v. |
0.14 |
n.v. |
n.v. |
|
solute carrier family 23 member 1 |
| 23943838 |
|
Slc25a1 |
|
110385 |
31962 |
4568 |
0 |
0 |
|
-0.16 |
-0.13 |
-0.39 |
n.v. |
n.v. |
|
solute carrier family 25, member 1 |
| 254826790 |
|
Slc25a10 |
|
90761 |
44222 |
7322 |
0 |
0 |
|
-0.06 |
-0.17 |
-0.35 |
n.v. |
n.v. |
|
mitochondrial dicarboxylate carrier |
| 21312994 |
|
Slc25a11 |
|
183463 |
29380 |
10109 |
0 |
0 |
|
-0.07 |
-0.13 |
-0.32 |
n.v. |
n.v. |
|
mitochondrial 2-oxoglutarate/malate carrier protein |
| 27369581 |
|
Slc25a12 |
|
71485 |
60223 |
2729 |
0 |
0 |
|
0.06 |
-0.1 |
-0.43 |
n.v. |
n.v. |
|
calcium-binding mitochondrial carrier protein
Aralar1 |
| 294832028 |
|
Slc25a13 |
|
99182 |
89204 |
8162 |
0 |
0 |
|
0.08 |
-0.08 |
-0.39 |
n.v. |
n.v. |
|
calcium-binding mitochondrial carrier protein Aralar2
isoform 2 |
| 7657583 |
|
Slc25a13 |
|
99182 |
89204 |
8162 |
0 |
0 |
|
0.08 |
-0.08 |
-0.39 |
n.v. |
n.v. |
|
calcium-binding mitochondrial carrier protein Aralar2
isoform 1 |
| 31044465 |
|
Slc25a15 |
|
0 |
386 |
0 |
0 |
0 |
|
n.v. |
0.09 |
n.v. |
n.v. |
n.v. |
|
mitochondrial ornithine transporter 1 isoform 1 |
| 30424808 |
|
Slc25a16 |
|
0 |
1756 |
0 |
0 |
0 |
|
n.v. |
0.1 |
n.v. |
n.v. |
n.v. |
|
graves disease carrier protein homolog |
| 29789024 |
|
Slc25a17 |
|
1190 |
2363 |
1032 |
0 |
0 |
|
-0.13 |
0.02 |
-0.21 |
n.v. |
n.v. |
|
peroxisomal membrane protein PMP34 |
| 10048462 |
|
Slc25a20 |
|
12814 |
15239 |
1585 |
0 |
0 |
|
0.1 |
-0.15 |
-0.36 |
n.v. |
n.v. |
|
mitochondrial carnitine/acylcarnitine carrier protein |
| 294831970 |
|
Slc25a22 |
|
0 |
2401 |
0 |
0 |
0 |
|
n.v. |
-0.12 |
n.v. |
n.v. |
n.v. |
|
mitochondrial glutamate carrier 1 |
| 27369998 |
|
Slc25a24 |
|
16201 |
14942 |
7182 |
0 |
0 |
|
-0.07 |
-0.12 |
-0.53 |
n.v. |
n.v. |
|
calcium-binding mitochondrial carrier protein
SCaMC-1 |
| 27754081 |
|
Slc25a26 |
|
73 |
0 |
0 |
0 |
0 |
|
-0.27 |
n.v. |
n.v. |
n.v. |
n.v. |
|
S-adenosylmethionine mitochondrial carrier protein |
| 21312006 |
|
Slc25a27 |
|
0 |
1728 |
866 |
0 |
0 |
|
n.v. |
-0.16 |
-0.34 |
n.v. |
n.v. |
|
mitochondrial uncoupling protein 4 |
| 31044469 |
|
Slc25a29 |
|
0 |
286 |
0 |
0 |
0 |
|
n.v. |
-0.26 |
n.v. |
n.v. |
n.v. |
|
mitochondrial carnitine/acylcarnitine carrier protein
CACL |
| 19526818 |
|
Slc25a3 |
|
2506789 |
256530 |
67557 |
6999 |
0 |
|
-0.01 |
-0.13 |
-0.44 |
-0.58 |
n.v. |
|
phosphate carrier protein, mitochondrial precursor |
| 13385736 |
|
Slc25a30 |
|
0 |
286 |
0 |
0 |
0 |
|
n.v. |
0.08 |
n.v. |
n.v. |
n.v. |
|
kidney mitochondrial carrier protein 1 |
| 254692892 |
|
Slc25a31 |
|
847093 |
30695 |
13742 |
655 |
0 |
|
-0.06 |
-0.2 |
-0.35 |
-0.41 |
n.v. |
|
ADP/ATP translocase 4 |
| 168480117 |
|
Slc25a32 |
|
0 |
96 |
0 |
0 |
0 |
|
n.v. |
-1.02 |
n.v. |
n.v. |
n.v. |
|
mitochondrial folate transporter/carrier |
| 148747424 |
|
Slc25a4 |
|
1325374 |
149585 |
44716 |
3986 |
0 |
|
-0.01 |
-0.15 |
-0.27 |
-0.4 |
n.v. |
|
ADP/ATP translocase 1 |
| 158749545 |
|
Slc25a40 |
|
586 |
701 |
0 |
0 |
0 |
|
0.34 |
0.09 |
n.v. |
n.v. |
n.v. |
|
solute carrier family 25 member 40 |
| 23956272 |
|
Slc25a45 |
|
0 |
92 |
0 |
0 |
0 |
|
n.v. |
-0.03 |
n.v. |
n.v. |
n.v. |
|
solute carrier family 25 member 45 |
| 254692847 |
|
Slc25a48 |
|
0 |
2323 |
0 |
0 |
0 |
|
n.v. |
-0.13 |
n.v. |
n.v. |
n.v. |
|
solute carrier family 25 member 48 |
| 22094075 |
|
Slc25a5 |
|
1426185 |
249692 |
43878 |
2922 |
0 |
|
-0.03 |
-0.15 |
-0.33 |
-0.39 |
n.v. |
|
ADP/ATP translocase 2 |
| 6755546 |
|
Slc27a1 |
|
0 |
102 |
105 |
0 |
0 |
|
n.v. |
-0.25 |
-0.42 |
n.v. |
n.v. |
|
long-chain fatty acid transport protein 1 |
| 45597453 |
|
Slc27a4 |
|
0 |
1344 |
994 |
0 |
0 |
|
n.v. |
-0.49 |
-0.29 |
n.v. |
n.v. |
|
long-chain fatty acid transport protein 4 |
| 12584968 |
|
Slc29a1 |
|
0 |
8 |
38 |
0 |
0 |
|
n.v. |
0.47 |
0.47 |
n.v. |
n.v. |
|
equilibrative nucleoside transporter 1 isoform 2 |
| 312283707 |
|
Slc29a1 |
|
0 |
8 |
38 |
0 |
0 |
|
n.v. |
0.47 |
0.47 |
n.v. |
n.v. |
|
equilibrative nucleoside transporter 1 isoform 1 |
| 165377226 |
|
Slc2a1 |
|
3057 |
2382 |
6651 |
3855 |
0 |
|
0.11 |
0.23 |
0.16 |
-0.3 |
n.v. |
|
solute carrier family 2, facilitated glucose transporter
member 1 |
| 6678017 |
|
Slc30a1 |
|
0 |
0 |
367 |
0 |
0 |
|
n.v. |
n.v. |
0.02 |
n.v. |
n.v. |
|
zinc transporter 1 |
| 12963579 |
|
Slc30a7 |
|
4522 |
4110 |
1959 |
0 |
0 |
|
-0.37 |
-0.13 |
-0.45 |
n.v. |
n.v. |
|
zinc transporter 7 |
| 227116313 |
|
Slc31a1 |
|
0 |
0 |
79 |
0 |
0 |
|
n.v. |
n.v. |
-0.23 |
n.v. |
n.v. |
|
high affinity copper uptake protein 1 |
| 13384632 |
|
Slc31a2 |
|
0 |
0 |
23 |
0 |
0 |
|
n.v. |
n.v. |
0.14 |
n.v. |
n.v. |
|
probable low affinity copper uptake protein 2 |
| 31543730 |
|
Slc33a1 |
|
1281 |
1635 |
1156 |
0 |
0 |
|
0.48 |
-0.04 |
-0.2 |
n.v. |
n.v. |
|
acetyl-coenzyme A transporter 1 |
| 225543514 |
|
Slc35a1 |
|
0 |
213 |
23 |
0 |
0 |
|
n.v. |
-0.32 |
-0.42 |
n.v. |
n.v. |
|
CMP-sialic acid transporter |
| 145279183 |
|
Slc35a2 |
|
0 |
144 |
0 |
0 |
0 |
|
n.v. |
-0.23 |
n.v. |
n.v. |
n.v. |
|
UDP-galactose translocator isoform 1 |
| 145279202 |
|
Slc35a2 |
|
0 |
144 |
0 |
0 |
0 |
|
n.v. |
-0.23 |
n.v. |
n.v. |
n.v. |
|
UDP-galactose translocator isoform 2 |
| 21450281 |
|
Slc35a3 |
|
0 |
480 |
88 |
0 |
0 |
|
n.v. |
-0.08 |
0.01 |
n.v. |
n.v. |
|
UDP-N-acetylglucosamine transporter |
| 7949137 |
|
Slc35b1 |
|
0 |
127 |
13 |
0 |
0 |
|
n.v. |
-0.14 |
-0.26 |
n.v. |
n.v. |
|
solute carrier family 35 member B1 |
| 110625963 |
|
Slc35b2 |
|
0 |
23867 |
17310 |
0 |
0 |
|
n.v. |
-0.38 |
-0.51 |
n.v. |
n.v. |
|
adenosine 3'-phospho 5'-phosphosulfate transporter 1 |
| 165377022 |
|
Slc35e1 |
|
73 |
38 |
0 |
0 |
0 |
|
-0.08 |
0.13 |
n.v. |
n.v. |
n.v. |
|
solute carrier family 35 member E1 |
| 160333206 |
|
Slc35f2 |
|
0 |
0 |
692 |
0 |
0 |
|
n.v. |
n.v. |
-0.62 |
n.v. |
n.v. |
|
solute carrier family 35 member F2 |
| 188497646 |
|
Slc35f6 |
|
12228 |
44 |
375 |
0 |
0 |
|
-0.03 |
-0.21 |
-0.23 |
-0.13 |
n.v. |
|
solute carrier family 35 member F6 precursor |
| 145207965 |
|
Slc36a1 |
|
0 |
0 |
22 |
0 |
0 |
|
n.v. |
n.v. |
-0.45 |
n.v. |
n.v. |
|
proton-coupled amino acid transporter 1 |
| 258645131 |
|
Slc38a10 |
|
0 |
127 |
0 |
0 |
0 |
|
n.v. |
-0.2 |
n.v. |
n.v. |
n.v. |
|
putative sodium-coupled neutral amino acid transporter 10
isoform 1 |
| 258645133 |
|
Slc38a10 |
|
0 |
127 |
0 |
0 |
0 |
|
n.v. |
-0.2 |
n.v. |
n.v. |
n.v. |
|
putative sodium-coupled neutral amino acid transporter 10
isoform 2 |
| 258645135 |
|
Slc38a10 |
|
0 |
127 |
0 |
0 |
0 |
|
n.v. |
-0.2 |
n.v. |
n.v. |
n.v. |
|
putative sodium-coupled neutral amino acid transporter 10
isoform 3 |
| 258645137 |
|
Slc38a10 |
|
0 |
127 |
0 |
0 |
0 |
|
n.v. |
-0.2 |
n.v. |
n.v. |
n.v. |
|
putative sodium-coupled neutral amino acid transporter 10
isoform 4 |
| 27370116 |
|
Slc38a7 |
|
0 |
1142 |
752 |
0 |
0 |
|
n.v. |
-0.17 |
-0.22 |
n.v. |
n.v. |
|
putative sodium-coupled neutral amino acid transporter
7 |
| 262073041 |
|
Slc39a11 |
|
0 |
0 |
16 |
0 |
0 |
|
n.v. |
n.v. |
-1.04 |
n.v. |
n.v. |
|
zinc transporter ZIP11 isoform 2 |
| 262073043 |
|
Slc39a11 |
|
0 |
0 |
16 |
0 |
0 |
|
n.v. |
n.v. |
-1.04 |
n.v. |
n.v. |
|
zinc transporter ZIP11 isoform 1 |
| 118150670 |
|
Slc39a7 |
|
5272 |
129 |
95 |
0 |
0 |
|
0.09 |
-0.17 |
-0.3 |
n.v. |
n.v. |
|
zinc transporter SLC39A7 precursor |
| 238637277 |
|
Slc3a2 |
|
11734 |
7853 |
15116 |
0 |
0 |
|
0.14 |
0.45 |
0.07 |
n.v. |
n.v. |
|
4F2 cell-surface antigen heavy chain isoform a |
| 238637279 |
|
Slc3a2 |
|
11734 |
7853 |
15116 |
0 |
0 |
|
0.14 |
0.45 |
0.07 |
n.v. |
n.v. |
|
4F2 cell-surface antigen heavy chain isoform b |
| 124248585 |
|
Slc40a1 |
|
0 |
307 |
124 |
0 |
0 |
|
n.v. |
0.2 |
0.03 |
n.v. |
n.v. |
|
solute carrier family 40 member 1 |
| 313482803 |
|
Slc43a2 |
|
0 |
0 |
15 |
0 |
0 |
|
n.v. |
n.v. |
-0.33 |
n.v. |
n.v. |
|
large neutral amino acids transporter small subunit 4 |
| 227499980 |
|
Slc44a1 |
|
0 |
7231 |
11512 |
2480 |
0 |
|
n.v. |
-0.15 |
-0.17 |
-0.72 |
n.v. |
|
choline transporter-like protein 1 isoform A |
| 227499988 |
|
Slc44a1 |
|
0 |
6169 |
7898 |
2251 |
0 |
|
n.v. |
-0.11 |
-0.17 |
-0.44 |
n.v. |
|
choline transporter-like protein 1 isoform B |
| 22779895 |
|
Slc44a2 |
|
0 |
1820 |
11423 |
319 |
0 |
|
n.v. |
-0.24 |
-0.11 |
-0.07 |
n.v. |
|
choline transporter-like protein 2 isoform 2 |
| 312596932 |
|
Slc44a2 |
|
0 |
1820 |
11423 |
319 |
0 |
|
n.v. |
-0.24 |
-0.11 |
-0.07 |
n.v. |
|
choline transporter-like protein 2 isoform 1 |
| 225579159 |
|
Slc44a3 |
|
0 |
785 |
1039 |
0 |
0 |
|
n.v. |
-0.2 |
-0.26 |
n.v. |
n.v. |
|
choline transporter-like protein 3 |
| 12963733 |
|
Slc44a4 |
|
0 |
46 |
1572 |
0 |
0 |
|
n.v. |
-0.01 |
-0.31 |
n.v. |
n.v. |
|
choline transporter-like protein 4 |
| 225543517 |
|
Slc46a2 |
|
0 |
0 |
417 |
0 |
0 |
|
n.v. |
n.v. |
-0.21 |
n.v. |
n.v. |
|
thymic stromal cotransporter protein |
| 85702045 |
|
Slc47a2 |
|
2087 |
0 |
559 |
3070 |
0 |
|
-0.09 |
n.v. |
-0.03 |
0.18 |
n.v. |
|
multidrug and toxin extrusion protein 2 |
| 155722992 |
|
Slc4a1ap |
|
0 |
0 |
211 |
1236 |
2249 |
|
n.v. |
n.v. |
-0.23 |
-0.14 |
-0.08 |
|
solute carrier family 4 (anion exchanger), member 1,
adaptor protein |
| 359751389 |
|
Slc4a2 |
|
0 |
405 |
0 |
0 |
0 |
|
n.v. |
-0.2 |
n.v. |
n.v. |
n.v. |
|
anion exchange protein 2 |
| 161169001;359751389 |
|
Slc4a2 |
|
0 |
0 |
2616 |
0 |
0 |
|
n.v. |
n.v. |
-0.17 |
n.v. |
n.v. |
|
anion exchange protein 2 |
| 165377246 |
|
Slc4a3 |
|
0 |
403 |
1089 |
0 |
0 |
|
n.v. |
-0.31 |
-0.43 |
n.v. |
n.v. |
|
anion exchange protein 3 |
| 133922580 |
|
Slc4a4 |
|
0 |
152 |
161 |
0 |
0 |
|
n.v. |
-0.08 |
0.03 |
n.v. |
n.v. |
|
electrogenic sodium bicarbonate cotransporter 1 isoform
a |
| 210147430 |
|
Slc4a4 |
|
0 |
152 |
161 |
0 |
0 |
|
n.v. |
-0.08 |
0.03 |
n.v. |
n.v. |
|
electrogenic sodium bicarbonate cotransporter 1 isoform
b |
| 308210768 |
|
Slc4a4 |
|
0 |
152 |
161 |
0 |
0 |
|
n.v. |
-0.08 |
0.03 |
n.v. |
n.v. |
|
electrogenic sodium bicarbonate cotransporter 1 isoform
c |
| 117320529 |
|
Slc4a7 |
|
0 |
106 |
135 |
0 |
0 |
|
n.v. |
0.13 |
-0.14 |
n.v. |
n.v. |
|
sodium bicarbonate cotransporter 3 |
| 22122353 |
|
Slc51a |
|
0 |
5851 |
0 |
0 |
0 |
|
n.v. |
0.27 |
n.v. |
n.v. |
n.v. |
|
organic solute transporter subunit alpha |
| 148536859 |
|
Slc5a3 |
|
0 |
463 |
729 |
0 |
0 |
|
n.v. |
0 |
0.08 |
n.v. |
n.v. |
|
sodium/myo-inositol cotransporter |
| 31982828 |
|
Slc6a6 |
|
3277 |
2 |
129 |
0 |
0 |
|
0.77 |
-0.01 |
0.34 |
n.v. |
n.v. |
|
sodium- and chloride-dependent taurine transporter |
| 161016790 |
|
Slc7a1 |
|
4485 |
2284 |
6292 |
0 |
0 |
|
0.32 |
-0.06 |
0.09 |
n.v. |
n.v. |
|
high affinity cationic amino acid transporter 1 |
| 6756011 |
|
Slc7a11 |
|
0 |
0 |
133 |
0 |
0 |
|
n.v. |
n.v. |
0.01 |
n.v. |
n.v. |
|
cystine/glutamate transporter |
| 113680233 |
|
Slc7a2 |
|
0 |
376 |
85 |
0 |
0 |
|
n.v. |
0.05 |
-0.24 |
n.v. |
n.v. |
|
low affinity cationic amino acid transporter 2 isoform
2 |
| 31982764 |
|
Slc7a5 |
|
0 |
1240 |
2821 |
0 |
0 |
|
n.v. |
-0.06 |
0.03 |
n.v. |
n.v. |
|
large neutral amino acids transporter small subunit 1 |
| 57222272 |
|
Slc7a6os |
|
0 |
0 |
0 |
0 |
1960 |
|
n.v. |
n.v. |
n.v. |
n.v. |
-0.55 |
|
probable RNA polymerase II nuclear localization protein
SLC7A6OS |
| 8567404 |
|
Slc9a1 |
|
0 |
23 |
113 |
0 |
0 |
|
n.v. |
0.3 |
-0.28 |
n.v. |
n.v. |
|
sodium/hydrogen exchanger 1 |
| 6755566 |
|
Slc9a3r1 |
|
40127 |
10897 |
71997 |
4510 |
435384 |
|
0.08 |
-0.18 |
-0.45 |
-0.1 |
0.02 |
|
Na(+)/H(+) exchange regulatory cofactor NHE-RF1 |
| 84490391 |
|
Slfn4 |
|
0 |
597 |
4686 |
12475 |
0 |
|
n.v. |
0.18 |
0.17 |
0.05 |
n.v. |
|
schlafen 4 |
| 268370030 |
|
Slfn8 |
|
0 |
0 |
0 |
0 |
1831 |
|
n.v. |
n.v. |
n.v. |
n.v. |
0.16 |
|
schlafen 8 isoform 1 |
| 116089296 |
|
Slfn9 |
|
0 |
0 |
0 |
0 |
3898 |
|
n.v. |
n.v. |
n.v. |
n.v. |
0.25 |
|
schlafen 9 |
| 283046784 |
|
Slirp |
|
952 |
1025 |
0 |
0 |
0 |
|
-0.07 |
-0.43 |
-1.36 |
n.v. |
n.v. |
|
SRA stem-loop-interacting RNA-binding protein,
mitochondrial |
| 257467552 |
|
Slk |
|
0 |
3707 |
2887 |
25236 |
240353 |
|
n.v. |
0.1 |
0.05 |
0.18 |
0.16 |
|
STE20-like serine/threonine-protein kinase isoform 1 |
| 257467554 |
|
Slk |
|
0 |
3707 |
2887 |
24549 |
239197 |
|
n.v. |
0.1 |
0.05 |
0.14 |
0.15 |
|
STE20-like serine/threonine-protein kinase isoform 2 |
| 13384954 |
|
Slmo2 |
|
0 |
42 |
0 |
0 |
0 |
|
n.v. |
0.14 |
n.v. |
n.v. |
n.v. |
|
protein slowmo homolog 2 |
| 31543220 |
|
Smad1 |
|
0 |
0 |
105 |
1645 |
0 |
|
n.v. |
n.v. |
0.5 |
0.59 |
n.v. |
|
mothers against decapentaplegic homolog 1 |
| 31560568 |
|
Smad2 |
|
0 |
712 |
1639 |
8087 |
4037 |
|
n.v. |
0.26 |
0.32 |
0.59 |
0.61 |
|
mothers against decapentaplegic homolog 2 |
| 254675249 |
|
Smad3 |
|
0 |
649 |
493 |
2628 |
0 |
|
n.v. |
-0.13 |
0.01 |
0.59 |
n.v. |
|
mothers against decapentaplegic homolog 3 |
| 255708405 |
|
Smad5 |
|
0 |
0 |
105 |
1645 |
0 |
|
n.v. |
n.v. |
0.5 |
0.59 |
n.v. |
|
mothers against decapentaplegic homolog 5 |
| 84490384 |
|
Smad9 |
|
0 |
649 |
326 |
1645 |
0 |
|
n.v. |
-0.13 |
0.02 |
0.59 |
n.v. |
|
mothers against decapentaplegic homolog 9 |
| 262050608 |
|
Smarca1 |
|
9043 |
0 |
0 |
0 |
0 |
|
0.03 |
n.v. |
n.v. |
n.v. |
n.v. |
|
probable global transcription activator SNF2L1 |
| 21313112 |
|
Smarca2 |
|
0 |
0 |
0 |
0 |
975 |
|
n.v. |
n.v. |
n.v. |
n.v. |
-0.6 |
|
probable global transcription activator SNF2L2 isoform
2 |
| 51593084 |
|
Smarca2 |
|
549 |
0 |
0 |
0 |
975 |
|
0.04 |
n.v. |
n.v. |
n.v. |
-0.6 |
|
probable global transcription activator SNF2L2 isoform
1 |
| 291463269 |
|
Smarca4 |
|
20283 |
0 |
0 |
0 |
975 |
|
-0.14 |
n.v. |
n.v. |
n.v. |
-0.6 |
|
transcription activator BRG1 isoform 1 |
| 291463271 |
|
Smarca4 |
|
20283 |
0 |
0 |
0 |
975 |
|
-0.14 |
n.v. |
n.v. |
n.v. |
-0.6 |
|
transcription activator BRG1 isoform 3 |
| 76253779 |
|
Smarca4 |
|
20283 |
0 |
0 |
0 |
975 |
|
-0.14 |
n.v. |
n.v. |
n.v. |
-0.6 |
|
transcription activator BRG1 isoform 2 |
| 40254124 |
|
Smarca5 |
|
53508 |
722 |
0 |
0 |
0 |
|
-0.01 |
-0.27 |
n.v. |
n.v. |
n.v. |
|
SWI/SNF-related matrix-associated actin-dependent
regulator of chromatin subfamily A member 5 |
| 358438428 |
|
Smarcad1 |
|
0 |
0 |
0 |
499 |
161 |
|
n.v. |
n.v. |
n.v. |
0 |
0.61 |
|
SWI/SNF-related matrix-associated actin-dependent
regulator of chromatin subfamily A containing
DEAD/H box 1 isoform |
| 62543565 |
|
Smarcad1 |
|
0 |
0 |
0 |
499 |
418 |
|
n.v. |
n.v. |
n.v. |
0 |
0.67 |
|
SWI/SNF-related matrix-associated actin-dependent
regulator of chromatin subfamily A containing
DEAD/H box 1 isoform |
| 229577278 |
|
Smarcal1 |
|
0 |
0 |
10 |
41 |
0 |
|
n.v. |
n.v. |
0.12 |
0.5 |
n.v. |
|
SWI/SNF-related matrix-associated actin-dependent
regulator of chromatin subfamily A-like protein 1 |
| 112421097 |
|
Smarcc1 |
|
37857 |
0 |
0 |
0 |
803 |
|
0.07 |
n.v. |
n.v. |
0 |
0.03 |
|
SWI/SNF complex subunit SMARCC1 |
| 166235123 |
|
Smarcc2 |
|
26965 |
0 |
0 |
0 |
0 |
|
0.07 |
n.v. |
n.v. |
n.v. |
n.v. |
|
SWI/SNF complex subunit SMARCC2 isoform 2 |
| 166235125 |
|
Smarcc2 |
|
26965 |
0 |
0 |
0 |
0 |
|
0.07 |
n.v. |
n.v. |
n.v. |
n.v. |
|
SWI/SNF complex subunit SMARCC2 isoform 1 |
| 37718972 |
|
Smarcc2 |
|
26965 |
0 |
0 |
0 |
0 |
|
0.07 |
n.v. |
n.v. |
n.v. |
n.v. |
|
SWI/SNF complex subunit SMARCC2 isoform 3 |
| 125347396 |
|
Smarcd1 |
|
1172 |
0 |
0 |
0 |
0 |
|
-0.31 |
n.v. |
n.v. |
n.v. |
n.v. |
|
SWI/SNF-related matrix-associated actin-dependent
regulator of chromatin subfamily D member 1 |
| 194328771 |
|
Smarcd2 |
|
1172 |
0 |
16 |
0 |
0 |
|
-0.31 |
n.v. |
-0.25 |
n.v. |
n.v. |
|
SWI/SNF-related matrix-associated actin-dependent
regulator of chromatin subfamily D member 2
isoform 2 |
| 194328773 |
|
Smarcd2 |
|
1172 |
0 |
16 |
0 |
0 |
|
-0.31 |
n.v. |
-0.25 |
n.v. |
n.v. |
|
SWI/SNF-related matrix-associated actin-dependent
regulator of chromatin subfamily D member 2
isoform 1 |
| 77404373 |
|
Smarcd3 |
|
1172 |
0 |
0 |
0 |
0 |
|
-0.31 |
n.v. |
n.v. |
n.v. |
n.v. |
|
SWI/SNF-related matrix-associated actin-dependent
regulator of chromatin subfamily D member 3 |
| 10181166 |
|
Smarce1 |
|
15249 |
455 |
0 |
164 |
0 |
|
0.05 |
-5.78 |
n.v. |
0.44 |
n.v. |
|
SWI/SNF-related matrix-associated actin-dependent
regulator of chromatin subfamily E member 1 |
| 258613892 |
|
Smc1a |
|
30663 |
46 |
3045 |
1473 |
0 |
|
-0.16 |
-0.8 |
-0.04 |
-0.2 |
n.v. |
|
structural maintenance of chromosomes protein 1A |
| 62990166 |
|
Smc2 |
|
0 |
4689 |
27553 |
40551 |
14479 |
|
n.v. |
0.02 |
-0.04 |
0.06 |
-0.07 |
|
structural maintenance of chromosomes protein 2 |
| 36031035 |
|
Smc3 |
|
63449 |
5597 |
9747 |
5452 |
4112 |
|
-0.05 |
-0.08 |
-0.03 |
-0.17 |
-0.15 |
|
structural maintenance of chromosomes protein 3 |
| 29789347 |
|
Smc4 |
|
0 |
0 |
24344 |
24925 |
25564 |
|
n.v. |
n.v. |
-0.01 |
0.06 |
-0.17 |
|
structural maintenance of chromosomes protein 4 |
| 148839318 |
|
Smchd1 |
|
10892 |
292 |
23 |
3070 |
0 |
|
0.16 |
0.17 |
-0.24 |
0.04 |
n.v. |
|
structural maintenance of chromosomes flexible hinge
domain-containing protein 1 |
| 281427239 |
|
Smco1 |
|
0 |
0 |
0 |
2333 |
0 |
|
n.v. |
n.v. |
n.v. |
-0.51 |
n.v. |
|
uncharacterized protein C3orf43 homolog |
| 58037137 |
|
Smdt1 |
|
0 |
461 |
0 |
0 |
0 |
|
n.v. |
-0.05 |
n.v. |
n.v. |
n.v. |
|
UPF0466 protein C22orf32 homolog, mitochondrial precursor |
| 237649040 |
|
Smek1 |
|
0 |
0 |
1071 |
17845 |
21901 |
|
n.v. |
n.v. |
-0.4 |
0.15 |
-0.06 |
|
serine/threonine-protein phosphatase 4 regulatory subunit
3A isoform 2 |
| 46849745 |
|
Smek1 |
|
0 |
0 |
1071 |
17845 |
21901 |
|
n.v. |
n.v. |
-0.4 |
0.15 |
-0.06 |
|
serine/threonine-protein phosphatase 4 regulatory subunit
3A isoform 1 |
| 262231766 |
|
Smek2 |
|
0 |
0 |
0 |
4600 |
13633 |
|
n.v. |
n.v. |
n.v. |
0.15 |
0.05 |
|
serine/threonine-protein phosphatase 4 regulatory subunit
3B |
| 73532758 |
|
Smg1 |
|
0 |
13 |
294 |
24237 |
0 |
|
n.v. |
0.84 |
-0.02 |
-0.09 |
n.v. |
|
serine/threonine-protein kinase SMG1 |
| 112807193 |
|
Smg5 |
|
0 |
0 |
10 |
0 |
0 |
|
n.v. |
n.v. |
0.23 |
n.v. |
n.v. |
|
protein SMG5 |
| 50582545 |
|
Smg6 |
|
0 |
0 |
12 |
0 |
0 |
|
n.v. |
n.v. |
2.24 |
n.v. |
n.v. |
|
telomerase-binding protein EST1A |
| 23956216 |
|
Smg8 |
|
0 |
0 |
838 |
0 |
0 |
|
n.v. |
n.v. |
0.09 |
n.v. |
n.v. |
|
protein SMG8 |
| 21312548 |
|
Smg9 |
|
0 |
0 |
136 |
999 |
0 |
|
n.v. |
n.v. |
0.22 |
0.24 |
n.v. |
|
protein SMG9 |
| 254910949 |
|
Smim1 |
|
0 |
8 |
142 |
262 |
0 |
|
n.v. |
-0.07 |
-0.2 |
-0.55 |
n.v. |
|
uncharacterized protein LOC388588 homolog |
| 13384892 |
|
Smim12 |
|
0 |
0 |
3 |
0 |
0 |
|
n.v. |
n.v. |
-0.87 |
n.v. |
n.v. |
|
small integral membrane protein 12 |
| 224177530 |
|
Smim20 |
|
787 |
180 |
10 |
0 |
0 |
|
-0.05 |
0.05 |
-0.47 |
n.v. |
n.v. |
|
uncharacterized protein LOC66278 |
| 359374252 |
|
Smim22 |
|
0 |
0 |
100 |
1703 |
0 |
|
n.v. |
n.v. |
-0.48 |
-0.63 |
n.v. |
|
uncharacterized protein LOC432995 isoform 2 |
| 359374254 |
|
Smim22 |
|
0 |
0 |
100 |
1703 |
0 |
|
n.v. |
n.v. |
-0.48 |
-0.63 |
n.v. |
|
uncharacterized protein LOC432995 isoform 1 |
| 27369485 |
|
Smim7 |
|
73 |
198 |
117 |
106 |
0 |
|
0.27 |
-0.04 |
-0.22 |
0.07 |
n.v. |
|
small integral membrane protein 7 precursor |
| 6755580 |
|
Smn1 |
|
0 |
104 |
37 |
1940 |
0 |
|
n.v. |
0.28 |
0.29 |
0.2 |
n.v. |
|
survival motor neuron protein isoform 1 |
| 27369569 |
|
Smndc1 |
|
0 |
0 |
139 |
524 |
0 |
|
n.v. |
n.v. |
0.24 |
-0.5 |
n.v. |
|
survival of motor neuron-related-splicing factor 30 |
| 6678031 |
|
Smpd2 |
|
110 |
0 |
481 |
0 |
0 |
|
0.58 |
n.v. |
-0.39 |
n.v. |
n.v. |
|
sphingomyelin phosphodiesterase 2 |
| 257196240 |
|
Smpd4 |
|
1446 |
808 |
476 |
0 |
0 |
|
0.16 |
-0.49 |
-0.14 |
n.v. |
n.v. |
|
sphingomyelin phosphodiesterase 4 isoform 1 |
| 257196243 |
|
Smpd4 |
|
1446 |
808 |
476 |
0 |
0 |
|
0.16 |
-0.49 |
-0.14 |
n.v. |
n.v. |
|
sphingomyelin phosphodiesterase 4 isoform 4 |
| 257196245 |
|
Smpd4 |
|
1446 |
808 |
476 |
0 |
0 |
|
0.16 |
-0.49 |
-0.14 |
n.v. |
n.v. |
|
sphingomyelin phosphodiesterase 4 isoform 3 |
| 257196247 |
|
Smpd4 |
|
1446 |
808 |
476 |
0 |
0 |
|
0.16 |
-0.49 |
-0.14 |
n.v. |
n.v. |
|
sphingomyelin phosphodiesterase 4 isoform 2 |
| 19527104 |
|
Smpdl3b |
|
0 |
0 |
606 |
0 |
0 |
|
n.v. |
n.v. |
-0.45 |
n.v. |
n.v. |
|
acid sphingomyelinase-like phosphodiesterase 3b
precursor |
| 226529455 |
|
Smtn |
|
0 |
0 |
0 |
8 |
0 |
|
n.v. |
n.v. |
n.v. |
0.46 |
n.v. |
|
smoothelin |
| 227430367 |
|
Smu1 |
|
2178 |
0 |
751 |
0 |
0 |
|
-0.09 |
n.v. |
-0.01 |
n.v. |
n.v. |
|
WD40 repeat-containing protein SMU1 |
| 40254179 |
|
Smug1 |
|
0 |
0 |
0 |
0 |
439 |
|
n.v. |
n.v. |
n.v. |
n.v. |
0.53 |
|
single-strand selective monofunctional uracil DNA
glycosylase |
| 254939680 |
|
Smurf2 |
|
0 |
0 |
82 |
0 |
0 |
|
n.v. |
n.v. |
0.19 |
n.v. |
n.v. |
|
E3 ubiquitin-protein ligase SMURF2 |
| 21312378 |
|
Smyd3 |
|
0 |
207 |
18 |
0 |
1863 |
|
n.v. |
-0.04 |
-0.51 |
n.v. |
0 |
|
SET and MYND domain-containing protein 3 |
| 154689581 |
|
Smyd5 |
|
0 |
0 |
217 |
0 |
13098 |
|
n.v. |
n.v. |
-0.26 |
n.v. |
-0.02 |
|
SET and MYND domain-containing protein 5 |
| 295317330;6678049 |
|
Snap23 |
|
0 |
0 |
9977 |
0 |
0 |
|
n.v. |
n.v. |
-0.08 |
n.v. |
n.v. |
|
synaptosomal-associated protein 23 isoform b |
| 6678049 |
|
Snap23 |
|
55 |
3215 |
0 |
115 |
0 |
|
0.76 |
0.11 |
n.v. |
1.13 |
n.v. |
|
synaptosomal-associated protein 23 isoform b |
| 295317325 |
|
Snap23 |
|
55 |
3215 |
9977 |
115 |
0 |
|
0.76 |
0.11 |
-0.08 |
1.13 |
n.v. |
|
synaptosomal-associated protein 23 isoform a |
| 6755588 |
|
Snap25 |
|
0 |
278 |
3162 |
0 |
0 |
|
n.v. |
0.03 |
-0.08 |
n.v. |
n.v. |
|
synaptosomal-associated protein 25 |
| 139948568 |
|
Snap29 |
|
0 |
90 |
171 |
270 |
7871 |
|
n.v. |
0.65 |
0.39 |
0.1 |
0.33 |
|
synaptosomal-associated protein 29 |
| 21362303 |
|
Snap47 |
|
0 |
551 |
0 |
0 |
3299 |
|
n.v. |
-0.81 |
n.v. |
n.v. |
0.36 |
|
synaptosomal-associated protein 47 |
| 7305507 |
|
Snap91 |
|
0 |
221 |
375 |
0 |
64 |
|
n.v. |
0.6 |
0.07 |
n.v. |
-0.67 |
|
clathrin coat assembly protein AP180 |
| 19923056 |
|
Snapin |
|
0 |
858 |
345 |
5885 |
2806 |
|
n.v. |
0 |
-0.05 |
0.09 |
0.15 |
|
SNARE-associated protein Snapin |
| 77404392 |
|
Snd1 |
|
96729 |
13744 |
155855 |
102950 |
525 |
|
0.08 |
0.06 |
-0.07 |
-0.1 |
-0.06 |
|
staphylococcal nuclease domain-containing protein 1 |
| 15809002 |
|
Snf8 |
|
0 |
1154 |
1194 |
237 |
21398 |
|
n.v. |
-0.12 |
0.02 |
0.99 |
0.16 |
|
vacuolar-sorting protein SNF8 |
| 40018610 |
|
Snrnp200 |
|
132060 |
8062 |
16053 |
58854 |
289 |
|
-0.16 |
-0.05 |
-0.03 |
0.01 |
-0.63 |
|
U5 small nuclear ribonucleoprotein 200 kDa helicase |
| 27228990 |
|
Snrnp27 |
|
0 |
0 |
19 |
0 |
0 |
|
n.v. |
n.v. |
-0.26 |
n.v. |
n.v. |
|
U4/U6.U5 small nuclear ribonucleoprotein 27 kDa
protein |
| 115298670 |
|
Snrnp40 |
|
18599 |
0 |
831 |
29132 |
0 |
|
0.14 |
n.v. |
0.28 |
0.3 |
n.v. |
|
U5 small nuclear ribonucleoprotein 40 kDa protein |
| 67846113 |
|
Snrnp70 |
|
11569 |
0 |
679 |
13072 |
0 |
|
-0.1 |
n.v. |
-0.03 |
0.15 |
n.v. |
|
U1 small nuclear ribonucleoprotein 70 kDa |
| 114052106 |
|
Snrpa |
|
18178 |
0 |
4902 |
13490 |
7282 |
|
-0.09 |
n.v. |
-0.07 |
0.29 |
-0.16 |
|
U1 small nuclear ribonucleoprotein A |
| 228480232 |
|
Snrpa1 |
|
57957 |
3424 |
3041 |
24917 |
5837 |
|
0 |
0.16 |
-0.03 |
0.03 |
-0.06 |
|
U2 small nuclear ribonucleoprotein A' |
| 6678053 |
|
Snrpb |
|
66890 |
3941 |
3974 |
38603 |
5087 |
|
-0.01 |
-0.04 |
0.01 |
0 |
-0.22 |
|
small nuclear ribonucleoprotein-associated protein B |
| 23956110 |
|
Snrpb2 |
|
6187 |
0 |
215 |
5157 |
0 |
|
-0.18 |
n.v. |
0.21 |
0.21 |
n.v. |
|
U2 small nuclear ribonucleoprotein B'' |
| 6755596 |
|
Snrpc |
|
55 |
15 |
7 |
0 |
439 |
|
0.18 |
-1.41 |
0.27 |
n.v. |
0.02 |
|
U1 small nuclear ribonucleoprotein C |
| 6678055 |
|
Snrpd1 |
|
109177 |
6945 |
3156 |
39544 |
900 |
|
0.06 |
0.09 |
-0.01 |
-0.01 |
0.25 |
|
small nuclear ribonucleoprotein Sm D1 |
| 58037145 |
|
Snrpd2 |
|
80162 |
1952 |
10656 |
45937 |
6415 |
|
-0.03 |
0.04 |
0.01 |
-0.09 |
-0.11 |
|
small nuclear ribonucleoprotein Sm D2 |
| 13385598 |
|
Snrpd3 |
|
164534 |
4970 |
16060 |
123749 |
13194 |
|
-0.01 |
0.08 |
-0.18 |
-0.04 |
0.13 |
|
small nuclear ribonucleoprotein Sm D3 |
| 27883844 |
|
Snrpe |
|
31889 |
3263 |
3142 |
1302 |
1906 |
|
-0.07 |
0.06 |
-0.06 |
-0.07 |
-0.14 |
|
small nuclear ribonucleoprotein E |
| 254028189 |
|
Snrpf |
|
43733 |
426 |
2436 |
15913 |
439 |
|
-0.02 |
0.11 |
-0.06 |
-0.08 |
-0.23 |
|
small nuclear ribonucleoprotein F |
| 13385994 |
|
Snrpg |
|
1977 |
585 |
1779 |
876 |
75 |
|
0.11 |
0.23 |
-0.05 |
0.31 |
-0.08 |
|
small nuclear ribonucleoprotein G |
| 7305509 |
|
Snrpn |
|
66890 |
3941 |
3974 |
38603 |
5087 |
|
-0.01 |
-0.04 |
0.01 |
0 |
-0.22 |
|
small nuclear ribonucleoprotein-associated protein N |
| 160333722 |
|
Snta1 |
|
0 |
0 |
1743 |
0 |
0 |
|
n.v. |
n.v. |
-0.2 |
n.v. |
n.v. |
|
alpha-1-syntrophin |
| 6678059 |
|
Sntb2 |
|
0 |
1762 |
2239 |
0 |
0 |
|
n.v. |
0.2 |
0.08 |
n.v. |
n.v. |
|
beta-2-syntrophin |
| 146149191 |
|
Snw1 |
|
860 |
188 |
1954 |
0 |
4648 |
|
0.3 |
0.82 |
0.02 |
n.v. |
-0.15 |
|
SNW domain-containing protein 1 |
| 71043944 |
|
Snx1 |
|
13858 |
17761 |
23257 |
78352 |
27127 |
|
0.04 |
0.02 |
-0.03 |
-0.08 |
0.19 |
|
sorting nexin-1 |
| 160333829 |
|
Snx12 |
|
8622 |
5129 |
8041 |
28879 |
8600 |
|
-0.52 |
0.08 |
-0.02 |
-0.11 |
0.14 |
|
sorting nexin-12 isoform 3 |
| 160333832 |
|
Snx12 |
|
8622 |
5129 |
8041 |
28879 |
8600 |
|
-0.52 |
0.08 |
-0.02 |
-0.11 |
0.14 |
|
sorting nexin-12 isoform 1 |
| 160333835 |
|
Snx12 |
|
8622 |
5129 |
8041 |
28879 |
8600 |
|
-0.52 |
0.08 |
-0.02 |
-0.11 |
0.14 |
|
sorting nexin-12 isoform 2 |
| 238814328 |
|
Snx14 |
|
0 |
33 |
120 |
0 |
0 |
|
n.v. |
-0.65 |
-0.52 |
n.v. |
n.v. |
|
sorting nexin-14 |
| 24211031 |
|
Snx17 |
|
0 |
296 |
0 |
0 |
0 |
|
n.v. |
0.69 |
n.v. |
n.v. |
n.v. |
|
sorting nexin-17 |
| 91598596 |
|
Snx18 |
|
0 |
134 |
0 |
810 |
0 |
|
n.v. |
0.22 |
n.v. |
0.08 |
n.v. |
|
sorting nexin-18 |
| 13385878 |
|
Snx2 |
|
0 |
23340 |
27232 |
114622 |
19266 |
|
n.v. |
0.08 |
0.02 |
0.07 |
0.2 |
|
sorting nexin-2 |
| 110625874 |
|
Snx21 |
|
0 |
0 |
0 |
196 |
0 |
|
n.v. |
n.v. |
n.v. |
-0.7 |
n.v. |
|
sorting nexin-21 |
| 21313014 |
|
Snx24 |
|
0 |
0 |
10 |
156 |
0 |
|
n.v. |
n.v. |
0.31 |
0.37 |
n.v. |
|
sorting nexin-24 |
| 126722910 |
|
Snx27 |
|
0 |
791 |
5531 |
0 |
0 |
|
n.v. |
-0.08 |
0.05 |
n.v. |
n.v. |
|
sorting nexin-27 isoform 2 |
| 126723792 |
|
Snx27 |
|
0 |
791 |
5531 |
0 |
0 |
|
n.v. |
-0.08 |
0.05 |
n.v. |
n.v. |
|
sorting nexin-27 isoform 1 |
| 343790938 |
|
Snx29 |
|
0 |
0 |
0 |
0 |
3716 |
|
n.v. |
n.v. |
n.v. |
n.v. |
-0.16 |
|
sorting nexin-29 |
| 31560433 |
|
Snx3 |
|
20375 |
9644 |
15974 |
41607 |
19995 |
|
-0.03 |
0.17 |
0 |
-0.09 |
0.3 |
|
sorting nexin-3 |
| 66792896 |
|
Snx32 |
|
0 |
0 |
0 |
2718 |
0 |
|
n.v. |
n.v. |
n.v. |
0.13 |
n.v. |
|
sorting nexin-32 |
| 18017596 |
|
Snx4 |
|
0 |
2200 |
2928 |
18205 |
739 |
|
n.v. |
0.13 |
0 |
0.03 |
-0.03 |
|
sorting nexin-4 |
| 18034769 |
|
Snx5 |
|
0 |
4964 |
8885 |
7932 |
42817 |
|
n.v. |
0.01 |
-0.12 |
-0.18 |
-0.04 |
|
sorting nexin-5 |
| 27754031 |
|
Snx6 |
|
0 |
4375 |
6588 |
47468 |
34656 |
|
n.v. |
0.2 |
0.02 |
0.05 |
0.14 |
|
sorting nexin-6 |
| 297747313 |
|
Snx7 |
|
0 |
0 |
558 |
2325 |
0 |
|
n.v. |
n.v. |
0.2 |
0.07 |
n.v. |
|
sorting nexin-7 isoform 2 |
| 297747317 |
|
Snx7 |
|
0 |
0 |
806 |
2325 |
0 |
|
n.v. |
n.v. |
0.19 |
0.07 |
n.v. |
|
sorting nexin-7 isoform 1 |
| 26986581 |
|
Snx8 |
|
0 |
670 |
534 |
0 |
0 |
|
n.v. |
0.05 |
-0.25 |
n.v. |
n.v. |
|
sorting nexin-8 |
| 29568084 |
|
Snx9 |
|
0 |
453 |
2691 |
12581 |
2078 |
|
n.v. |
0.17 |
0.1 |
-0.07 |
-0.17 |
|
sorting nexin-9 |
| 84619697 |
|
Soat1 |
|
2783 |
1839 |
222 |
0 |
0 |
|
-0.11 |
-0.09 |
-0.21 |
n.v. |
n.v. |
|
sterol O-acyltransferase 1 |
| 45597447 |
|
Sod1 |
|
167225 |
5532 |
56524 |
28167 |
57050 |
|
0.13 |
-0.03 |
-0.08 |
-0.04 |
0.07 |
|
superoxide dismutase [Cu-Zn] |
| 31980762 |
|
Sod2 |
|
65755 |
19921 |
2381 |
0 |
5076 |
|
0.04 |
-0.11 |
-0.45 |
n.v. |
-0.22 |
|
superoxide dismutase [Mn], mitochondrial precursor |
| 124358955 |
|
Son |
|
0 |
1100 |
357 |
0 |
0 |
|
n.v. |
0.02 |
-0.04 |
n.v. |
n.v. |
|
protein SON |
| 124378037 |
|
Son |
|
0 |
1100 |
357 |
0 |
0 |
|
n.v. |
0.02 |
-0.04 |
n.v. |
n.v. |
|
protein SON truncated isoform |
| 78000154 |
|
Sorbs1 |
|
0 |
0 |
133 |
0 |
21 |
|
n.v. |
n.v. |
0.01 |
n.v. |
-0.92 |
|
sorbin and SH3 domain-containing protein 1 isoform 5 |
| 78000173 |
|
Sorbs1 |
|
0 |
0 |
133 |
0 |
21 |
|
n.v. |
n.v. |
0.01 |
n.v. |
-0.92 |
|
sorbin and SH3 domain-containing protein 1 isoform 2 |
| 78000175 |
|
Sorbs1 |
|
0 |
0 |
133 |
0 |
21 |
|
n.v. |
n.v. |
0.01 |
n.v. |
-0.92 |
|
sorbin and SH3 domain-containing protein 1 isoform 1 |
| 78000177 |
|
Sorbs1 |
|
0 |
0 |
133 |
0 |
21 |
|
n.v. |
n.v. |
0.01 |
n.v. |
-0.92 |
|
sorbin and SH3 domain-containing protein 1 isoform 4 |
| 78000179 |
|
Sorbs1 |
|
0 |
0 |
133 |
0 |
21 |
|
n.v. |
n.v. |
0.01 |
n.v. |
-0.92 |
|
sorbin and SH3 domain-containing protein 1 isoform 3 |
| 327315368 |
|
Sorbs2 |
|
0 |
309 |
50 |
0 |
0 |
|
n.v. |
0.06 |
0.65 |
n.v. |
n.v. |
|
sorbin and SH3 domain-containing protein 2 isoform 1 |
| 327315370 |
|
Sorbs2 |
|
0 |
309 |
50 |
0 |
0 |
|
n.v. |
0.06 |
0.65 |
n.v. |
n.v. |
|
sorbin and SH3 domain-containing protein 2 isoform 2 |
| 406719571 |
|
Sorbs3 |
|
732 |
0 |
92 |
1154 |
16718 |
|
0.5 |
n.v. |
0.12 |
0.24 |
-0.36 |
|
vinexin isoform b |
| 406719575 |
|
Sorbs3 |
|
732 |
0 |
92 |
1154 |
16718 |
|
0.5 |
n.v. |
0.12 |
0.24 |
-0.36 |
|
vinexin isoform c |
| 6755504 |
|
Sorbs3 |
|
732 |
0 |
92 |
1154 |
16718 |
|
0.5 |
n.v. |
0.12 |
0.24 |
-0.36 |
|
vinexin isoform a |
| 22128627 |
|
Sord |
|
0 |
0 |
157 |
4273 |
20841 |
|
n.v. |
n.v. |
0.2 |
0.4 |
0.15 |
|
sorbitol dehydrogenase |
| 110625645 |
|
Sorl1 |
|
0 |
2113 |
9772 |
254 |
11 |
|
n.v. |
-0.05 |
-0.06 |
0.23 |
1.57 |
|
sortilin-related receptor precursor |
| 34610211 |
|
Sort1 |
|
0 |
0 |
2485 |
0 |
0 |
|
n.v. |
n.v. |
0.12 |
n.v. |
n.v. |
|
sortilin isoform 2 precursor |
| 409264681 |
|
Sort1 |
|
0 |
0 |
2485 |
0 |
0 |
|
n.v. |
n.v. |
0.12 |
n.v. |
n.v. |
|
sortilin isoform 1 |
| 117414170 |
|
Sos1 |
|
0 |
0 |
0 |
0 |
1007 |
|
n.v. |
n.v. |
n.v. |
n.v. |
0.54 |
|
son of sevenless homolog 1 |
| 30424924 |
|
Sowahb |
|
0 |
0 |
0 |
0 |
86 |
|
n.v. |
n.v. |
n.v. |
n.v. |
0.06 |
|
ankyrin repeat domain-containing protein SOWAHB |
| 187173282 |
|
Sowahc |
|
0 |
0 |
0 |
213 |
0 |
|
n.v. |
n.v. |
n.v. |
-0.2 |
n.v. |
|
ankyrin repeat domain-containing protein SOWAHC |
| 119226255 |
|
Sp1 |
|
0 |
0 |
0 |
0 |
386 |
|
n.v. |
n.v. |
n.v. |
n.v. |
0.49 |
|
transcription factor Sp1 |
| 148747279 |
|
Spag1 |
|
0 |
0 |
18 |
0 |
0 |
|
n.v. |
n.v. |
0.23 |
n.v. |
n.v. |
|
sperm-associated antigen 1 |
| 162287182 |
|
Spag17 |
|
0 |
0 |
541 |
0 |
0 |
|
n.v. |
n.v. |
-0.01 |
n.v. |
n.v. |
|
sperm-associated antigen 17 |
| 264681516 |
|
Spag7 |
|
0 |
0 |
0 |
0 |
23839 |
|
n.v. |
n.v. |
n.v. |
n.v. |
0.09 |
|
sperm-associated antigen 7 isoform 1 |
| 264681518 |
|
Spag7 |
|
0 |
0 |
0 |
0 |
12787 |
|
n.v. |
n.v. |
n.v. |
n.v. |
0.06 |
|
sperm-associated antigen 7 isoform 2 |
| 312836821 |
|
Spag9 |
|
0 |
0 |
233 |
0 |
23689 |
|
n.v. |
n.v. |
0.16 |
n.v. |
0.2 |
|
C-Jun-amino-terminal kinase-interacting protein 4 isoform
5 |
| 312836823 |
|
Spag9 |
|
0 |
0 |
233 |
0 |
23689 |
|
n.v. |
n.v. |
0.16 |
n.v. |
0.2 |
|
C-Jun-amino-terminal kinase-interacting protein 4 isoform
6 |
| 312836825 |
|
Spag9 |
|
0 |
0 |
233 |
0 |
18784 |
|
n.v. |
n.v. |
0.16 |
n.v. |
0.18 |
|
C-Jun-amino-terminal kinase-interacting protein 4 isoform
7 |
| 70887772 |
|
Spag9 |
|
0 |
0 |
233 |
0 |
23689 |
|
n.v. |
n.v. |
0.16 |
n.v. |
0.2 |
|
C-Jun-amino-terminal kinase-interacting protein 4 isoform
1 |
| 70887776 |
|
Spag9 |
|
0 |
0 |
233 |
0 |
18784 |
|
n.v. |
n.v. |
0.16 |
n.v. |
0.18 |
|
C-Jun-amino-terminal kinase-interacting protein 4 isoform
3 |
| 70887778 |
|
Spag9 |
|
0 |
0 |
233 |
0 |
18784 |
|
n.v. |
n.v. |
0.16 |
n.v. |
0.18 |
|
C-Jun-amino-terminal kinase-interacting protein 4 isoform
2 |
| 70887784 |
|
Spag9 |
|
0 |
0 |
233 |
0 |
18784 |
|
n.v. |
n.v. |
0.16 |
n.v. |
0.18 |
|
C-Jun-amino-terminal kinase-interacting protein 4 isoform
4 |
| 244790106 |
|
Spast |
|
0 |
0 |
31 |
0 |
493 |
|
n.v. |
n.v. |
0.63 |
n.v. |
-0.09 |
|
spastin isoform 1 |
| 244790112 |
|
Spast |
|
0 |
0 |
31 |
0 |
493 |
|
n.v. |
n.v. |
0.63 |
n.v. |
-0.09 |
|
spastin isoform 2 |
| 242247225 |
|
Spata13 |
|
0 |
0 |
38 |
106 |
0 |
|
n.v. |
n.v. |
-0.2 |
0.46 |
n.v. |
|
spermatogenesis-associated protein 13 |
| 254553468 |
|
Spata5 |
|
0 |
0 |
9452 |
17599 |
12477 |
|
n.v. |
n.v. |
0.14 |
0.12 |
0.1 |
|
spermatogenesis-associated protein 5 isoform 2 |
| 254553470 |
|
Spata5 |
|
0 |
0 |
9452 |
17599 |
12477 |
|
n.v. |
n.v. |
0.14 |
0.12 |
0.1 |
|
spermatogenesis-associated protein 5 isoform 1 |
| 20982833 |
|
Spats2 |
|
0 |
0 |
818 |
0 |
0 |
|
n.v. |
n.v. |
0.25 |
n.v. |
n.v. |
|
spermatogenesis-associated serine-rich protein 2 |
| 21312862 |
|
Spc24 |
|
0 |
0 |
3 |
0 |
589 |
|
n.v. |
n.v. |
0.47 |
n.v. |
0.15 |
|
kinetochore protein Spc24 |
| 312283739;312283741 |
|
Spc25 |
|
0 |
0 |
4 |
0 |
0 |
|
n.v. |
n.v. |
0.04 |
n.v. |
n.v. |
|
kinetochore protein Spc25 isoform 1 |
| 312283741 |
|
Spc25 |
|
0 |
0 |
0 |
0 |
171 |
|
n.v. |
n.v. |
n.v. |
n.v. |
-0.06 |
|
kinetochore protein Spc25 isoform 1 |
| 21313454 |
|
Spc25 |
|
0 |
0 |
4 |
0 |
171 |
|
n.v. |
n.v. |
0.04 |
n.v. |
-0.06 |
|
kinetochore protein Spc25 |
| 193788663 |
|
Spcs1 |
|
146 |
637 |
0 |
0 |
0 |
|
0.17 |
-0.4 |
n.v. |
n.v. |
n.v. |
|
signal peptidase complex subunit 1 |
| 13385134 |
|
Spcs2 |
|
3094 |
1900 |
2315 |
0 |
0 |
|
-0.01 |
-0.5 |
-0.41 |
n.v. |
n.v. |
|
signal peptidase complex subunit 2 |
| 125988403 |
|
Spcs3 |
|
22260 |
6720 |
3292 |
663 |
0 |
|
-0.23 |
-0.33 |
-0.41 |
-0.29 |
n.v. |
|
signal peptidase complex subunit 3 |
| 71979930 |
|
Specc1 |
|
0 |
0 |
530 |
0 |
0 |
|
n.v. |
n.v. |
0.09 |
n.v. |
n.v. |
|
cytospin-B |
| 125991758 |
|
Spef2 |
|
0 |
0 |
0 |
0 |
1724 |
|
n.v. |
n.v. |
n.v. |
n.v. |
-0.04 |
|
sperm flagellar protein 2 |
| 120587001 |
|
Spen |
|
0 |
0 |
0 |
0 |
278 |
|
n.v. |
n.v. |
n.v. |
n.v. |
-0.05 |
|
msx2-interacting protein |
| 222418579;21450269 |
|
Spg20 |
|
0 |
184 |
203 |
3233 |
0 |
|
n.v. |
0.59 |
0.01 |
0.27 |
n.v. |
|
spartin isoform a |
| 222418581 |
|
Spg20 |
|
0 |
184 |
203 |
3233 |
0 |
|
n.v. |
0.59 |
0.01 |
0.27 |
n.v. |
|
spartin isoform b |
| 20070390 |
|
Spg21 |
|
0 |
2150 |
789 |
286 |
3823 |
|
n.v. |
-0.5 |
0.08 |
-0.12 |
-0.23 |
|
maspardin |
| 148539988 |
|
Spg7 |
|
0 |
413 |
287 |
0 |
0 |
|
n.v. |
-0.3 |
0.19 |
n.v. |
n.v. |
|
paraplegin |
| 22094105 |
|
Sphk1 |
|
0 |
0 |
89 |
0 |
0 |
|
n.v. |
n.v. |
0.29 |
n.v. |
n.v. |
|
sphingosine kinase 1 isoform 1 |
| 27532969;289191342 |
|
Sphk1 |
|
0 |
0 |
89 |
0 |
0 |
|
n.v. |
n.v. |
0.29 |
n.v. |
n.v. |
|
sphingosine kinase 1 isoform 2 |
| 289191346 |
|
Sphk1 |
|
0 |
0 |
89 |
0 |
0 |
|
n.v. |
n.v. |
0.29 |
n.v. |
n.v. |
|
sphingosine kinase 1 isoform 3 |
| 289191399 |
|
Sphk2 |
|
0 |
2071 |
566 |
2939 |
0 |
|
n.v. |
0.23 |
-0.02 |
0.14 |
n.v. |
|
sphingosine kinase 2 |
| 257196267 |
|
Spice1 |
|
0 |
0 |
41 |
0 |
0 |
|
n.v. |
n.v. |
1 |
n.v. |
n.v. |
|
spindle and centriole-associated protein 1 |
| 34328234 |
|
Spint1 |
|
0 |
432 |
316 |
0 |
0 |
|
n.v. |
0.01 |
-0.17 |
n.v. |
n.v. |
|
kunitz-type protease inhibitor 1 precursor |
| 127139427 |
|
Spint2 |
|
0 |
459 |
28 |
0 |
0 |
|
n.v. |
-0.18 |
-0.32 |
n.v. |
n.v. |
|
kunitz-type protease inhibitor 2 isoform b precursor |
| 33563278 |
|
Spint2 |
|
0 |
459 |
28 |
0 |
0 |
|
n.v. |
-0.18 |
-0.32 |
n.v. |
n.v. |
|
kunitz-type protease inhibitor 2 isoform a precursor |
| 258645125 |
|
Sppl2a |
|
0 |
0 |
868 |
0 |
0 |
|
n.v. |
n.v. |
-0.29 |
n.v. |
n.v. |
|
signal peptide peptidase-like 2A precursor |
| 160333789 |
|
Spr |
|
0 |
3286 |
2792 |
3503 |
101044 |
|
n.v. |
0.06 |
0.06 |
0.05 |
0.1 |
|
sepiapterin reductase |
| 6678115 |
|
Sprr1a |
|
0 |
136 |
0 |
0 |
5076 |
|
n.v. |
0.16 |
n.v. |
n.v. |
-0.01 |
|
cornifin-A |
| 58037095 |
|
Spryd4 |
|
0 |
1052 |
0 |
0 |
0 |
|
n.v. |
-0.19 |
n.v. |
n.v. |
n.v. |
|
SPRY domain-containing protein 4 |
| 27228993 |
|
Spryd7 |
|
0 |
1958 |
1700 |
0 |
0 |
|
n.v. |
-0.28 |
-0.07 |
n.v. |
n.v. |
|
SPRY domain-containing protein 7 |
| 19526481 |
|
Spta1 |
|
0 |
931 |
1598 |
0 |
10335 |
|
n.v. |
0.16 |
0.11 |
n.v. |
-0.35 |
|
spectrin alpha chain, erythrocytic 1 |
| 115496850 |
|
Sptan1 |
|
397552 |
31926 |
87468 |
259941 |
488653 |
|
0.08 |
0.14 |
0.1 |
-0.12 |
-0.31 |
|
spectrin alpha chain, non-erythrocytic 1 isoform 1 |
| 295054266 |
|
Sptan1 |
|
402549 |
31926 |
87468 |
261864 |
488653 |
|
0.08 |
0.14 |
0.1 |
-0.1 |
-0.31 |
|
spectrin alpha chain, non-erythrocytic 1 isoform 2 |
| 295054271 |
|
Sptan1 |
|
397552 |
31926 |
87468 |
259941 |
488653 |
|
0.08 |
0.14 |
0.1 |
-0.12 |
-0.31 |
|
spectrin alpha chain, non-erythrocytic 1 isoform 3 |
| 84490394 |
|
Sptb |
|
3570 |
1380 |
615 |
1269 |
6854 |
|
0.14 |
0.34 |
0.54 |
0.14 |
-0.14 |
|
spectrin beta chain, erythrocytic |
| 117938332 |
|
Sptbn1 |
|
90761 |
14304 |
21833 |
100273 |
195770 |
|
0.04 |
0.08 |
0.06 |
0 |
-0.24 |
|
spectrin beta chain, non-erythrocytic 1 isoform 1 |
| 117938334 |
|
Sptbn1 |
|
81059 |
12369 |
19930 |
91703 |
168739 |
|
0.04 |
0.09 |
0.06 |
0 |
-0.25 |
|
spectrin beta chain, non-erythrocytic 1 isoform 2 |
| 55926127 |
|
Sptbn2 |
|
213723 |
28716 |
36018 |
157515 |
187138 |
|
0.18 |
0.29 |
0.15 |
-0.13 |
-0.37 |
|
spectrin beta chain, brain 2 |
| 116174793 |
|
Sptbn4 |
|
3991 |
3067 |
2447 |
1973 |
18260 |
|
-0.1 |
0.29 |
0.42 |
-0.21 |
-0.18 |
|
spectrin beta 4 isoform sigma1 |
| 29244577 |
|
Sptlc1 |
|
3753 |
4695 |
1365 |
0 |
0 |
|
-0.27 |
-0.16 |
-0.52 |
n.v. |
n.v. |
|
serine palmitoyltransferase 1 |
| 6755656 |
|
Sptlc2 |
|
2160 |
1248 |
3086 |
0 |
0 |
|
0 |
-0.33 |
-0.35 |
n.v. |
n.v. |
|
serine palmitoyltransferase 2 |
| 6678127 |
|
Sqle |
|
0 |
77 |
4 |
0 |
0 |
|
n.v. |
0.82 |
0.48 |
n.v. |
n.v. |
|
squalene monooxygenase |
| 244790049 |
|
Sqrdl |
|
113680 |
0 |
0 |
0 |
0 |
|
-0.15 |
n.v. |
n.v. |
n.v. |
n.v. |
|
sulfide:quinone oxidoreductase, mitochondrial |
| 244790045;244790049 |
|
Sqrdl |
|
0 |
52731 |
0 |
0 |
0 |
|
n.v. |
-0.21 |
n.v. |
n.v. |
n.v. |
|
sulfide:quinone oxidoreductase, mitochondrial |
| 244790049;244790045 |
|
Sqrdl |
|
0 |
0 |
2556 |
0 |
0 |
|
n.v. |
n.v. |
-0.26 |
n.v. |
n.v. |
|
sulfide:quinone oxidoreductase, mitochondrial |
| 6754954 |
|
Sqstm1 |
|
0 |
313 |
1039 |
1432 |
0 |
|
n.v. |
0.16 |
-0.02 |
0.34 |
n.v. |
|
sequestosome-1 |
| 257096048 |
|
Sra1 |
|
0 |
29 |
0 |
262 |
1896 |
|
n.v. |
0.11 |
n.v. |
-0.07 |
0.08 |
|
steroid receptor RNA activator 1 isoform a |
| 257096050 |
|
Sra1 |
|
0 |
29 |
0 |
262 |
835 |
|
n.v. |
0.11 |
n.v. |
-0.07 |
0.06 |
|
steroid receptor RNA activator 1 isoform b |
| 226443099 |
|
Srbd1 |
|
0 |
0 |
249 |
0 |
0 |
|
n.v. |
n.v. |
-0.16 |
n.v. |
n.v. |
|
S1 RNA-binding domain-containing protein 1 |
| 70794809 |
|
Src |
|
4888 |
10154 |
34119 |
8750 |
20819 |
|
0.27 |
0.17 |
-0.01 |
-0.1 |
-0.36 |
|
neuronal proto-oncogene tyrosine-protein kinase Src
isoform 2 |
| 70794811 |
|
Src |
|
4888 |
10154 |
34119 |
8750 |
20819 |
|
0.27 |
0.17 |
-0.01 |
-0.1 |
-0.36 |
|
neuronal proto-oncogene tyrosine-protein kinase Src
isoform 1 |
| 87044895 |
|
Srd5a1 |
|
1190 |
428 |
199 |
0 |
0 |
|
-0.13 |
-0.15 |
-0.22 |
n.v. |
n.v. |
|
3-oxo-5-alpha-steroid 4-dehydrogenase 1 |
| 27881427 |
|
Srd5a3 |
|
0 |
0 |
19 |
0 |
0 |
|
n.v. |
n.v. |
-0.52 |
n.v. |
n.v. |
|
probable polyprenol reductase |
| 73661204 |
|
Srebf2 |
|
0 |
0 |
0 |
0 |
835 |
|
n.v. |
n.v. |
n.v. |
n.v. |
0.36 |
|
sterol regulatory element-binding protein 2 |
| 27369842 |
|
Srek1 |
|
0 |
382 |
32 |
0 |
0 |
|
n.v. |
-0.18 |
-0.39 |
n.v. |
n.v. |
|
splicing regulatory glutamine/lysine-rich protein 1 |
| 124486650 |
|
Srgap1 |
|
0 |
0 |
0 |
0 |
3020 |
|
n.v. |
n.v. |
n.v. |
n.v. |
-0.7 |
|
SLIT-ROBO Rho GTPase-activating protein 1 isoform 1 |
| 334724478 |
|
Srgap1 |
|
0 |
0 |
0 |
0 |
3020 |
|
n.v. |
n.v. |
n.v. |
n.v. |
-0.7 |
|
SLIT-ROBO Rho GTPase-activating protein 1 isoform 2 |
| 157951723 |
|
Srgap2 |
|
0 |
0 |
0 |
0 |
3041 |
|
n.v. |
n.v. |
n.v. |
n.v. |
-0.69 |
|
SLIT-ROBO Rho GTPase-activating protein 2 |
| 154090967 |
|
Srgap3 |
|
0 |
0 |
0 |
0 |
161 |
|
n.v. |
n.v. |
n.v. |
n.v. |
0.44 |
|
SLIT-ROBO Rho GTPase-activating protein 3 |
| 124430537 |
|
Sri |
|
0 |
2017 |
14581 |
2194 |
191068 |
|
n.v. |
0.14 |
-0.02 |
-0.04 |
0.04 |
|
sorcin isoform 1 |
| 124430543 |
|
Sri |
|
0 |
2017 |
14581 |
2194 |
191068 |
|
n.v. |
0.14 |
-0.02 |
-0.04 |
0.04 |
|
sorcin isoform 2 |
| 34328417 |
|
Srl |
|
0 |
405 |
414 |
0 |
0 |
|
n.v. |
0.13 |
-0.14 |
n.v. |
n.v. |
|
sarcalumenin precursor |
| 6678131 |
|
Srm |
|
0 |
7981 |
1150 |
638 |
58849 |
|
n.v. |
0.02 |
-0.07 |
-0.48 |
0.04 |
|
spermidine synthase |
| 54287682 |
|
Srms |
|
0 |
1271 |
7879 |
0 |
2313 |
|
n.v. |
0.02 |
-0.17 |
n.v. |
-0.62 |
|
tyrosine-protein kinase Srms |
| 160333840 |
|
Srp19 |
|
2361 |
1731 |
1365 |
5312 |
2549 |
|
-0.05 |
-0.03 |
-0.08 |
0.05 |
-0.11 |
|
signal recognition particle 19 kDa protein |
| 31981338;153791789 |
|
Srp54a |
|
1629 |
0 |
0 |
0 |
0 |
|
0.04 |
n.v. |
n.v. |
n.v. |
n.v. |
|
signal recognition particle 54 kDa protein |
| 153791789 |
|
Srp54b |
|
0 |
6407 |
11630 |
13817 |
2624 |
|
n.v. |
0.1 |
-0.11 |
-0.04 |
-0.37 |
|
signal recognition particle 54 kDa protein |
| 153791464 |
|
Srp54c |
|
1629 |
3135 |
7286 |
11402 |
1574 |
|
0.04 |
0.08 |
-0.09 |
-0.05 |
-0.04 |
|
signal recognition particle 54C |
| 47271535 |
|
Srp68 |
|
4302 |
10360 |
9226 |
26448 |
4466 |
|
0.12 |
-0.03 |
0.03 |
-0.04 |
-0.11 |
|
signal recognition particle subunit SRP68 |
| 118344452 |
|
Srp72 |
|
0 |
3668 |
18867 |
38104 |
5558 |
|
n.v. |
-0.01 |
-0.02 |
0.06 |
-0.3 |
|
signal recognition particle 72 |
| 6755662 |
|
Srp9 |
|
4210 |
1071 |
1670 |
851 |
268 |
|
-0.08 |
0.12 |
-0.09 |
0.14 |
-0.06 |
|
signal recognition particle 9 kDa protein |
| 31982726 |
|
Srpk1 |
|
0 |
1403 |
11661 |
24884 |
0 |
|
n.v. |
-0.07 |
0.1 |
0.12 |
n.v. |
|
SRSF protein kinase 1 |
| 47059480 |
|
Srpk2 |
|
0 |
0 |
7164 |
6139 |
0 |
|
n.v. |
n.v. |
0.12 |
0.01 |
n.v. |
|
SRSF protein kinase 2 |
| 9790111 |
|
Srpk3 |
|
0 |
0 |
4333 |
794 |
0 |
|
n.v. |
n.v. |
0.15 |
1.62 |
n.v. |
|
SRSF protein kinase 3 |
| 27229036 |
|
Srpr |
|
0 |
1019 |
2229 |
0 |
0 |
|
n.v. |
-0.31 |
-0.01 |
n.v. |
n.v. |
|
signal recognition particle receptor subunit alpha |
| 6678137 |
|
Srprb |
|
16347 |
10262 |
3781 |
0 |
0 |
|
0.13 |
-0.18 |
-0.34 |
n.v. |
n.v. |
|
signal recognition particle receptor subunit beta |
| 7305521 |
|
Srr |
|
0 |
15 |
0 |
0 |
6522 |
|
n.v. |
0.06 |
n.v. |
n.v. |
0.05 |
|
serine racemase |
| 194440682 |
|
Srrm1 |
|
0 |
7436 |
3171 |
12688 |
0 |
|
n.v. |
0.09 |
-0.11 |
0.04 |
n.v. |
|
serine/arginine repetitive matrix protein 1 isoform
1 |
| 194440687 |
|
Srrm1 |
|
0 |
7436 |
3171 |
12688 |
0 |
|
n.v. |
0.09 |
-0.11 |
0.04 |
n.v. |
|
serine/arginine repetitive matrix protein 1 isoform
2 |
| 126157504 |
|
Srrm2 |
|
0 |
14406 |
6283 |
49195 |
1831 |
|
n.v. |
0.06 |
-0.06 |
-0.08 |
-0.37 |
|
serine/arginine repetitive matrix protein 2 |
| 13937395 |
|
Srrt |
|
42104 |
645 |
4920 |
25506 |
75031 |
|
0.03 |
-0.36 |
-0.05 |
0.02 |
-0.11 |
|
serrate RNA effector molecule homolog isoform 1 |
| 158186670 |
|
Srrt |
|
42104 |
645 |
4920 |
25506 |
75031 |
|
0.03 |
-0.36 |
-0.05 |
0.02 |
-0.11 |
|
serrate RNA effector molecule homolog isoform 2 |
| 158186674 |
|
Srrt |
|
42104 |
645 |
4920 |
25506 |
75031 |
|
0.03 |
-0.36 |
-0.05 |
0.02 |
-0.11 |
|
serrate RNA effector molecule homolog isoform 3 |
| 118582271 |
|
Srsf1 |
|
144306 |
11511 |
23820 |
16535 |
26645 |
|
-0.03 |
0 |
-0.05 |
-0.1 |
-0.13 |
|
serine/arginine-rich splicing factor 1 isoform 2 |
| 34328400 |
|
Srsf1 |
|
144306 |
11511 |
23820 |
16535 |
26645 |
|
-0.03 |
0 |
-0.05 |
-0.1 |
-0.13 |
|
serine/arginine-rich splicing factor 1 isoform 1 |
| 545746418 |
|
Srsf10 |
|
4595 |
0 |
0 |
0 |
0 |
|
-0.11 |
n.v. |
n.v. |
n.v. |
n.v. |
|
serine/arginine-rich splicing factor 10 isoform 3 |
| 545746420 |
|
Srsf10 |
|
4595 |
0 |
0 |
0 |
0 |
|
-0.11 |
n.v. |
n.v. |
n.v. |
n.v. |
|
serine/arginine-rich splicing factor 10 isoform 4 |
| 122937372 |
|
Srsf10 |
|
4595 |
820 |
250 |
0 |
0 |
|
-0.11 |
0.06 |
-0.01 |
n.v. |
n.v. |
|
serine/arginine-rich splicing factor 10 isoform 2 |
| 6753820 |
|
Srsf10 |
|
4595 |
820 |
250 |
0 |
0 |
|
-0.11 |
0.06 |
-0.01 |
n.v. |
n.v. |
|
serine/arginine-rich splicing factor 10 isoform 1 |
| 33469007 |
|
Srsf11 |
|
0 |
1286 |
23 |
0 |
0 |
|
n.v. |
-0.09 |
0.21 |
n.v. |
n.v. |
|
splicing factor, arginine/serine-rich 11 isoform 3 |
| 147898671 |
|
Srsf11 |
|
2087 |
2801 |
47 |
164 |
0 |
|
0.03 |
-0.09 |
-0.17 |
-0.26 |
n.v. |
|
splicing factor, arginine/serine-rich 11 isoform 1 |
| 148222073 |
|
Srsf11 |
|
2087 |
2801 |
47 |
164 |
0 |
|
0.03 |
-0.09 |
-0.17 |
-0.26 |
n.v. |
|
splicing factor, arginine/serine-rich 11 isoform 2 |
| 6755478 |
|
Srsf2 |
|
62057 |
1167 |
16348 |
40199 |
34495 |
|
0.06 |
0.02 |
-0.07 |
0.04 |
0.01 |
|
serine/arginine-rich splicing factor 2 |
| 8567402 |
|
Srsf3 |
|
237392 |
9198 |
34177 |
60982 |
8311 |
|
-0.04 |
-0.05 |
-0.19 |
-0.19 |
-0.33 |
|
serine/arginine-rich splicing factor 3 |
| 165377173 |
|
Srsf4 |
|
34727 |
14331 |
9712 |
52854 |
0 |
|
0.16 |
-0.01 |
-0.06 |
-0.14 |
n.v. |
|
serine/arginine-rich splicing factor 4 |
| 119226245 |
|
Srsf5 |
|
29418 |
17660 |
12961 |
97899 |
3984 |
|
0.91 |
0.03 |
-0.06 |
-0.05 |
-0.34 |
|
serine/arginine-rich splicing factor 5 |
| 224967104 |
|
Srsf6 |
|
29418 |
18070 |
12520 |
61334 |
139 |
|
0.91 |
-0.03 |
-0.11 |
-0.13 |
-0.01 |
|
arginine/serine-rich splicing factor 6 |
| 22122585 |
|
Srsf7 |
|
71558 |
2357 |
4705 |
50873 |
3952 |
|
0.07 |
-0.14 |
-0.12 |
-0.19 |
-0.27 |
|
serine/arginine-rich splicing factor 7 isoform 1 |
| 306774098 |
|
Srsf7 |
|
71558 |
2357 |
4705 |
50873 |
3952 |
|
0.07 |
-0.14 |
-0.12 |
-0.19 |
-0.27 |
|
serine/arginine-rich splicing factor 7 isoform 2 |
| 306774101 |
|
Srsf7 |
|
71558 |
2357 |
4705 |
50873 |
3952 |
|
0.07 |
-0.14 |
-0.12 |
-0.19 |
-0.27 |
|
serine/arginine-rich splicing factor 7 isoform 3 |
| 306774103 |
|
Srsf7 |
|
71558 |
2357 |
4705 |
41067 |
3952 |
|
0.07 |
-0.14 |
-0.12 |
-0.17 |
-0.27 |
|
serine/arginine-rich splicing factor 7 isoform 4 |
| 13385016 |
|
Srsf9 |
|
2599 |
0 |
618 |
0 |
0 |
|
0.09 |
n.v. |
0.08 |
n.v. |
n.v. |
|
serine/arginine-rich splicing factor 9 |
| 402747081 |
|
Srxn1 |
|
0 |
129 |
51 |
246 |
3395 |
|
n.v. |
-0.14 |
0.23 |
-0.47 |
0.11 |
|
sulfiredoxin-1 |
| 260436924 |
|
Ss18l1 |
|
0 |
0 |
0 |
1874 |
0 |
|
n.v. |
n.v. |
n.v. |
-0.2 |
n.v. |
|
calcium-responsive transactivator |
| 6678143 |
|
Ssb |
|
180973 |
9208 |
36491 |
107607 |
37558 |
|
0.01 |
0.14 |
-0.15 |
-0.05 |
0.05 |
|
lupus La protein homolog |
| 47058964 |
|
Ssbp1 |
|
4192 |
2541 |
0 |
0 |
278 |
|
0.14 |
-0.1 |
n.v. |
n.v. |
-0.19 |
|
single-stranded DNA-binding protein, mitochondrial
isoform 2 |
| 47059026 |
|
Ssbp1 |
|
4357 |
2541 |
0 |
0 |
278 |
|
0.11 |
-0.1 |
n.v. |
n.v. |
-0.19 |
|
single-stranded DNA-binding protein, mitochondrial
isoform 1 |
| 37674269 |
|
Ssh3 |
|
0 |
0 |
0 |
0 |
6993 |
|
n.v. |
n.v. |
n.v. |
n.v. |
0.18 |
|
protein phosphatase Slingshot homolog 3 |
| 12963687 |
|
Ssna1 |
|
0 |
0 |
0 |
0 |
921 |
|
n.v. |
n.v. |
n.v. |
n.v. |
0.15 |
|
Sjoegren syndrome nuclear autoantigen 1 homolog |
| 165377206 |
|
Ssr1 |
|
6444 |
10181 |
2613 |
0 |
0 |
|
-0.06 |
-0.23 |
-0.28 |
n.v. |
n.v. |
|
translocon-associated protein subunit alpha
precursor |
| 21312968 |
|
Ssr3 |
|
22260 |
455 |
361 |
139 |
0 |
|
0.06 |
-0.07 |
-0.25 |
-0.31 |
n.v. |
|
translocon-associated protein subunit gamma |
| 262050625 |
|
Ssr4 |
|
45271 |
4613 |
5266 |
958 |
0 |
|
0.04 |
-0.17 |
-0.32 |
-0.46 |
n.v. |
|
translocon-associated protein subunit delta isoform 1
precursor |
| 6678145 |
|
Ssr4 |
|
45271 |
4613 |
5266 |
958 |
0 |
|
0.04 |
-0.17 |
-0.32 |
-0.46 |
n.v. |
|
translocon-associated protein subunit delta isoform 2
precursor |
| 111154063 |
|
Ssrp1 |
|
3222 |
6812 |
5250 |
28797 |
0 |
|
0.16 |
0 |
-0.1 |
0.02 |
n.v. |
|
FACT complex subunit SSRP1 |
| 31543773 |
|
Sssca1 |
|
0 |
0 |
496 |
8718 |
7207 |
|
n.v. |
n.v. |
-0.12 |
0.15 |
0.11 |
|
Sjoegren syndrome/scleroderma autoantigen 1 homolog |
| 172088095 |
|
Ssu72 |
|
0 |
0 |
18 |
0 |
2292 |
|
n.v. |
n.v. |
-0.03 |
n.v. |
-0.11 |
|
RNA polymerase II subunit A C-terminal domain phosphatase
SSU72 |
| 19526912 |
|
St13 |
|
16201 |
13487 |
41289 |
242465 |
513746 |
|
0.36 |
0.11 |
0.04 |
0.11 |
0.02 |
|
hsc70-interacting protein |
| 7363445 |
|
St14 |
|
0 |
5438 |
10397 |
0 |
0 |
|
n.v. |
0.09 |
0.06 |
n.v. |
n.v. |
|
suppressor of tumorigenicity 14 protein homolog |
| 9055352 |
|
St3gal6 |
|
0 |
791 |
370 |
0 |
0 |
|
n.v. |
-0.08 |
-0.39 |
n.v. |
n.v. |
|
type 2 lactosamine alpha-2,3-sialyltransferase |
| 118150672 |
|
Stag2 |
|
3204 |
0 |
0 |
0 |
0 |
|
0.17 |
n.v. |
n.v. |
n.v. |
n.v. |
|
cohesin subunit SA-2 |
| 6755668 |
|
Stam |
|
0 |
307 |
1237 |
0 |
4948 |
|
n.v. |
0.03 |
0.33 |
n.v. |
-0.46 |
|
signal transducing adapter molecule 1 |
| 9789975 |
|
Stam2 |
|
0 |
278 |
1869 |
0 |
4948 |
|
n.v. |
-1.19 |
0.01 |
n.v. |
-0.46 |
|
signal transducing adapter molecule 2 |
| 17941277 |
|
Stambp |
|
0 |
574 |
255 |
0 |
15047 |
|
n.v. |
0.49 |
0.47 |
n.v. |
0.08 |
|
STAM-binding protein |
| 22122357 |
|
Stap2 |
|
0 |
0 |
0 |
0 |
1039 |
|
n.v. |
n.v. |
n.v. |
n.v. |
-0.29 |
|
signal-transducing adaptor protein 2 |
| 9910482 |
|
Stard10 |
|
0 |
3263 |
1671 |
3356 |
27673 |
|
n.v. |
-0.26 |
-0.09 |
-0.12 |
-0.15 |
|
PCTP-like protein |
| 10946984 |
|
Stard3 |
|
0 |
0 |
42 |
0 |
0 |
|
n.v. |
n.v. |
0.06 |
n.v. |
n.v. |
|
stAR-related lipid transfer protein 3 |
| 70794799 |
|
Stard3nl |
|
0 |
0 |
34 |
0 |
0 |
|
n.v. |
n.v. |
0.13 |
n.v. |
n.v. |
|
MLN64 N-terminal domain homolog |
| 21218432 |
|
Stard5 |
|
0 |
0 |
7 |
0 |
0 |
|
n.v. |
n.v. |
-0.09 |
n.v. |
n.v. |
|
stAR-related lipid transfer protein 5 |
| 114326482;328887938 |
|
Stat1 |
|
0 |
0 |
1263 |
0 |
0 |
|
n.v. |
n.v. |
-0.01 |
n.v. |
n.v. |
|
signal transducer and activator of transcription 1
isoform 2 |
| 114326482 |
|
Stat1 |
|
0 |
0 |
0 |
1940 |
0 |
|
n.v. |
n.v. |
n.v. |
0.47 |
n.v. |
|
signal transducer and activator of transcription 1
isoform 2 |
| 328887938;114326482 |
|
Stat1 |
|
0 |
724 |
0 |
0 |
20830 |
|
n.v. |
-0.15 |
n.v. |
n.v. |
0.01 |
|
signal transducer and activator of transcription 1
isoform 2 |
| 328887935 |
|
Stat1 |
|
0 |
724 |
1263 |
1940 |
20830 |
|
n.v. |
-0.15 |
-0.01 |
0.47 |
0.01 |
|
signal transducer and activator of transcription 1
isoform 1 |
| 9910572 |
|
Stat2 |
|
0 |
0 |
0 |
0 |
867 |
|
n.v. |
n.v. |
n.v. |
n.v. |
0.41 |
|
signal transducer and activator of transcription 2 |
| 22094115 |
|
Stat3 |
|
0 |
146 |
228 |
941 |
9285 |
|
n.v. |
-0.21 |
-0.27 |
0.55 |
-0.13 |
|
signal transducer and activator of transcription 3
isoform 3 |
| 47458804 |
|
Stat3 |
|
0 |
146 |
228 |
941 |
9285 |
|
n.v. |
-0.21 |
-0.27 |
0.55 |
-0.13 |
|
signal transducer and activator of transcription 3
isoform 1 |
| 47458807 |
|
Stat3 |
|
0 |
146 |
228 |
941 |
9285 |
|
n.v. |
-0.21 |
-0.27 |
0.55 |
-0.13 |
|
signal transducer and activator of transcription 3
isoform 2 |
| 255759968 |
|
Stat5a |
|
0 |
1382 |
0 |
0 |
6768 |
|
n.v. |
-0.04 |
n.v. |
n.v. |
-0.14 |
|
signal transducer and activator of transcription 5A
isoform 2 |
| 6755672 |
|
Stat5a |
|
0 |
1382 |
0 |
0 |
6768 |
|
n.v. |
-0.04 |
n.v. |
n.v. |
-0.14 |
|
signal transducer and activator of transcription 5A
isoform 1 |
| 165932366 |
|
Stat5b |
|
0 |
1382 |
0 |
0 |
6768 |
|
n.v. |
-0.04 |
n.v. |
n.v. |
-0.14 |
|
signal transducer and activator of transcription 5B |
| 128485774 |
|
Stat6 |
|
0 |
0 |
0 |
0 |
3609 |
|
n.v. |
n.v. |
n.v. |
n.v. |
0.07 |
|
signal transducer and transcription activator 6 |
| 158186639 |
|
Stau1 |
|
0 |
739 |
12936 |
7400 |
0 |
|
n.v. |
0.28 |
0.09 |
-0.01 |
n.v. |
|
double-stranded RNA-binding protein Staufen homolog 1
isoform 2 |
| 158186641 |
|
Stau1 |
|
0 |
739 |
12936 |
7678 |
0 |
|
n.v. |
0.28 |
0.09 |
-0.06 |
n.v. |
|
double-stranded RNA-binding protein Staufen homolog 1
isoform 1 |
| 6755674 |
|
Stau1 |
|
0 |
739 |
11708 |
7400 |
0 |
|
n.v. |
0.28 |
0.09 |
-0.01 |
n.v. |
|
double-stranded RNA-binding protein Staufen homolog 1
isoform 3 |
| 162287083 |
|
Stau2 |
|
0 |
0 |
60 |
0 |
0 |
|
n.v. |
n.v. |
0.37 |
n.v. |
n.v. |
|
double-stranded RNA-binding protein Staufen homolog 2
isoform 2 |
| 194018455 |
|
Stau2 |
|
0 |
0 |
60 |
0 |
0 |
|
n.v. |
n.v. |
0.37 |
n.v. |
n.v. |
|
double-stranded RNA-binding protein Staufen homolog 2
isoform 3 |
| 254553462 |
|
Steap1 |
|
0 |
0 |
64 |
0 |
0 |
|
n.v. |
n.v. |
-0.14 |
n.v. |
n.v. |
|
metalloreductase STEAP1 |
| 124249344 |
|
Steap2 |
|
0 |
344 |
15 |
0 |
0 |
|
n.v. |
-0.01 |
-0.06 |
n.v. |
n.v. |
|
metalloreductase STEAP2 |
| 31981983 |
|
Stim1 |
|
0 |
192 |
13 |
0 |
0 |
|
n.v. |
-0.23 |
-0.2 |
n.v. |
n.v. |
|
stromal interaction molecule 1 precursor |
| 281182368 |
|
Stim2 |
|
0 |
42 |
44 |
0 |
0 |
|
n.v. |
-0.03 |
-0.16 |
n.v. |
n.v. |
|
stromal interaction molecule 2 precursor |
| 14389431 |
|
Stip1 |
|
9611 |
19629 |
72671 |
99717 |
389130 |
|
0.32 |
0.03 |
0.01 |
0.17 |
-0.03 |
|
stress-induced-phosphoprotein 1 |
| 126362973 |
|
Stk10 |
|
0 |
0 |
376 |
532 |
8300 |
|
n.v. |
n.v. |
-0.12 |
0.29 |
-0.05 |
|
serine/threonine-protein kinase 10 |
| 7106425 |
|
Stk11 |
|
0 |
33 |
0 |
0 |
407 |
|
n.v. |
-1.33 |
n.v. |
n.v. |
0.32 |
|
serine/threonine-protein kinase STK11 |
| 169808413 |
|
Stk11ip |
|
0 |
324 |
0 |
0 |
0 |
|
n.v. |
0.03 |
n.v. |
n.v. |
n.v. |
|
serine/threonine-protein kinase 11-interacting protein |
| 226958539 |
|
Stk16 |
|
0 |
0 |
60 |
0 |
0 |
|
n.v. |
n.v. |
-0.12 |
n.v. |
n.v. |
|
serine/threonine-protein kinase 16 |
| 21703922 |
|
Stk24 |
|
0 |
5743 |
17662 |
17460 |
40942 |
|
n.v. |
0.39 |
-0.22 |
-0.03 |
0.05 |
|
serine/threonine-protein kinase 24 |
| 89337277 |
|
Stk25 |
|
0 |
3674 |
14193 |
12311 |
9778 |
|
n.v. |
0.37 |
-0.21 |
0.05 |
0.05 |
|
serine/threonine-protein kinase 25 |
| 118150664 |
|
Stk3 |
|
0 |
1117 |
894 |
0 |
13205 |
|
n.v. |
0.41 |
0.12 |
n.v. |
0.46 |
|
serine/threonine-protein kinase 3 |
| 19527344 |
|
Stk38 |
|
0 |
0 |
729 |
0 |
6833 |
|
n.v. |
n.v. |
-0.1 |
n.v. |
0.36 |
|
serine/threonine-protein kinase 38 |
| 27370078 |
|
Stk38l |
|
0 |
0 |
189 |
0 |
3020 |
|
n.v. |
n.v. |
0.14 |
n.v. |
0.56 |
|
serine/threonine-protein kinase 38-like |
| 12328814 |
|
Stk4 |
|
0 |
372 |
539 |
0 |
21944 |
|
n.v. |
0.03 |
0.08 |
n.v. |
0.32 |
|
serine/threonine-protein kinase 4 |
| 9789995 |
|
Stmn1 |
|
2947 |
1376 |
5550 |
1359 |
78329 |
|
0.49 |
0.47 |
0.04 |
0.17 |
0.06 |
|
stathmin |
| 13384630 |
|
Stmn2 |
|
0 |
779 |
3941 |
0 |
45590 |
|
n.v. |
0.33 |
0.03 |
n.v. |
0.05 |
|
stathmin-2 |
| 9790189 |
|
Stmn4 |
|
0 |
0 |
0 |
0 |
64 |
|
n.v. |
n.v. |
n.v. |
n.v. |
0.22 |
|
stathmin-4 |
| 7710018 |
|
Stom |
|
0 |
0 |
0 |
0 |
107 |
|
n.v. |
n.v. |
n.v. |
n.v. |
-0.08 |
|
erythrocyte band 7 integral membrane protein |
| 12963591 |
|
Stoml2 |
|
39559 |
1503 |
274 |
65 |
0 |
|
-0.13 |
-0.21 |
-0.47 |
-0.56 |
n.v. |
|
stomatin-like protein 2, mitochondrial |
| 159032010 |
|
Ston1 |
|
0 |
0 |
0 |
0 |
675 |
|
n.v. |
n.v. |
n.v. |
n.v. |
-0.39 |
|
stonin-1 |
| 30425068 |
|
Ston2 |
|
0 |
0 |
309 |
0 |
375 |
|
n.v. |
n.v. |
0.4 |
n.v. |
-0.97 |
|
stonin-2 |
| 160707896 |
|
Strap |
|
1080 |
795 |
32329 |
72598 |
67695 |
|
-0.21 |
0.23 |
0.1 |
0.06 |
0.04 |
|
serine-threonine kinase receptor-associated protein |
| 114842377 |
|
Strbp |
|
0 |
0 |
3601 |
3241 |
0 |
|
n.v. |
n.v. |
-0.03 |
0.65 |
n.v. |
|
spermatid perinuclear RNA-binding protein |
| 169646306 |
|
Strip1 |
|
0 |
44 |
67 |
2292 |
0 |
|
n.v. |
0.12 |
-0.97 |
-0.21 |
n.v. |
|
striatin-interacting protein 1 |
| 83627724 |
|
Strip2 |
|
0 |
0 |
67 |
2292 |
0 |
|
n.v. |
n.v. |
-0.97 |
-0.21 |
n.v. |
|
striatin-interacting proteins 2 isoform b |
| 83627727 |
|
Strip2 |
|
0 |
0 |
67 |
2292 |
0 |
|
n.v. |
n.v. |
-0.97 |
-0.21 |
n.v. |
|
striatin-interacting proteins 2 isoform a |
| 61098078 |
|
Strn |
|
0 |
530 |
654 |
3512 |
1178 |
|
n.v. |
0.11 |
0.37 |
0.09 |
0.99 |
|
striatin |
| 16418469 |
|
Strn3 |
|
0 |
349 |
86 |
12336 |
1274 |
|
n.v. |
0.29 |
0.26 |
-0.15 |
-0.25 |
|
striatin-3 isoform 1 |
| 285402377 |
|
Strn3 |
|
0 |
349 |
86 |
13817 |
1274 |
|
n.v. |
0.29 |
0.26 |
-0.15 |
-0.25 |
|
striatin-3 isoform 2 |
| 89886482 |
|
Strn4 |
|
0 |
0 |
288 |
33 |
364 |
|
n.v. |
n.v. |
0.14 |
-0.62 |
-0.29 |
|
striatin-4 isoform 1 |
| 89886486 |
|
Strn4 |
|
0 |
0 |
288 |
33 |
364 |
|
n.v. |
n.v. |
0.14 |
-0.62 |
-0.29 |
|
striatin-4 isoform 2 |
| 148747128 |
|
Stt3a |
|
8421 |
9456 |
7941 |
0 |
0 |
|
-1.62 |
-0.35 |
-0.4 |
n.v. |
n.v. |
|
dolichyl-diphosphooligosaccharide--protein
glycosyltransferase subunit STT3A |
| 61651673 |
|
Stt3b |
|
0 |
3559 |
4185 |
0 |
0 |
|
n.v. |
-0.25 |
-0.27 |
n.v. |
n.v. |
|
dolichyl-diphosphooligosaccharide--protein
glycosyltransferase subunit STT3B |
| 9789907 |
|
Stub1 |
|
0 |
3987 |
3142 |
24409 |
29890 |
|
n.v. |
0.08 |
0 |
0.06 |
0.01 |
|
STIP1 homology and U box-containing protein 1 |
| 19527102 |
|
Stx12 |
|
9025 |
4403 |
3967 |
4723 |
375 |
|
0.01 |
0.22 |
0.15 |
0.17 |
0.14 |
|
syntaxin-12 |
| 156231057 |
|
Stx16 |
|
0 |
13 |
1895 |
999 |
0 |
|
n.v. |
-0.13 |
0.03 |
0.14 |
n.v. |
|
syntaxin-16 isoform a |
| 156231059 |
|
Stx16 |
|
0 |
13 |
1895 |
999 |
0 |
|
n.v. |
-0.13 |
0.03 |
0.14 |
n.v. |
|
syntaxin-16 isoform b |
| 156231061 |
|
Stx16 |
|
0 |
13 |
1895 |
999 |
0 |
|
n.v. |
-0.13 |
0.03 |
0.14 |
n.v. |
|
syntaxin-16 isoform c |
| 156231063 |
|
Stx16 |
|
0 |
13 |
1895 |
999 |
0 |
|
n.v. |
-0.13 |
0.03 |
0.14 |
n.v. |
|
syntaxin-16 isoform d |
| 84579893 |
|
Stx17 |
|
0 |
205 |
0 |
0 |
0 |
|
n.v. |
-0.31 |
n.v. |
n.v. |
n.v. |
|
syntaxin-17 |
| 77736535 |
|
Stx18 |
|
0 |
38 |
0 |
0 |
0 |
|
n.v. |
-0.3 |
n.v. |
n.v. |
n.v. |
|
syntaxin-18 |
| 22726207 |
|
Stx3 |
|
0 |
1102 |
2425 |
0 |
0 |
|
n.v. |
0.35 |
-0.25 |
n.v. |
n.v. |
|
syntaxin-3 isoform C |
| 70778802 |
|
Stx3 |
|
0 |
2417 |
2973 |
0 |
0 |
|
n.v. |
0.18 |
-0.24 |
n.v. |
n.v. |
|
syntaxin-3 isoform B |
| 70778911 |
|
Stx3 |
|
0 |
2417 |
2973 |
0 |
0 |
|
n.v. |
0.18 |
-0.24 |
n.v. |
n.v. |
|
syntaxin-3 isoform A |
| 6678177 |
|
Stx4a |
|
0 |
6375 |
8413 |
483 |
0 |
|
n.v. |
0.05 |
-0.17 |
-0.58 |
n.v. |
|
syntaxin-4 |
| 268370185;268370181 |
|
Stx5a |
|
0 |
0 |
966 |
0 |
0 |
|
n.v. |
n.v. |
-0.08 |
n.v. |
n.v. |
|
syntaxin-5 |
| 268370181;268370185 |
|
Stx5a |
|
0 |
2144 |
0 |
1596 |
0 |
|
n.v. |
0.07 |
n.v. |
0.4 |
n.v. |
|
syntaxin-5 |
| 10946800 |
|
Stx6 |
|
0 |
3021 |
2082 |
237 |
0 |
|
n.v. |
-0.08 |
0.14 |
-0.3 |
n.v. |
|
syntaxin-6 |
| 31560462 |
|
Stx7 |
|
35422 |
7826 |
15069 |
16003 |
6158 |
|
0.08 |
-0.05 |
0.04 |
0.08 |
-0.16 |
|
syntaxin-7 |
| 9055356 |
|
Stx8 |
|
604 |
1376 |
0 |
0 |
0 |
|
-0.06 |
0.13 |
n.v. |
n.v. |
n.v. |
|
syntaxin-8 |
| 165972305 |
|
Stxbp1 |
|
0 |
2 |
505 |
0 |
0 |
|
n.v. |
-0.29 |
-0.32 |
n.v. |
n.v. |
|
syntaxin-binding protein 1 isoform b |
| 165972307 |
|
Stxbp1 |
|
0 |
2 |
505 |
0 |
0 |
|
n.v. |
-0.29 |
-0.32 |
n.v. |
n.v. |
|
syntaxin-binding protein 1 isoform a |
| 6755688 |
|
Stxbp2 |
|
1446 |
1050 |
22636 |
4993 |
9467 |
|
0.39 |
0.36 |
-0.25 |
0 |
0.02 |
|
syntaxin-binding protein 2 |
| 6755690 |
|
Stxbp3a |
|
0 |
2639 |
17086 |
0 |
0 |
|
n.v. |
0.01 |
-0.1 |
n.v. |
n.v. |
|
syntaxin-binding protein 3 |
| 6755692 |
|
Stxbp4 |
|
0 |
0 |
164 |
0 |
289 |
|
n.v. |
n.v. |
-0.35 |
n.v. |
-0.45 |
|
syntaxin-binding protein 4 |
| 158749547 |
|
Stxbp5 |
|
0 |
177 |
29 |
0 |
0 |
|
n.v. |
0.38 |
-0.37 |
n.v. |
n.v. |
|
syntaxin-binding protein 5 |
| 308082030 |
|
Styxl1 |
|
0 |
0 |
0 |
0 |
2677 |
|
n.v. |
n.v. |
n.v. |
n.v. |
0.09 |
|
serine/threonine/tyrosine-interacting-like protein 1 |
| 6755364 |
|
Sub1 |
|
36850 |
78430 |
63815 |
22854 |
707 |
|
0.02 |
0.14 |
-0.01 |
-0.29 |
-0.52 |
|
activated RNA polymerase II transcriptional coactivator
p15 |
| 46849708 |
|
Sucla2 |
|
45619 |
16909 |
120 |
0 |
1274 |
|
0.05 |
-0.1 |
-1.14 |
n.v. |
-1.18 |
|
succinyl-CoA ligase [ADP-forming] subunit beta,
mitochondrial precursor |
| 255958286 |
|
Suclg1 |
|
76354 |
21883 |
41 |
0 |
2527 |
|
-0.02 |
-0.17 |
-0.75 |
n.v. |
0.46 |
|
succinyl-CoA ligase [ADP/GDP-forming] subunit alpha,
mitochondrial precursor |
| 165972309 |
|
Suclg2 |
|
79009 |
28948 |
493 |
0 |
4048 |
|
-0.06 |
-0.16 |
-0.36 |
n.v. |
-0.3 |
|
succinyl-CoA ligase [GDP-forming] subunit beta,
mitochondrial precursor |
| 70794805 |
|
Sufu |
|
0 |
0 |
0 |
0 |
3224 |
|
n.v. |
n.v. |
n.v. |
n.v. |
-0.06 |
|
suppressor of fused homolog isoform 1 |
| 70794807 |
|
Sufu |
|
0 |
0 |
0 |
0 |
3224 |
|
n.v. |
n.v. |
n.v. |
n.v. |
-0.06 |
|
suppressor of fused homolog isoform 2 |
| 23956176 |
|
Sugt1 |
|
3881 |
44 |
6627 |
51651 |
110394 |
|
0.4 |
-0.25 |
0.24 |
0.11 |
0.05 |
|
suppressor of G2 allele of SKP1 homolog |
| 40254554 |
|
Sult1c1 |
|
0 |
1127 |
231 |
0 |
33307 |
|
n.v. |
-0.15 |
0.04 |
n.v. |
-0.11 |
|
sulfotransferase 1C1 |
| 34328501 |
|
Sult1c2 |
|
0 |
0 |
0 |
0 |
1564 |
|
n.v. |
n.v. |
n.v. |
n.v. |
0.64 |
|
sulfotransferase 1C2 |
| 188219649 |
|
Sult1d1 |
|
3295 |
3657 |
3086 |
5452 |
259448 |
|
0.72 |
0.07 |
0.23 |
0.05 |
0.13 |
|
sulfotransferase 1 family member D1 |
| 229092371 |
|
Sult2b1 |
|
0 |
230 |
0 |
0 |
1628 |
|
n.v. |
-1.86 |
n.v. |
n.v. |
-0.12 |
|
sulfotransferase family cytosolic 2B member 1 |
| 171906580 |
|
Sult3a1 |
|
0 |
0 |
0 |
0 |
300 |
|
n.v. |
n.v. |
n.v. |
n.v. |
0.27 |
|
amine sulfotransferase |
| 144094256 |
|
Sumf1 |
|
0 |
4 |
0 |
0 |
878 |
|
n.v. |
-1.18 |
n.v. |
n.v. |
-0.25 |
|
sulfatase-modifying factor 1 precursor |
| 19111164 |
|
Sumo2 |
|
36905 |
221 |
13742 |
13449 |
114688 |
|
0.14 |
-0.01 |
-0.03 |
-0.08 |
-0.12 |
|
small ubiquitin-related modifier 2 precursor |
| 9910556 |
|
Sumo3 |
|
36392 |
180 |
13534 |
13449 |
121028 |
|
0.15 |
-0.4 |
-0.05 |
-0.08 |
-0.12 |
|
small ubiquitin-related modifier 3 precursor |
| 29789243 |
|
Sun1 |
|
1373 |
0 |
0 |
0 |
0 |
|
-0.07 |
n.v. |
n.v. |
n.v. |
n.v. |
|
SUN domain-containing protein 1 isoform 1 |
| 371120922 |
|
Sun1 |
|
1373 |
0 |
0 |
0 |
0 |
|
-0.07 |
n.v. |
n.v. |
n.v. |
n.v. |
|
SUN domain-containing protein 1 isoform 2 |
| 371120936 |
|
Sun1 |
|
1117 |
0 |
0 |
0 |
0 |
|
0.16 |
n.v. |
n.v. |
n.v. |
n.v. |
|
SUN domain-containing protein 1 isoform 3 |
| 371121164 |
|
Sun1 |
|
1117 |
0 |
0 |
0 |
0 |
|
0.16 |
n.v. |
n.v. |
n.v. |
n.v. |
|
SUN domain-containing protein 1 isoform 4 |
| 371121280 |
|
Sun1 |
|
1117 |
0 |
0 |
0 |
0 |
|
0.16 |
n.v. |
n.v. |
n.v. |
n.v. |
|
SUN domain-containing protein 1 isoform 5 |
| 168693641 |
|
Sun2 |
|
73096 |
0 |
0 |
0 |
0 |
|
-0.08 |
n.v. |
n.v. |
n.v. |
n.v. |
|
SUN domain-containing protein 2 isoform 3 |
| 329299035 |
|
Sun2 |
|
73096 |
0 |
0 |
0 |
0 |
|
-0.08 |
n.v. |
n.v. |
n.v. |
n.v. |
|
SUN domain-containing protein 2 isoform 1 |
| 329299037 |
|
Sun2 |
|
73096 |
0 |
0 |
0 |
0 |
|
-0.08 |
n.v. |
n.v. |
n.v. |
n.v. |
|
SUN domain-containing protein 2 isoform 2 |
| 154350222 |
|
Supt16 |
|
10929 |
8068 |
9084 |
38071 |
4091 |
|
-0.13 |
0.08 |
-0.02 |
-0.1 |
-0.18 |
|
FACT complex subunit SPT16 |
| 6678181 |
|
Supt4a |
|
0 |
276 |
0 |
393 |
2324 |
|
n.v. |
0.33 |
n.v. |
-0.26 |
0.26 |
|
transcription elongation factor SPT4 1 |
| 22094123 |
|
Supt5 |
|
0 |
397 |
16 |
3070 |
35202 |
|
n.v. |
0.06 |
-0.31 |
0.04 |
0.12 |
|
transcription elongation factor SPT5 |
| 166091434 |
|
Supt6 |
|
458 |
8 |
0 |
82 |
38618 |
|
-0.13 |
0.15 |
n.v. |
0.22 |
0.12 |
|
transcription elongation factor SPT6 |
| 31088872 |
|
Supv3l1 |
|
0 |
4501 |
0 |
0 |
0 |
|
n.v. |
-0.16 |
n.v. |
n.v. |
n.v. |
|
ATP-dependent RNA helicase SUPV3L1, mitochondrial
precursor |
| 160707899 |
|
Surf1 |
|
0 |
246 |
0 |
0 |
0 |
|
n.v. |
-0.24 |
n.v. |
n.v. |
n.v. |
|
surfeit locus protein 1 isoform 1 |
| 411147435 |
|
Surf1 |
|
0 |
246 |
0 |
0 |
0 |
|
n.v. |
-0.24 |
n.v. |
n.v. |
n.v. |
|
surfeit locus protein 1 isoform 2 |
| 7305529 |
|
Surf2 |
|
0 |
0 |
0 |
1981 |
0 |
|
n.v. |
n.v. |
n.v. |
-0.13 |
n.v. |
|
surfeit locus protein 2 |
| 6755698 |
|
Surf4 |
|
35807 |
132 |
639 |
1105 |
0 |
|
-0.05 |
-0.68 |
-0.08 |
0.31 |
n.v. |
|
surfeit locus protein 4 |
| 6678185 |
|
Surf6 |
|
824 |
0 |
0 |
0 |
0 |
|
-0.17 |
n.v. |
n.v. |
n.v. |
n.v. |
|
surfeit locus protein 6 |
| 268607615 |
|
Suv420h1 |
|
0 |
0 |
309 |
0 |
17232 |
|
n.v. |
n.v. |
0.26 |
n.v. |
0.11 |
|
histone-lysine N-methyltransferase SUV420H1 isoform
b |
| 268607619 |
|
Suv420h1 |
|
0 |
0 |
309 |
0 |
17232 |
|
n.v. |
n.v. |
0.26 |
n.v. |
0.11 |
|
histone-lysine N-methyltransferase SUV420H1 isoform
a |
| 237858757 |
|
Svip |
|
0 |
0 |
4 |
0 |
0 |
|
n.v. |
n.v. |
0.35 |
n.v. |
n.v. |
|
small VCP/p97-interacting protein |
| 228008363 |
|
Swap70 |
|
0 |
234 |
0 |
0 |
15593 |
|
n.v. |
0.24 |
n.v. |
n.v. |
0.1 |
|
switch-associated protein 70 |
| 270265917 |
|
Syap1 |
|
0 |
198 |
20 |
0 |
20637 |
|
n.v. |
0.03 |
0.04 |
n.v. |
0.13 |
|
synapse-associated protein 1 |
| 56550045 |
|
Syk |
|
0 |
0 |
0 |
0 |
1060 |
|
n.v. |
n.v. |
n.v. |
n.v. |
-1.91 |
|
tyrosine-protein kinase SYK |
| 226437613 |
|
Sympk |
|
4631 |
0 |
337 |
557 |
5451 |
|
-0.08 |
n.v. |
0.06 |
0.45 |
0.02 |
|
symplekin |
| 85701452 |
|
Syna |
|
3661 |
0 |
2919 |
5984 |
0 |
|
0.14 |
n.v. |
0.04 |
0 |
n.v. |
|
envelope glycoprotein syncytin-A precursor |
| 547235396 |
|
Syncrip |
|
100866 |
0 |
0 |
0 |
0 |
|
-0.17 |
n.v. |
n.v. |
n.v. |
n.v. |
|
heterogeneous nuclear ribonucleoprotein Q isoform 3 |
| 114145493 |
|
Syncrip |
|
122083 |
18383 |
130029 |
278129 |
364 |
|
-0.17 |
0.15 |
0.09 |
-0.01 |
0.28 |
|
heterogeneous nuclear ribonucleoprotein Q isoform 1 |
| 29788787 |
|
Syncrip |
|
122083 |
18383 |
130029 |
278129 |
364 |
|
-0.17 |
0.15 |
0.09 |
-0.01 |
0.28 |
|
heterogeneous nuclear ribonucleoprotein Q isoform 2 |
| 119120816 |
|
Syne1 |
|
0 |
10 |
2785 |
0 |
2399 |
|
n.v. |
-0.22 |
-0.13 |
n.v. |
-0.15 |
|
nesprin-1 isoform 2 |
| 119120865 |
|
Syne1 |
|
0 |
10 |
2785 |
0 |
2399 |
|
n.v. |
-0.22 |
-0.13 |
n.v. |
-0.15 |
|
nesprin-1 isoform 3 |
| 145699091 |
|
Syne2 |
|
1471053 |
258278 |
278571 |
494326 |
661290 |
|
0.06 |
-0.15 |
-0.15 |
-0.07 |
-0.25 |
|
nesprin-2 |
| 46877048 |
|
Syngr1 |
|
0 |
267 |
658 |
1621 |
0 |
|
n.v. |
-0.06 |
0.02 |
0.36 |
n.v. |
|
synaptogyrin-1 isoform 1a |
| 6678193 |
|
Syngr1 |
|
0 |
267 |
658 |
1621 |
0 |
|
n.v. |
-0.06 |
0.02 |
0.36 |
n.v. |
|
synaptogyrin-1 isoform 1b |
| 7106429 |
|
Syngr2 |
|
2398 |
4943 |
8761 |
15716 |
0 |
|
0.17 |
-0.11 |
-0.03 |
-0.17 |
n.v. |
|
synaptogyrin-2 |
| 31560541 |
|
Syngr3 |
|
0 |
0 |
9 |
0 |
0 |
|
n.v. |
n.v. |
0.17 |
n.v. |
n.v. |
|
synaptogyrin-3 |
| 256773218 |
|
Synj1 |
|
0 |
0 |
0 |
1080 |
0 |
|
n.v. |
n.v. |
n.v. |
0.04 |
n.v. |
|
synaptojanin-1 isoform b |
| 256773220 |
|
Synj1 |
|
0 |
0 |
0 |
1080 |
0 |
|
n.v. |
n.v. |
n.v. |
0.04 |
n.v. |
|
synaptojanin-1 isoform a |
| 13384642 |
|
Synj2bp |
|
7798 |
6260 |
89 |
0 |
0 |
|
-0.07 |
-0.13 |
-0.16 |
n.v. |
n.v. |
|
synaptojanin-2-binding protein |
| 169234726 |
|
Synrg |
|
0 |
0 |
0 |
0 |
8278 |
|
n.v. |
n.v. |
n.v. |
n.v. |
0.32 |
|
synergin gamma isoform 1 |
| 34996507 |
|
Synrg |
|
0 |
0 |
0 |
0 |
7786 |
|
n.v. |
n.v. |
n.v. |
n.v. |
0.35 |
|
synergin gamma isoform 2 |
| 226958374 |
|
Sypl |
|
17025 |
403 |
16562 |
663 |
0 |
|
0.12 |
0.05 |
-0.04 |
-0.36 |
n.v. |
|
synaptophysin-like protein 1 isoform 1 |
| 41282044 |
|
Sypl |
|
17025 |
668 |
17939 |
663 |
0 |
|
0.12 |
0.17 |
-0.04 |
-0.36 |
n.v. |
|
synaptophysin-like protein 1 isoform 2 |
| 258547102 |
|
Syvn1 |
|
0 |
0 |
1232 |
0 |
0 |
|
n.v. |
n.v. |
-0.29 |
n.v. |
n.v. |
|
E3 ubiquitin-protein ligase synoviolin precursor |
| 33239391 |
|
Szrd1 |
|
0 |
0 |
0 |
0 |
332 |
|
n.v. |
n.v. |
n.v. |
n.v. |
-0.15 |
|
SUZ domain-containing protein 1 isoform 2 |
| 71043934 |
|
Szrd1 |
|
0 |
0 |
0 |
0 |
332 |
|
n.v. |
n.v. |
n.v. |
n.v. |
-0.15 |
|
SUZ domain-containing protein 1 isoform 1 |
| 34328268 |
|
Tab1 |
|
0 |
0 |
183 |
0 |
5762 |
|
n.v. |
n.v. |
-0.04 |
n.v. |
-0.24 |
|
TGF-beta-activated kinase 1 and MAP3K7-binding protein
1 |
| 6678207 |
|
Tac1 |
|
2947 |
0 |
0 |
0 |
0 |
|
-0.03 |
n.v. |
n.v. |
n.v. |
n.v. |
|
protachykinin-1 precursor |
| 52486864 |
|
Tacc2 |
|
0 |
0 |
0 |
0 |
150 |
|
n.v. |
n.v. |
n.v. |
n.v. |
0.01 |
|
transforming acidic coiled-coil-containing protein 2
isoform b |
| 52486915 |
|
Tacc2 |
|
0 |
0 |
0 |
0 |
150 |
|
n.v. |
n.v. |
n.v. |
n.v. |
0.01 |
|
transforming acidic coiled-coil-containing protein 2
isoform a |
| 52486843 |
|
Tacc2 |
|
0 |
0 |
20 |
0 |
8718 |
|
n.v. |
n.v. |
0.82 |
n.v. |
0.19 |
|
transforming acidic coiled-coil-containing protein 2
isoform c |
| 94681040 |
|
Tacc3 |
|
0 |
0 |
0 |
0 |
514 |
|
n.v. |
n.v. |
n.v. |
n.v. |
0.94 |
|
transforming acidic coiled-coil-containing protein 3 |
| 39930435 |
|
Taco1 |
|
0 |
860 |
0 |
0 |
0 |
|
n.v. |
-0.18 |
n.v. |
n.v. |
n.v. |
|
translational activator of cytochrome c oxidase 1 |
| 31560359 |
|
Tacstd2 |
|
0 |
5985 |
19164 |
0 |
0 |
|
n.v. |
0.25 |
0.07 |
n.v. |
n.v. |
|
tumor-associated calcium signal transducer 2 precursor |
| 30794436 |
|
Taf11 |
|
0 |
0 |
0 |
139 |
0 |
|
n.v. |
n.v. |
n.v. |
3.37 |
n.v. |
|
transcription initiation factor TFIID subunit 11 |
| 30794412 |
|
Taf15 |
|
51477 |
6206 |
11478 |
1498 |
278 |
|
-0.17 |
0.11 |
0.03 |
0.03 |
-0.28 |
|
TATA-binding protein-associated factor 2N |
| 295317363 |
|
Taf6l |
|
0 |
0 |
12 |
1080 |
0 |
|
n.v. |
n.v. |
-0.11 |
-0.17 |
n.v. |
|
TAF6-like RNA polymerase II p300/CBP-associated
factor-associated factor 65 kDa subunit 6L isoform
1 |
| 295317365 |
|
Taf6l |
|
0 |
0 |
12 |
884 |
0 |
|
n.v. |
n.v. |
-0.11 |
0.3 |
n.v. |
|
TAF6-like RNA polymerase II p300/CBP-associated
factor-associated factor 65 kDa subunit 6L isoform
2 |
| 283046765 |
|
Taf7l |
|
0 |
0 |
111 |
3233 |
0 |
|
n.v. |
n.v. |
-0.07 |
-0.19 |
n.v. |
|
transcription initiation factor TFIID subunit 7-like |
| 30519911 |
|
Tagln2 |
|
41189 |
10283 |
23855 |
311 |
347256 |
|
0.15 |
0.3 |
0.04 |
0.18 |
0.06 |
|
transgelin-2 |
| 9790125 |
|
Tagln3 |
|
0 |
8 |
2144 |
0 |
18688 |
|
n.v. |
-0.55 |
0.12 |
n.v. |
0.01 |
|
transgelin-3 |
| 33859640 |
|
Taldo1 |
|
31816 |
20000 |
26687 |
36025 |
631357 |
|
0.19 |
0.08 |
0.01 |
0.07 |
0.01 |
|
transaldolase |
| 76559944 |
|
Tamm41 |
|
0 |
157 |
0 |
0 |
0 |
|
n.v. |
0.99 |
n.v. |
n.v. |
n.v. |
|
mitochondrial translocator assembly and maintenance
protein 41 homolog precursor |
| 57164407 |
|
Tanc1 |
|
18 |
0 |
160 |
156 |
0 |
|
4.15 |
n.v. |
-0.14 |
-1.71 |
n.v. |
|
protein TANC1 |
| 124378026 |
|
Tanc2 |
|
0 |
528 |
0 |
982 |
0 |
|
n.v. |
0.21 |
n.v. |
0.1 |
n.v. |
|
protein TANC2 |
| 255918143 |
|
Tango2 |
|
0 |
0 |
0 |
0 |
867 |
|
n.v. |
n.v. |
n.v. |
n.v. |
0.02 |
|
ser/Thr-rich protein T10 in DGCR region |
| 124358959 |
|
Taok1 |
|
0 |
814 |
2992 |
0 |
0 |
|
n.v. |
0.2 |
-0.01 |
n.v. |
n.v. |
|
serine/threonine-protein kinase TAO1 |
| 255003682 |
|
Taok2 |
|
6499 |
0 |
0 |
0 |
0 |
|
0.13 |
n.v. |
n.v. |
n.v. |
n.v. |
|
serine/threonine-protein kinase TAO2 isoform 1 |
| 124486801 |
|
Taok3 |
|
0 |
328 |
3287 |
0 |
2099 |
|
n.v. |
0.2 |
0 |
n.v. |
-0.81 |
|
serine/threonine-protein kinase TAO3 |
| 6678219 |
|
Tapbp |
|
915 |
528 |
416 |
229 |
0 |
|
-0.04 |
-0.05 |
-0.28 |
-0.35 |
n.v. |
|
tapasin isoform 2 precursor |
| 70778974 |
|
Tapbp |
|
915 |
528 |
416 |
229 |
0 |
|
-0.04 |
-0.05 |
-0.28 |
-0.35 |
n.v. |
|
tapasin isoform 1 precursor |
| 71143116 |
|
Tapt1 |
|
0 |
15 |
0 |
0 |
0 |
|
n.v. |
0.03 |
n.v. |
n.v. |
n.v. |
|
transmembrane anterior posterior transformation protein 1 |
| 166295185 |
|
Tarbp2 |
|
0 |
0 |
0 |
0 |
2560 |
|
n.v. |
n.v. |
n.v. |
n.v. |
-0.08 |
|
RISC-loading complex subunit TARBP2 isoform 1 |
| 21704096 |
|
Tardbp |
|
342469 |
6290 |
18966 |
11255 |
1210 |
|
-0.11 |
-0.13 |
0 |
-0.23 |
-0.39 |
|
TAR DNA-binding protein 43 isoform 1 |
| 56682929 |
|
Tardbp |
|
273675 |
6793 |
14342 |
11255 |
1210 |
|
-0.15 |
-0.15 |
0.01 |
-0.23 |
-0.39 |
|
TAR DNA-binding protein 43 isoform 2 |
| 56682931 |
|
Tardbp |
|
273675 |
6793 |
14342 |
11255 |
1210 |
|
-0.15 |
-0.15 |
0.01 |
-0.23 |
-0.39 |
|
TAR DNA-binding protein 43 isoform 3 |
| 56682933 |
|
Tardbp |
|
273675 |
6793 |
14342 |
11255 |
1210 |
|
-0.15 |
-0.15 |
0.01 |
-0.23 |
-0.39 |
|
TAR DNA-binding protein 43 isoform 4 |
| 56682935 |
|
Tardbp |
|
273675 |
6793 |
14342 |
11255 |
1210 |
|
-0.15 |
-0.15 |
0.01 |
-0.23 |
-0.39 |
|
TAR DNA-binding protein 43 isoform 5 |
| 27229277 |
|
Tars |
|
0 |
6012 |
13673 |
124249 |
85301 |
|
n.v. |
0.19 |
0.07 |
0.2 |
0.01 |
|
threonine--tRNA ligase, cytoplasmic |
| 254692865 |
|
Tars2 |
|
3606 |
4332 |
13 |
0 |
0 |
|
-0.33 |
-0.22 |
-1.53 |
n.v. |
n.v. |
|
threonine--tRNA ligase, mitochondrial isoform 1 |
| 254692867 |
|
Tars2 |
|
769 |
3409 |
13 |
0 |
0 |
|
0.01 |
-0.23 |
-1.53 |
n.v. |
n.v. |
|
threonine--tRNA ligase, mitochondrial isoform 2 |
| 254692871 |
|
Tars2 |
|
3606 |
2161 |
13 |
0 |
0 |
|
-0.33 |
-0.19 |
-1.53 |
n.v. |
n.v. |
|
threonine--tRNA ligase, mitochondrial isoform 3 |
| 254692873 |
|
Tars2 |
|
3606 |
4323 |
13 |
0 |
0 |
|
-0.33 |
-0.21 |
-1.53 |
n.v. |
n.v. |
|
threonine--tRNA ligase, mitochondrial isoform 4 |
| 227908819 |
|
Tarsl2 |
|
0 |
0 |
1299 |
3389 |
11213 |
|
n.v. |
n.v. |
-0.07 |
-1.62 |
0.01 |
|
probable threonine--tRNA ligase 2, cytoplasmic |
| 13994201 |
|
Tas1r3 |
|
0 |
0 |
0 |
1146 |
0 |
|
n.v. |
n.v. |
n.v. |
0.45 |
n.v. |
|
taste receptor type 1 member 3 precursor |
| 30424744 |
|
Tatdn1 |
|
0 |
0 |
0 |
0 |
5644 |
|
n.v. |
n.v. |
n.v. |
n.v. |
0.14 |
|
putative deoxyribonuclease TATDN1 |
| 256773241 |
|
Tax1bp1 |
|
0 |
0 |
0 |
1261 |
0 |
|
n.v. |
n.v. |
n.v. |
-0.09 |
n.v. |
|
tax1-binding protein 1 homolog |
| 21313140 |
|
Tax1bp3 |
|
9336 |
726 |
1831 |
966 |
1039 |
|
-0.07 |
0.11 |
-0.04 |
0.11 |
0.02 |
|
tax1-binding protein 3 |
| 120587003 |
|
Tbc1d1 |
|
0 |
365 |
521 |
13261 |
9564 |
|
n.v. |
0.59 |
-0.02 |
0.23 |
0.3 |
|
TBC1 domain family member 1 |
| 19527240 |
|
Tbc1d10a |
|
0 |
0 |
14360 |
1261 |
2003 |
|
n.v. |
n.v. |
-0.19 |
-0.34 |
0.16 |
|
TBC1 domain family member 10A |
| 167614490 |
|
Tbc1d10b |
|
0 |
0 |
32 |
0 |
0 |
|
n.v. |
n.v. |
-0.39 |
n.v. |
n.v. |
|
TBC1 domain family member 10B |
| 22122839 |
|
Tbc1d13 |
|
0 |
0 |
64 |
0 |
1938 |
|
n.v. |
n.v. |
-0.27 |
n.v. |
-0.05 |
|
TBC1 domain family member 13 |
| 255958202 |
|
Tbc1d15 |
|
0 |
1269 |
1551 |
17664 |
20016 |
|
n.v. |
0.24 |
-0.02 |
0.24 |
0.18 |
|
TBC1 domain family member 15 |
| 111120337 |
|
Tbc1d17 |
|
0 |
165 |
265 |
8587 |
1906 |
|
n.v. |
0.15 |
-0.32 |
0.03 |
0.39 |
|
TBC1 domain family member 17 |
| 111038126 |
|
Tbc1d2 |
|
0 |
0 |
133 |
2259 |
9821 |
|
n.v. |
n.v. |
0.14 |
0.3 |
0.06 |
|
TBC1 domain family member 2A |
| 42734463 |
|
Tbc1d22a |
|
0 |
0 |
219 |
467 |
0 |
|
n.v. |
n.v. |
0.71 |
0.73 |
n.v. |
|
TBC1 domain family member 22A |
| 38348532 |
|
Tbc1d22b |
|
0 |
0 |
51 |
0 |
0 |
|
n.v. |
n.v. |
0.01 |
n.v. |
n.v. |
|
TBC1 domain family member 22B |
| 27754079 |
|
Tbc1d23 |
|
0 |
0 |
528 |
6131 |
5333 |
|
n.v. |
n.v. |
-0.19 |
-0.25 |
-0.44 |
|
TBC1 domain family member 23 |
| 255522819 |
|
Tbc1d24 |
|
0 |
0 |
0 |
0 |
396 |
|
n.v. |
n.v. |
n.v. |
n.v. |
0.24 |
|
TBC1 domain family member 24 isoform a |
| 255522825 |
|
Tbc1d24 |
|
0 |
0 |
0 |
0 |
396 |
|
n.v. |
n.v. |
n.v. |
n.v. |
0.24 |
|
TBC1 domain family member 24 isoform b |
| 163644270 |
|
Tbc1d4 |
|
348 |
0 |
320 |
24925 |
7400 |
|
0.21 |
n.v. |
0.14 |
0.09 |
0.09 |
|
TBC1 domain family member 4 |
| 164518898 |
|
Tbc1d5 |
|
0 |
0 |
2381 |
2464 |
0 |
|
n.v. |
n.v. |
0.1 |
-0.94 |
n.v. |
|
TBC1 domain family member 5 |
| 125630636 |
|
Tbc1d8b |
|
0 |
0 |
0 |
0 |
3631 |
|
n.v. |
n.v. |
n.v. |
n.v. |
0.12 |
|
TBC1 domain family member 8B |
| 162329599 |
|
Tbc1d9 |
|
0 |
0 |
18 |
0 |
0 |
|
n.v. |
n.v. |
-0.04 |
n.v. |
n.v. |
|
TBC1 domain family member 9 isoform 1 |
| 30794404 |
|
Tbc1d9 |
|
0 |
0 |
18 |
0 |
0 |
|
n.v. |
n.v. |
-0.04 |
n.v. |
n.v. |
|
TBC1 domain family member 9 isoform 2 |
| 124358940 |
|
Tbc1d9b |
|
0 |
29 |
881 |
3037 |
8300 |
|
n.v. |
0.15 |
0.2 |
-0.12 |
-0.01 |
|
TBC1 domain family member 9B |
| 6678225 |
|
Tbca |
|
0 |
0 |
135 |
0 |
66560 |
|
n.v. |
n.v. |
0.33 |
n.v. |
0.19 |
|
tubulin-specific chaperone A |
| 170650659 |
|
Tbcb |
|
0 |
157 |
183 |
0 |
37387 |
|
n.v. |
0.36 |
-0.26 |
n.v. |
0.06 |
|
tubulin-folding cofactor B |
| 87044901 |
|
Tbcc |
|
0 |
0 |
173 |
0 |
56386 |
|
n.v. |
n.v. |
-0.32 |
n.v. |
0.02 |
|
tubulin-specific chaperone C |
| 28077067 |
|
Tbcd |
|
0 |
0 |
3442 |
15217 |
88300 |
|
n.v. |
n.v. |
0 |
0.16 |
0.13 |
|
tubulin-specific chaperone D |
| 31543843 |
|
Tbce |
|
0 |
0 |
0 |
0 |
10313 |
|
n.v. |
n.v. |
n.v. |
n.v. |
0.09 |
|
tubulin-specific chaperone E |
| 27370562 |
|
Tbcel |
|
0 |
29 |
22 |
0 |
2517 |
|
n.v. |
-0.51 |
0.14 |
n.v. |
0.36 |
|
tubulin-specific chaperone cofactor E-like protein |
| 251823839 |
|
Tbk1 |
|
0 |
150 |
73 |
0 |
996 |
|
n.v. |
0.39 |
-0.63 |
n.v. |
-0.17 |
|
serine/threonine-protein kinase TBK1 |
| 33468969 |
|
Tbl1x |
|
0 |
466 |
505 |
11738 |
8129 |
|
n.v. |
0.62 |
-0.09 |
0.05 |
-0.16 |
|
F-box-like/WD repeat-containing protein TBL1X |
| 31543001 |
|
Tbl1xr1 |
|
0 |
466 |
680 |
16003 |
11395 |
|
n.v. |
0.15 |
-0.08 |
0.08 |
-0.16 |
|
F-box-like/WD repeat-containing protein TBL1XR1 |
| 31543845 |
|
Tbl2 |
|
5657 |
7876 |
2012 |
0 |
0 |
|
-0.05 |
-0.19 |
-0.39 |
n.v. |
n.v. |
|
transducin beta-like protein 2 precursor |
| 30102935 |
|
Tbl3 |
|
7231 |
50 |
19 |
704 |
0 |
|
-0.67 |
-0.05 |
0.25 |
-0.01 |
n.v. |
|
transducin beta-like protein 3 |
| 172073171 |
|
Tbp |
|
37 |
0 |
6 |
0 |
0 |
|
-0.44 |
n.v. |
0.85 |
n.v. |
n.v. |
|
TATA-box-binding protein |
| 6755811 |
|
Tbpl1 |
|
0 |
397 |
483 |
360 |
6790 |
|
n.v. |
0.07 |
0.02 |
-0.11 |
-0.1 |
|
TATA box-binding protein-like protein 1 |
| 39979630 |
|
Tbpl2 |
|
0 |
0 |
6 |
0 |
0 |
|
n.v. |
n.v. |
0.85 |
n.v. |
n.v. |
|
TATA box-binding protein-like protein 2 |
| 20589521 |
|
Tbrg4 |
|
1611 |
4108 |
414 |
0 |
0 |
|
-0.16 |
-0.25 |
-0.14 |
n.v. |
n.v. |
|
protein TBRG4 |
| 229094709 |
|
Tcea1 |
|
0 |
2534 |
8192 |
20955 |
134747 |
|
n.v. |
0.25 |
0 |
0.07 |
0.04 |
|
transcription elongation factor A protein 1 isoform 3 |
| 229094714 |
|
Tcea1 |
|
0 |
2227 |
7388 |
20186 |
120214 |
|
n.v. |
0.24 |
0 |
0.07 |
0.06 |
|
transcription elongation factor A protein 1 isoform 1 |
| 6755728 |
|
Tcea1 |
|
0 |
2534 |
8192 |
20669 |
134747 |
|
n.v. |
0.25 |
0 |
0.06 |
0.04 |
|
transcription elongation factor A protein 1 isoform 2 |
| 6678235 |
|
Tcea2 |
|
0 |
6 |
399 |
262 |
343 |
|
n.v. |
0.12 |
-0.01 |
0.14 |
-0.04 |
|
transcription elongation factor A protein 2 |
| 13385800 |
|
Tceb2 |
|
1611 |
2158 |
7219 |
7130 |
57189 |
|
0.19 |
0.2 |
0.1 |
0.15 |
0.02 |
|
transcription elongation factor B polypeptide 2 |
| 87196334 |
|
Tcerg1 |
|
1428 |
38 |
102 |
0 |
0 |
|
0 |
0.57 |
-0.05 |
n.v. |
n.v. |
|
transcription elongation regulator 1 |
| 209863008 |
|
Tcirg1 |
|
1062 |
5647 |
2817 |
0 |
0 |
|
0.33 |
-0.05 |
-0.03 |
n.v. |
n.v. |
|
T-cell, immune regulator 1 |
| 312176443 |
|
Tcof1 |
|
0 |
2434 |
360 |
0 |
0 |
|
n.v. |
-0.18 |
-0.33 |
n.v. |
n.v. |
|
treacle protein isoform 1 |
| 6755742 |
|
Tcof1 |
|
0 |
2434 |
360 |
0 |
0 |
|
n.v. |
-0.18 |
-0.33 |
n.v. |
n.v. |
|
treacle protein isoform 2 |
| 110625624 |
|
Tcp1 |
|
6279 |
21178 |
71612 |
1612515 |
14340 |
|
-0.33 |
0.07 |
0 |
0.03 |
-0.03 |
|
T-complex protein 1 subunit alpha |
| 28893201 |
|
Tcp11l1 |
|
0 |
0 |
16 |
0 |
696 |
|
n.v. |
n.v. |
0.36 |
n.v. |
0.63 |
|
T-complex protein 11-like protein 1 |
| 166706899 |
|
Tdg |
|
0 |
0 |
290 |
0 |
0 |
|
n.v. |
n.v. |
0.01 |
n.v. |
n.v. |
|
G/T mismatch-specific thymine DNA glycosylase isoform
2 |
| 166706901 |
|
Tdg |
|
0 |
0 |
290 |
0 |
0 |
|
n.v. |
n.v. |
0.01 |
n.v. |
n.v. |
|
G/T mismatch-specific thymine DNA glycosylase isoform
1 |
| 162417986 |
|
Tdp1 |
|
0 |
0 |
53 |
647 |
0 |
|
n.v. |
n.v. |
0.08 |
0.5 |
n.v. |
|
tyrosyl-DNA phosphodiesterase 1 |
| 9507213 |
|
Tdp2 |
|
0 |
104 |
0 |
0 |
54 |
|
n.v. |
0.15 |
n.v. |
n.v. |
-0.4 |
|
tyrosyl-DNA phosphodiesterase 2 |
| 225703112 |
|
Tdrd3 |
|
0 |
0 |
5353 |
0 |
0 |
|
n.v. |
n.v. |
0.16 |
n.v. |
n.v. |
|
tudor domain-containing protein 3 isoform 1 |
| 359279950 |
|
Tdrd3 |
|
0 |
0 |
5353 |
0 |
0 |
|
n.v. |
n.v. |
0.16 |
n.v. |
n.v. |
|
tudor domain-containing protein 3 isoform 2 |
| 124249058 |
|
Tecpr1 |
|
0 |
58 |
22 |
0 |
942 |
|
n.v. |
0.07 |
0.04 |
n.v. |
-0.36 |
|
tectonin beta-propeller repeat-containing protein 1 |
| 19923070 |
|
Tecr |
|
18599 |
11452 |
6570 |
1293 |
0 |
|
0.05 |
-0.28 |
-0.27 |
-0.56 |
n.v. |
|
very-long-chain enoyl-CoA reductase isoform 1 |
| 226342960 |
|
Tecr |
|
18599 |
11452 |
6570 |
1293 |
0 |
|
0.05 |
-0.28 |
-0.27 |
-0.56 |
n.v. |
|
very-long-chain enoyl-CoA reductase isoform 2 |
| 134053922 |
|
Tefm |
|
0 |
2962 |
0 |
0 |
0 |
|
n.v. |
-0.21 |
n.v. |
n.v. |
n.v. |
|
transcription elongation factor, mitochondrial |
| 117956379 |
|
Tekt1 |
|
5473 |
0 |
1826 |
0 |
0 |
|
-0.06 |
n.v. |
-0.04 |
n.v. |
n.v. |
|
tektin-1 |
| 255683437 |
|
Telo2 |
|
0 |
0 |
0 |
7817 |
0 |
|
n.v. |
n.v. |
n.v. |
-2.65 |
n.v. |
|
telomere length regulation protein TEL2 homolog |
| 254675210 |
|
Ten1 |
|
0 |
0 |
186 |
2022 |
3170 |
|
n.v. |
n.v. |
-0.81 |
0.31 |
0.1 |
|
CST complex subunit TEN1 |
| 119372288 |
|
Tenc1 |
|
0 |
240 |
357 |
0 |
7015 |
|
n.v. |
-0.61 |
0.15 |
n.v. |
-0.12 |
|
tensin-like C1 domain-containing phosphatase |
| 7657413 |
|
Tenm1 |
|
0 |
0 |
148 |
0 |
0 |
|
n.v. |
n.v. |
0.21 |
n.v. |
n.v. |
|
teneurin-1 |
| 6678285 |
|
Tep1 |
|
0 |
0 |
0 |
57 |
0 |
|
n.v. |
n.v. |
n.v. |
0.58 |
n.v. |
|
telomerase protein component 1 |
| 133904140 |
|
Terf2 |
|
330 |
0 |
0 |
0 |
0 |
|
-0.02 |
n.v. |
n.v. |
n.v. |
n.v. |
|
telomeric repeat-binding factor 2 isoform 2 |
| 133904142 |
|
Terf2 |
|
330 |
0 |
0 |
0 |
0 |
|
-0.02 |
n.v. |
n.v. |
n.v. |
n.v. |
|
telomeric repeat-binding factor 2 isoform 1 |
| 6678291 |
|
Tert |
|
1959 |
0 |
0 |
917 |
0 |
|
-0.09 |
n.v. |
n.v. |
-0.12 |
n.v. |
|
telomerase reverse transcriptase |
| 46395466 |
|
Tes |
|
0 |
1998 |
686 |
0 |
51491 |
|
n.v. |
0.22 |
0.02 |
n.v. |
0.14 |
|
testin |
| 124249335 |
|
Tex10 |
|
549 |
0 |
250 |
1523 |
0 |
|
-0.13 |
n.v. |
-0.42 |
0.13 |
n.v. |
|
testis-expressed sequence 10 protein |
| 125347370 |
|
Tex13a |
|
0 |
0 |
160 |
0 |
0 |
|
n.v. |
n.v. |
0.08 |
n.v. |
n.v. |
|
testis-expressed sequence 13A protein |
| 126090850 |
|
Tex264 |
|
0 |
0 |
42 |
0 |
0 |
|
n.v. |
n.v. |
-0.54 |
n.v. |
n.v. |
|
testis expressed gene 264 |
| 198278417 |
|
Tex30 |
|
0 |
0 |
672 |
213 |
0 |
|
n.v. |
n.v. |
0.02 |
0.94 |
n.v. |
|
testis-expressed sequence 30 protein |
| 6678303 |
|
Tfam |
|
2856 |
3198 |
0 |
0 |
0 |
|
-0.12 |
-0.39 |
n.v. |
n.v. |
n.v. |
|
transcription factor A, mitochondrial precursor |
| 22122569 |
|
Tfb1m |
|
0 |
207 |
0 |
0 |
0 |
|
n.v. |
-0.68 |
n.v. |
n.v. |
n.v. |
|
dimethyladenosine transferase 1, mitochondrial |
| 15628025 |
|
Tfcp2 |
|
0 |
923 |
73 |
2005 |
0 |
|
n.v. |
0.05 |
0.14 |
0.15 |
n.v. |
|
alpha-globin transcription factor CP2 |
| 239835744 |
|
Tfeb |
|
1428 |
0 |
0 |
0 |
0 |
|
-0.01 |
n.v. |
n.v. |
n.v. |
n.v. |
|
transcription factor EB isoform a |
| 239835746 |
|
Tfeb |
|
1428 |
0 |
0 |
0 |
0 |
|
-0.01 |
n.v. |
n.v. |
n.v. |
n.v. |
|
transcription factor EB isoform b |
| 356995942 |
|
Tfg |
|
0 |
814 |
2729 |
9667 |
51909 |
|
n.v. |
0.06 |
0.16 |
0.18 |
0.07 |
|
protein TFG isoform 2 |
| 9790261 |
|
Tfg |
|
0 |
814 |
2729 |
9667 |
51909 |
|
n.v. |
0.06 |
0.16 |
0.18 |
0.07 |
|
protein TFG isoform 1 |
| 10190660 |
|
Tfip11 |
|
0 |
63 |
843 |
467 |
0 |
|
n.v. |
0.92 |
-0.43 |
-0.14 |
n.v. |
|
tuftelin-interacting protein 11 |
| 11596855 |
|
Tfrc |
|
4558 |
4605 |
24006 |
15855 |
0 |
|
-0.07 |
0.02 |
0.17 |
-0.17 |
n.v. |
|
transferrin receptor protein 1 |
| 6678329 |
|
Tgm2 |
|
0 |
25 |
3494 |
213 |
47240 |
|
n.v. |
0.16 |
-0.17 |
0.17 |
-0.07 |
|
protein-glutamine gamma-glutamyltransferase 2 |
| 227496324 |
|
Tgs1 |
|
0 |
0 |
0 |
0 |
193 |
|
n.v. |
n.v. |
n.v. |
n.v. |
0.07 |
|
trimethylguanosine synthase |
| 241982820 |
|
Thada |
|
0 |
6 |
94 |
1727 |
353 |
|
n.v. |
0.78 |
0.15 |
0.34 |
0.24 |
|
thyroid adenoma-associated protein homolog |
| 47059073 |
|
Thbs1 |
|
0 |
432 |
398 |
0 |
2238 |
|
n.v. |
0.4 |
-0.13 |
n.v. |
0.16 |
|
thrombospondin-1 precursor |
| 29243946 |
|
Thnsl1 |
|
0 |
720 |
0 |
0 |
0 |
|
n.v. |
-0.21 |
n.v. |
n.v. |
n.v. |
|
threonine synthase-like 1 isoform a |
| 47604972 |
|
Thnsl1 |
|
0 |
230 |
0 |
0 |
0 |
|
n.v. |
-0.3 |
n.v. |
n.v. |
n.v. |
|
threonine synthase-like 1 isoform b |
| 23956332 |
|
Thoc1 |
|
0 |
0 |
329 |
0 |
0 |
|
n.v. |
n.v. |
-0.36 |
n.v. |
n.v. |
|
THO complex subunit 1 |
| 125656163 |
|
Thoc2 |
|
4796 |
0 |
13 |
0 |
0 |
|
-0.16 |
n.v. |
-0.42 |
n.v. |
n.v. |
|
THO complex subunit 2 |
| 254553424 |
|
Thoc3 |
|
0 |
0 |
45 |
0 |
578 |
|
n.v. |
n.v. |
-0.02 |
n.v. |
-0.04 |
|
THO complex subunit 3 |
| 56605680 |
|
Thoc6 |
|
439 |
0 |
98 |
1130 |
225 |
|
-0.05 |
n.v. |
2.6 |
-0.16 |
0.58 |
|
THO complex subunit 6 homolog |
| 239916005 |
|
Thop1 |
|
3039 |
5933 |
12282 |
7359 |
115609 |
|
0.37 |
0.35 |
0.07 |
0.34 |
0.07 |
|
thimet oligopeptidase |
| 68533246 |
|
Thrap3 |
|
20741 |
1528 |
620 |
9372 |
0 |
|
0.28 |
-0.27 |
-0.14 |
-0.1 |
n.v. |
|
thyroid hormone receptor-associated protein 3 |
| 23346499 |
|
Thtpa |
|
0 |
0 |
0 |
0 |
15850 |
|
n.v. |
n.v. |
n.v. |
n.v. |
0.25 |
|
thiamine-triphosphatase |
| 21704176 |
|
Thumpd1 |
|
0 |
357 |
183 |
0 |
32942 |
|
n.v. |
0.42 |
0 |
n.v. |
0.08 |
|
THUMP domain-containing protein 1 |
| 6680129 |
|
Thumpd3 |
|
0 |
221 |
190 |
2783 |
10056 |
|
n.v. |
0.16 |
0.25 |
0.36 |
0.24 |
|
THUMP domain-containing protein 3 |
| 21362343 |
|
Thyn1 |
|
0 |
0 |
44 |
1080 |
0 |
|
n.v. |
n.v. |
-0.49 |
0.11 |
n.v. |
|
thymocyte nuclear protein 1 |
| 255760009 |
|
Tia1 |
|
2709 |
236 |
1023 |
3479 |
1499 |
|
-0.44 |
-0.07 |
0.04 |
-0.08 |
0.51 |
|
nucleolysin TIA-1 isoform 2 |
| 255760011 |
|
Tia1 |
|
2709 |
236 |
1023 |
3479 |
1499 |
|
-0.44 |
-0.07 |
0.04 |
-0.08 |
0.51 |
|
nucleolysin TIA-1 isoform 3 |
| 6755783 |
|
Tia1 |
|
2709 |
236 |
1023 |
3479 |
1499 |
|
-0.44 |
-0.07 |
0.04 |
-0.08 |
0.51 |
|
nucleolysin TIA-1 isoform 1 |
| 6678349 |
|
Tial1 |
|
2709 |
236 |
2371 |
3962 |
5890 |
|
-0.44 |
-0.07 |
0.07 |
0.01 |
0.36 |
|
nucleolysin TIAR |
| 21553067 |
|
Tifa |
|
0 |
0 |
0 |
0 |
118 |
|
n.v. |
n.v. |
n.v. |
n.v. |
0.56 |
|
TRAF-interacting protein with FHA domain-containing
protein A |
| 209862977 |
|
Timeless |
|
0 |
958 |
2055 |
32456 |
30811 |
|
n.v. |
0.11 |
0.03 |
0.08 |
0.03 |
|
protein timeless homolog isoform 1 |
| 255760015 |
|
Timeless |
|
0 |
958 |
2055 |
32456 |
30811 |
|
n.v. |
0.11 |
0.03 |
0.08 |
0.03 |
|
protein timeless homolog isoform 3 |
| 6755789 |
|
Timeless |
|
0 |
958 |
2055 |
32456 |
30811 |
|
n.v. |
0.11 |
0.03 |
0.08 |
0.03 |
|
protein timeless homolog isoform 2 |
| 158937240 |
|
Timm10 |
|
0 |
336 |
0 |
0 |
0 |
|
n.v. |
-0.26 |
n.v. |
n.v. |
n.v. |
|
mitochondrial import inner membrane translocase subunit
Tim10 |
| 9507187 |
|
Timm10b |
|
0 |
935 |
0 |
0 |
0 |
|
n.v. |
-0.12 |
n.v. |
n.v. |
n.v. |
|
mitochondrial import inner membrane translocase subunit
Tim9 B |
| 7305581 |
|
Timm13 |
|
1794 |
2236 |
47 |
0 |
386 |
|
-0.01 |
-0.09 |
0.01 |
n.v. |
-0.58 |
|
mitochondrial import inner membrane translocase subunit
Tim13 |
| 33468937 |
|
Timm17b |
|
1428 |
144 |
0 |
0 |
0 |
|
0.02 |
-0.3 |
n.v. |
n.v. |
n.v. |
|
mitochondrial import inner membrane translocase subunit
Tim17-B |
| 21313128 |
|
Timm21 |
|
0 |
232 |
0 |
0 |
0 |
|
n.v. |
-0.13 |
n.v. |
n.v. |
n.v. |
|
mitochondrial import inner membrane translocase subunit
Tim21 |
| 296785067 |
|
Timm22 |
|
0 |
413 |
0 |
0 |
0 |
|
n.v. |
-0.05 |
n.v. |
n.v. |
n.v. |
|
mitochondrial import inner membrane translocase subunit
Tim22 isoform 2 |
| 31543865 |
|
Timm22 |
|
0 |
662 |
0 |
0 |
0 |
|
n.v. |
-0.36 |
n.v. |
n.v. |
n.v. |
|
mitochondrial import inner membrane translocase subunit
Tim22 isoform 1 |
| 254675168 |
|
Timm23 |
|
3478 |
541 |
222 |
0 |
0 |
|
-0.07 |
-0.38 |
-0.49 |
n.v. |
n.v. |
|
mitochondrial import inner membrane translocase subunit
Tim23 |
| 170763467 |
|
Timm44 |
|
27056 |
14009 |
146 |
286 |
0 |
|
0.07 |
0 |
-0.33 |
-0.93 |
n.v. |
|
mitochondrial import inner membrane translocase subunit
TIM44 |
| 22094989 |
|
Timm50 |
|
39687 |
11218 |
2385 |
0 |
0 |
|
-0.05 |
-0.08 |
-0.4 |
n.v. |
n.v. |
|
mitochondrial import inner membrane translocase subunit
TIM50 precursor |
| 7305577 |
|
Timm8a1 |
|
531 |
1200 |
9 |
0 |
1114 |
|
0.07 |
-0.1 |
-0.5 |
n.v. |
-0.25 |
|
mitochondrial import inner membrane translocase subunit
Tim8 A |
| 83627687 |
|
Timm8a2 |
|
531 |
787 |
9 |
0 |
268 |
|
0.07 |
-0.25 |
-0.5 |
n.v. |
-0.12 |
|
putative mitochondrial import inner membrane translocase
subunit Tim8 A-B |
| 7305579 |
|
Timm8b |
|
11844 |
969 |
205 |
0 |
921 |
|
0.01 |
-0.36 |
-0.24 |
n.v. |
-0.28 |
|
mitochondrial import inner membrane translocase subunit
Tim8 B |
| 67846099;7305573 |
|
Timm9 |
|
8494 |
0 |
0 |
0 |
0 |
|
0.05 |
n.v. |
n.v. |
n.v. |
n.v. |
|
mitochondrial import inner membrane translocase subunit
Tim9 |
| 7305573 |
|
Timm9 |
|
0 |
2532 |
221 |
0 |
0 |
|
n.v. |
0.06 |
-0.35 |
n.v. |
n.v. |
|
mitochondrial import inner membrane translocase subunit
Tim9 |
| 225543444 |
|
Timmdc1 |
|
0 |
2094 |
0 |
0 |
0 |
|
n.v. |
-0.2 |
n.v. |
n.v. |
n.v. |
|
translocase of inner mitochondrial membrane
domain-containing protein 1 |
| 31542102 |
|
Tiparp |
|
3442 |
0 |
506 |
5714 |
7614 |
|
-0.1 |
n.v. |
-0.14 |
0.11 |
0.1 |
|
TCDD-inducible poly [ADP-ribose] polymerase |
| 21313608 |
|
Tipin |
|
0 |
0 |
0 |
0 |
8439 |
|
n.v. |
n.v. |
n.v. |
n.v. |
-0.13 |
|
TIMELESS-interacting protein |
| 21704010 |
|
Tiprl |
|
0 |
367 |
337 |
450 |
4123 |
|
n.v. |
0.29 |
0.09 |
0.22 |
0.06 |
|
TIP41-like protein |
| 21311861 |
|
Tjap1 |
|
0 |
0 |
0 |
0 |
4027 |
|
n.v. |
n.v. |
n.v. |
n.v. |
-0.13 |
|
tight junction-associated protein 1 |
| 254675277 |
|
Tjp1 |
|
13052 |
438 |
628 |
2775 |
21269 |
|
0.04 |
0.41 |
-0.05 |
-0.52 |
0.04 |
|
tight junction protein ZO-1 isoform 1 |
| 254675279 |
|
Tjp1 |
|
13052 |
438 |
628 |
2775 |
21269 |
|
0.04 |
0.41 |
-0.05 |
-0.52 |
0.04 |
|
tight junction protein ZO-1 isoform 2 |
| 160333863 |
|
Tjp2 |
|
33573 |
4428 |
14842 |
48991 |
223207 |
|
0.25 |
0.2 |
0.01 |
0.07 |
-0.17 |
|
tight junction protein ZO-2 isoform 2 |
| 312222765 |
|
Tjp2 |
|
33573 |
4428 |
14842 |
48991 |
218849 |
|
0.25 |
0.2 |
0.01 |
0.07 |
-0.17 |
|
tight junction protein ZO-2 isoform 1 |
| 530788242 |
|
Tjp3 |
|
9849 |
0 |
0 |
0 |
0 |
|
-0.06 |
n.v. |
n.v. |
n.v. |
n.v. |
|
tight junction protein ZO-3 isoform 1 |
| 114052811 |
|
Tjp3 |
|
10709 |
61 |
3077 |
13703 |
6576 |
|
-0.03 |
0.19 |
-0.11 |
-0.15 |
-0.04 |
|
tight junction protein ZO-3 isoform 2 |
| 6678359 |
|
Tkt |
|
179527 |
53985 |
137851 |
714796 |
603727 |
|
0.17 |
0.2 |
0.04 |
0.19 |
0.03 |
|
transketolase |
| 148287022 |
|
Tktl2 |
|
0 |
0 |
348 |
0 |
0 |
|
n.v. |
n.v. |
-0.02 |
n.v. |
n.v. |
|
transketolase-like protein 2 |
| 409191601;148287022 |
|
Tktl2 |
|
0 |
0 |
0 |
16903 |
0 |
|
n.v. |
n.v. |
n.v. |
0.4 |
n.v. |
|
transketolase-like protein 2 |
| 21539617 |
|
Tlcd1 |
|
0 |
347 |
202 |
0 |
0 |
|
n.v. |
-0.17 |
-0.43 |
n.v. |
n.v. |
|
TLC domain-containing protein 1 precursor |
| 145207950 |
|
Tle3 |
|
0 |
0 |
0 |
0 |
1531 |
|
n.v. |
n.v. |
n.v. |
n.v. |
0.11 |
|
transducin-like enhancer protein 3 isoform 3 |
| 145207972 |
|
Tle3 |
|
0 |
0 |
0 |
0 |
1531 |
|
n.v. |
n.v. |
n.v. |
n.v. |
0.11 |
|
transducin-like enhancer protein 3 isoform 2 |
| 145207988 |
|
Tle3 |
|
0 |
0 |
0 |
0 |
1531 |
|
n.v. |
n.v. |
n.v. |
n.v. |
0.11 |
|
transducin-like enhancer protein 3 isoform 1 |
| 227116327 |
|
Tln1 |
|
183 |
22098 |
35184 |
106069 |
358576 |
|
0.49 |
0.26 |
0.17 |
0.2 |
-0.02 |
|
talin-1 |
| 163310736 |
|
Tln2 |
|
0 |
2791 |
7268 |
7359 |
56257 |
|
n.v. |
0.27 |
0.25 |
-0.15 |
-0.02 |
|
talin-2 |
| 45429999 |
|
Tlr13 |
|
0 |
0 |
31 |
0 |
0 |
|
n.v. |
n.v. |
0.63 |
n.v. |
n.v. |
|
toll-like receptor 13 precursor |
| 18875360 |
|
Tlr7 |
|
3661 |
668 |
5201 |
6917 |
17360 |
|
-0.03 |
0.19 |
-0.04 |
0.08 |
0.1 |
|
toll-like receptor 7 precursor |
| 229324850 |
|
Tm2d2 |
|
0 |
79 |
0 |
0 |
0 |
|
n.v. |
0.14 |
n.v. |
n.v. |
n.v. |
|
TM2 domain-containing protein 2 precursor |
| 119964708 |
|
Tm7sf3 |
|
0 |
0 |
148 |
0 |
0 |
|
n.v. |
n.v. |
-0.42 |
n.v. |
n.v. |
|
transmembrane 7 superfamily member 3 precursor |
| 27229185 |
|
Tm9sf1 |
|
0 |
3140 |
1737 |
0 |
0 |
|
n.v. |
-0.41 |
-0.42 |
n.v. |
n.v. |
|
transmembrane 9 superfamily member 1 precursor |
| 188528894 |
|
Tm9sf2 |
|
3387 |
8872 |
8780 |
172 |
0 |
|
0.26 |
0.01 |
-0.25 |
-0.34 |
n.v. |
|
transmembrane 9 superfamily member 2 precursor |
| 19111162 |
|
Tm9sf3 |
|
0 |
2737 |
1620 |
0 |
0 |
|
n.v. |
-0.01 |
-0.18 |
n.v. |
n.v. |
|
transmembrane 9 superfamily member 3 precursor |
| 31542095 |
|
Tm9sf4 |
|
0 |
2336 |
1147 |
0 |
0 |
|
n.v. |
-0.07 |
-0.44 |
n.v. |
n.v. |
|
transmembrane 9 superfamily member 4 precursor |
| 309264231 |
|
Tma7-ps |
|
732 |
0 |
375 |
229 |
6372 |
|
-0.04 |
n.v. |
0.06 |
0.13 |
-0.07 |
|
PREDICTED: coiled-coil domain-containing protein
72-like |
| 283945625 |
|
Tmbim6 |
|
1721 |
0 |
0 |
0 |
0 |
|
0.18 |
n.v. |
n.v. |
n.v. |
n.v. |
|
bax inhibitor 1 |
| 283945625;283945630 |
|
Tmbim6 |
|
0 |
0 |
1632 |
0 |
0 |
|
n.v. |
n.v. |
-0.38 |
n.v. |
n.v. |
|
bax inhibitor 1 |
| 283945630 |
|
Tmbim6 |
|
0 |
566 |
0 |
2775 |
0 |
|
n.v. |
-0.19 |
n.v. |
-0.25 |
n.v. |
|
bax inhibitor 1 |
| 31542282 |
|
Tmc7 |
|
0 |
0 |
133 |
0 |
0 |
|
n.v. |
n.v. |
0.01 |
n.v. |
n.v. |
|
transmembrane channel-like protein 7 |
| 87116677 |
|
Tmco1 |
|
7780 |
75 |
868 |
164 |
0 |
|
-0.06 |
0.13 |
-0.31 |
-0.04 |
n.v. |
|
transmembrane and coiled-coil domain-containing protein 1
precursor |
| 21313340 |
|
Tmco4 |
|
0 |
4 |
0 |
303 |
0 |
|
n.v. |
-1.92 |
n.v. |
0.38 |
n.v. |
|
transmembrane and coiled-coil domain-containing protein 4 |
| 112181164 |
|
Tmco6 |
|
0 |
0 |
0 |
2055 |
1446 |
|
n.v. |
n.v. |
n.v. |
0.01 |
0.09 |
|
transmembrane and coiled-coil domain-containing protein 6 |
| 85362703 |
|
Tmed1 |
|
0 |
1964 |
152 |
0 |
0 |
|
n.v. |
0.03 |
-0.16 |
n.v. |
n.v. |
|
transmembrane emp24 domain-containing protein 1 precursor |
| 21312062 |
|
Tmed10 |
|
181266 |
27413 |
19850 |
27512 |
0 |
|
-0.05 |
-0.01 |
-0.09 |
0.08 |
n.v. |
|
transmembrane emp24 domain-containing protein 10
precursor |
| 281427153 |
|
Tmed3 |
|
1025 |
695 |
856 |
295 |
0 |
|
0.32 |
-0.1 |
-0.11 |
0.42 |
n.v. |
|
transmembrane emp24 domain-containing protein 3 precursor |
| 19527236 |
|
Tmed4 |
|
61142 |
4263 |
5650 |
1228 |
0 |
|
-1.61 |
-0.18 |
-0.17 |
0.19 |
n.v. |
|
transmembrane emp24 domain-containing protein 4 precursor |
| 21746165 |
|
Tmed5 |
|
6352 |
760 |
1823 |
368 |
0 |
|
-0.14 |
-0.15 |
-0.04 |
0.47 |
n.v. |
|
transmembrane emp24 domain-containing protein 5 precursor |
| 255003819 |
|
Tmed7 |
|
47449 |
18387 |
8438 |
2300 |
0 |
|
-0.04 |
-0.09 |
-0.13 |
0.64 |
n.v. |
|
transmembrane emp24 protein transport domain containing 7
precursor |
| 145966911 |
|
Tmed9 |
|
49078 |
20441 |
18846 |
8341 |
0 |
|
-0.02 |
-0.06 |
-0.21 |
0.1 |
n.v. |
|
transmembrane emp24 domain-containing protein 9 precursor |
| 145966766 |
|
Tmem102 |
|
0 |
0 |
95 |
49 |
0 |
|
n.v. |
n.v. |
0.08 |
0.03 |
n.v. |
|
transmembrane protein 102 |
| 188035856 |
|
Tmem106b |
|
0 |
3785 |
3737 |
2169 |
0 |
|
n.v. |
-0.1 |
-0.06 |
-0.24 |
n.v. |
|
transmembrane protein 106B |
| 19527378 |
|
Tmem109 |
|
10270 |
7417 |
6263 |
2218 |
0 |
|
0.25 |
-0.11 |
-0.32 |
-0.46 |
n.v. |
|
transmembrane protein 109 precursor |
| 27734998 |
|
Tmem11 |
|
0 |
1269 |
0 |
0 |
0 |
|
n.v. |
-0.33 |
n.v. |
n.v. |
n.v. |
|
transmembrane protein 11, mitochondrial isoform 1 |
| 281182922 |
|
Tmem11 |
|
0 |
1269 |
0 |
0 |
0 |
|
n.v. |
-0.33 |
n.v. |
n.v. |
n.v. |
|
transmembrane protein 11, mitochondrial isoform 2 |
| 9790165 |
|
Tmem115 |
|
0 |
1808 |
0 |
0 |
0 |
|
n.v. |
-0.24 |
n.v. |
n.v. |
n.v. |
|
transmembrane protein 115 |
| 29789387 |
|
Tmem120a |
|
0 |
73 |
47 |
0 |
0 |
|
n.v. |
-0.27 |
-0.46 |
n.v. |
n.v. |
|
transmembrane protein 120A |
| 58037123 |
|
Tmem126b |
|
0 |
236 |
0 |
0 |
0 |
|
n.v. |
-0.84 |
n.v. |
n.v. |
n.v. |
|
transmembrane protein 126B |
| 21624623 |
|
Tmem138 |
|
0 |
121 |
0 |
0 |
0 |
|
n.v. |
-0.53 |
n.v. |
n.v. |
n.v. |
|
transmembrane protein 138 |
| 120952692 |
|
Tmem147 |
|
0 |
261 |
0 |
0 |
0 |
|
n.v. |
-0.06 |
n.v. |
n.v. |
n.v. |
|
transmembrane protein 147 |
| 13384766 |
|
Tmem14c |
|
0 |
4 |
173 |
0 |
0 |
|
n.v. |
-0.38 |
-0.44 |
n.v. |
n.v. |
|
transmembrane protein 14C |
| 58037143 |
|
Tmem160 |
|
0 |
182 |
0 |
0 |
0 |
|
n.v. |
-0.18 |
n.v. |
n.v. |
n.v. |
|
transmembrane protein 160 |
| 111154067 |
|
Tmem165 |
|
0 |
5367 |
1029 |
0 |
0 |
|
n.v. |
-0.1 |
-0.4 |
n.v. |
n.v. |
|
transmembrane protein 165 precursor |
| 225007607 |
|
Tmem167 |
|
1062 |
56 |
95 |
0 |
0 |
|
-0.28 |
-0.14 |
-0.14 |
n.v. |
n.v. |
|
protein kish-A precursor |
| 27532967 |
|
Tmem168 |
|
0 |
56 |
0 |
0 |
0 |
|
n.v. |
-0.49 |
n.v. |
n.v. |
n.v. |
|
transmembrane protein 168 |
| 254692993 |
|
Tmem173 |
|
0 |
0 |
136 |
0 |
0 |
|
n.v. |
n.v. |
-0.69 |
n.v. |
n.v. |
|
stimulator of interferon genes protein |
| 254587930 |
|
Tmem175 |
|
0 |
482 |
0 |
0 |
0 |
|
n.v. |
0.2 |
n.v. |
n.v. |
n.v. |
|
transmembrane protein 175 isoform 1 |
| 254587932 |
|
Tmem175 |
|
0 |
482 |
0 |
0 |
0 |
|
n.v. |
0.2 |
n.v. |
n.v. |
n.v. |
|
transmembrane protein 175 isoform 2 |
| 12746434 |
|
Tmem176b |
|
0 |
17 |
0 |
0 |
0 |
|
n.v. |
0.08 |
n.v. |
n.v. |
n.v. |
|
transmembrane protein 176B |
| 27228988 |
|
Tmem186 |
|
0 |
65 |
9 |
0 |
0 |
|
n.v. |
0.16 |
-0.26 |
n.v. |
n.v. |
|
transmembrane protein 186 |
| 21704060 |
|
Tmem189 |
|
805 |
0 |
0 |
0 |
0 |
|
0.16 |
n.v. |
n.v. |
n.v. |
n.v. |
|
transmembrane protein 189 |
| 19526846 |
|
Tmem19 |
|
0 |
518 |
0 |
0 |
0 |
|
n.v. |
0.39 |
n.v. |
n.v. |
n.v. |
|
transmembrane protein 19 |
| 254939603 |
|
Tmem192 |
|
0 |
547 |
23 |
0 |
0 |
|
n.v. |
0.26 |
-0.19 |
n.v. |
n.v. |
|
transmembrane protein 192 isoform 2 |
| 58037311 |
|
Tmem192 |
|
0 |
547 |
23 |
0 |
0 |
|
n.v. |
0.26 |
-0.19 |
n.v. |
n.v. |
|
transmembrane protein 192 isoform 1 |
| 76253926 |
|
Tmem2 |
|
0 |
31 |
2050 |
0 |
0 |
|
n.v. |
0.19 |
-0.08 |
n.v. |
n.v. |
|
transmembrane protein 2 |
| 331284197 |
|
Tmem200c |
|
0 |
215 |
0 |
3070 |
0 |
|
n.v. |
0.36 |
n.v. |
0.04 |
n.v. |
|
transmembrane protein 200C |
| 31982159 |
|
Tmem205 |
|
1208 |
29 |
0 |
0 |
0 |
|
0.15 |
0.63 |
n.v. |
n.v. |
n.v. |
|
transmembrane protein 205 isoform 2 |
| 359718989 |
|
Tmem205 |
|
1208 |
29 |
0 |
0 |
0 |
|
0.15 |
0.63 |
n.v. |
n.v. |
n.v. |
|
transmembrane protein 205 isoform 1 |
| 0 |
0 |
|
n.v. |
0.43 |
0.06 |
n.v. |
n.v. |
|
WD repeat and FYVE domain-containing protein 2 |
| 39930599 |
|
Wdfy3 |
|
0 |
290 |
213 |
0 |
|
n.v. |
-0.03 |
0.01 |
-0.09 |
n.v. |
|
WD repeat and FYVE domain-containing protein 3 |
| =xl6423742 style='background:#FFFFDB;mso-pattern:black none'>-0.14 |
n.v. |
n.v. |
|
transmembrane protein 214 |
| 213972600 |
|
Tmem230 |
|
0 |
495 |
0 |
0 |
0 |
|
n.v. |
-0.16 |
n.v. |
n.v. |
n.v. |
|
transmembrane protein 230 |
| 75677480 |
|
Tmem231 |
|
0 |
13 |
72 |
0 |
0 |
|
n.v. |
-0.3 |
-0.6 |
n.v. |
n.v. |
|
transmembrane protein 231 |
| 395132459;395132466 |
|
Tmem254b |
|
2892 |
0 |
0 |
0 |
0 |
|
0.32 |
n.v. |
n.v. |
n.v. |
n.v. |
|
transmembrane protein C10orf57 homolog-like isoform 2 |
| 395132457 |
|
Tmem254b |
|
5382 |
255 |
2255 |
1220 |
0 |
|
0.29 |
0.31 |
-0.31 |
-0.42 |
n.v. |
|
transmembrane protein C10orf57 homolog-like isoform 1 |
| 395132466 |
|
Tmem254c |
|
0 |
219 |
0 |
0 |
0 |
|
n.v. |
-0.8 |
n.v. |
n.v. |
n.v. |
|
predicted gene 10395 isoform 2 |
| 110625730 |
|
Tmem256 |
|
73 |
0 |
320 |
0 |
0 |
|
-0.16 |
n.v. |
-0.45 |
n.v. |
n.v. |
|
transmembrane protein 256 precursor |
| 19526900 |
|
Tmem30a |
|
0 |
0 |
326 |
0 |
0 |
|
n.v. |
n.v. |
0.02 |
n.v. |
n.v. |
|
cell cycle control protein 50A |
| 22267448 |
|
Tmem33 |
|
30937 |
2968 |
3275 |
1146 |
0 |
|
0.07 |
-0.42 |
-0.34 |
-0.14 |
n.v. |
|
transmembrane protein 33 isoform 1 |
| 68533251 |
|
Tmem33 |
|
30937 |
2968 |
3275 |
1146 |
0 |
|
0.07 |
-0.42 |
-0.34 |
-0.14 |
n.v. |
|
transmembrane protein 33 isoform 2 |
| 85662379 |
|
Tmem41b |
|
0 |
67 |
0 |
0 |
0 |
|
n.v. |
0.06 |
n.v. |
n.v. |
n.v. |
|
transmembrane protein 41B |
| 21311891 |
|
Tmem43 |
|
1940 |
443 |
1119 |
0 |
0 |
|
0.12 |
-0.25 |
-0.5 |
n.v. |
n.v. |
|
transmembrane protein 43 |
| 21450349 |
|
Tmem45b |
|
0 |
0 |
765 |
0 |
0 |
|
n.v. |
n.v. |
-0.03 |
n.v. |
n.v. |
|
transmembrane protein 45B |
| 34610239 |
|
Tmem50a |
|
0 |
90 |
0 |
0 |
0 |
|
n.v. |
0.06 |
n.v. |
n.v. |
n.v. |
|
transmembrane protein 50A |
| 21313410 |
|
Tmem50b |
|
330 |
273 |
1349 |
1334 |
0 |
|
-0.1 |
-0.09 |
-0.09 |
-0.11 |
n.v. |
|
transmembrane protein 50B |
| 21312268 |
|
Tmem55a |
|
0 |
2346 |
1516 |
0 |
0 |
|
n.v. |
0.03 |
-0.12 |
n.v. |
n.v. |
|
transmembrane protein 55A |
| 84095197 |
|
Tmem55b |
|
0 |
831 |
392 |
508 |
0 |
|
n.v. |
-0.36 |
-0.15 |
0.13 |
n.v. |
|
transmembrane protein 55B |
| 227330571 |
|
Tmem59 |
|
0 |
79 |
0 |
0 |
0 |
|
n.v. |
0.15 |
n.v. |
n.v. |
n.v. |
|
transmembrane protein 59 precursor |
| 21450147 |
|
Tmem63a |
|
494 |
15 |
1414 |
0 |
0 |
|
0.05 |
0.43 |
-0.11 |
n.v. |
n.v. |
|
transmembrane protein 63A |
| 226342964 |
|
Tmem63b |
|
0 |
0 |
4 |
0 |
0 |
|
n.v. |
n.v. |
0.33 |
n.v. |
n.v. |
|
transmembrane protein 63B |
| 70778812 |
|
Tmem65 |
|
0 |
56 |
0 |
0 |
0 |
|
n.v. |
-0.14 |
n.v. |
n.v. |
n.v. |
|
transmembrane protein 65 |
| 158631230 |
|
Tmem66 |
|
0 |
184 |
0 |
0 |
0 |
|
n.v. |
-0.89 |
n.v. |
n.v. |
n.v. |
|
store-operated calcium entry-associated regulatory
factor |
| 117647263 |
|
Tmem70 |
|
0 |
17 |
0 |
0 |
0 |
|
n.v. |
-0.41 |
n.v. |
n.v. |
n.v. |
|
transmembrane protein 70, mitochondrial isoform 1 |
| 117647265 |
|
Tmem70 |
|
0 |
17 |
0 |
0 |
0 |
|
n.v. |
-0.41 |
n.v. |
n.v. |
n.v. |
|
transmembrane protein 70, mitochondrial isoform 2 |
| 160333201 |
|
Tmem87a |
|
0 |
303 |
53 |
0 |
0 |
|
n.v. |
-0.56 |
-0.15 |
n.v. |
n.v. |
|
transmembrane protein 87A isoform 1 |
| 160333204 |
|
Tmem87a |
|
0 |
303 |
53 |
0 |
0 |
|
n.v. |
-0.56 |
-0.15 |
n.v. |
n.v. |
|
transmembrane protein 87A isoform 2 |
| 160333208 |
|
Tmem87a |
|
0 |
303 |
53 |
0 |
0 |
|
n.v. |
-0.56 |
-0.15 |
n.v. |
n.v. |
|
transmembrane protein 87A isoform 3 |
| 254553287 |
|
Tmem89 |
|
604 |
0 |
0 |
0 |
0 |
|
-0.08 |
n.v. |
n.v. |
n.v. |
n.v. |
|
transmembrane protein 89 precursor |
| 236466816 |
|
Tmem9 |
|
0 |
0 |
23 |
0 |
0 |
|
n.v. |
n.v. |
0.03 |
n.v. |
n.v. |
|
transmembrane protein 9 precursor |
| 19526880 |
|
Tmem97 |
|
0 |
50 |
0 |
0 |
0 |
|
n.v. |
-0.21 |
n.v. |
n.v. |
n.v. |
|
transmembrane protein 97 |
| 10092671 |
|
Tmem9b |
|
0 |
219 |
408 |
0 |
0 |
|
n.v. |
-0.06 |
-0.03 |
n.v. |
n.v. |
|
transmembrane protein 9B precursor |
| 8394460 |
|
Tmod3 |
|
1611 |
56 |
4819 |
3643 |
44177 |
|
0.04 |
0.69 |
0.18 |
0.3 |
0.16 |
|
tropomodulin-3 |
| 121949760 |
|
Tmpo |
|
604227 |
3290 |
35133 |
5885 |
10367 |
|
0.12 |
-0.18 |
-0.83 |
-0.72 |
-0.65 |
|
lamina-associated polypeptide 2 isoform alpha |
| 121949763 |
|
Tmpo |
|
686842 |
2816 |
11456 |
1138 |
10367 |
|
0.04 |
-0.31 |
-0.8 |
-0.72 |
-0.65 |
|
lamina-associated polypeptide 2 isoform gamma |
| 121949765 |
|
Tmpo |
|
909772 |
5142 |
12459 |
1138 |
10367 |
|
0 |
-0.34 |
-0.72 |
-0.72 |
-0.65 |
|
lamina-associated polypeptide 2 isoform epsilon |
| 121949767 |
|
Tmpo |
|
909772 |
5142 |
12459 |
1138 |
10367 |
|
0 |
-0.34 |
-0.72 |
-0.72 |
-0.65 |
|
lamina-associated polypeptide 2 isoform delta |
| 121949769 |
|
Tmpo |
|
566974 |
2764 |
11456 |
1138 |
10367 |
|
0.11 |
-0.19 |
-0.8 |
-0.72 |
-0.65 |
|
lamina-associated polypeptide 2 isoform beta |
| 121949779 |
|
Tmpo |
|
415675 |
2764 |
11456 |
1138 |
10367 |
|
0.04 |
-0.19 |
-0.8 |
-0.72 |
-0.65 |
|
lamina-associated polypeptide 2 isoform zeta |
| 317008614 |
|
Tmppe |
|
0 |
0 |
69 |
0 |
0 |
|
n.v. |
n.v. |
-0.38 |
n.v. |
n.v. |
|
transmembrane protein with metallophosphoesterase
domain |
| 148747219 |
|
Tmprss11bnl |
|
0 |
0 |
0 |
0 |
37890 |
|
n.v. |
n.v. |
n.v. |
n.v. |
0.12 |
|
transmembrane protease serine 11B-like protein |
| 188536038 |
|
Tmprss11g |
|
494 |
0 |
354 |
0 |
0 |
|
-0.22 |
n.v. |
-0.02 |
n.v. |
n.v. |
|
transmembrane protease serine 11G |
| 34328226 |
|
Tmprss2 |
|
0 |
157 |
514 |
0 |
86 |
|
n.v. |
0.36 |
-0.47 |
n.v. |
-0.37 |
|
transmembrane protease serine 2 |
| 21703806 |
|
Tmprss4 |
|
0 |
0 |
158 |
0 |
0 |
|
n.v. |
n.v. |
0.1 |
n.v. |
n.v. |
|
transmembrane protease serine 4 |
| 126517491 |
|
Tmsb15b1 |
|
0 |
0 |
0 |
0 |
2260 |
|
n.v. |
n.v. |
n.v. |
n.v. |
0.22 |
|
thymosin beta-like |
| 124378056 |
|
Tmsb15b2 |
|
0 |
0 |
0 |
0 |
1521 |
|
n.v. |
n.v. |
n.v. |
n.v. |
0.2 |
|
thymosin beta-like |
| 46402291 |
|
Tmsb15l |
|
0 |
0 |
0 |
0 |
1521 |
|
n.v. |
n.v. |
n.v. |
n.v. |
0.2 |
|
Tmsb15b1-Tmsb15b2 protein |
| 10946578 |
|
Tmsb4x |
|
0 |
6 |
342 |
0 |
739 |
|
n.v. |
1.06 |
0.46 |
n.v. |
0.46 |
|
thymosin beta-4 |
| 75677476 |
|
Tmtc3 |
|
0 |
547 |
1222 |
0 |
0 |
|
n.v. |
-0.22 |
-0.27 |
n.v. |
n.v. |
|
transmembrane and TPR repeat-containing protein 3 isoform
2 |
| 158517929 |
|
Tmtc3 |
|
2453 |
666 |
2005 |
0 |
0 |
|
0.02 |
-0.22 |
-0.29 |
n.v. |
n.v. |
|
transmembrane and TPR repeat-containing protein 3 isoform
1 |
| 11967945 |
|
Tmub1 |
|
0 |
46 |
0 |
0 |
0 |
|
n.v. |
-0.86 |
n.v. |
n.v. |
n.v. |
|
transmembrane and ubiquitin-like domain-containing
protein 1 precursor |
| 33859722 |
|
Tmx1 |
|
103887 |
5071 |
8042 |
1588 |
0 |
|
0.03 |
-0.28 |
-0.26 |
-0.44 |
n.v. |
|
thioredoxin-related transmembrane protein 1
precursor |
| 21313210 |
|
Tmx2 |
|
146 |
2108 |
757 |
0 |
0 |
|
0.41 |
-0.31 |
-0.47 |
n.v. |
n.v. |
|
thioredoxin-related transmembrane protein 2
precursor |
| 117606385 |
|
Tmx3 |
|
0 |
1010 |
661 |
0 |
0 |
|
n.v. |
-0.14 |
-0.43 |
n.v. |
n.v. |
|
protein disulfide-isomerase TMX3 precursor |
| 112817607 |
|
Tmx4 |
|
1593 |
526 |
42 |
0 |
0 |
|
-0.07 |
0.04 |
-0.51 |
n.v. |
n.v. |
|
thioredoxin-related transmembrane protein 4
precursor |
| 194394239 |
|
Tnfaip2 |
|
0 |
0 |
13 |
0 |
0 |
|
n.v. |
n.v. |
0.09 |
n.v. |
n.v. |
|
tumor necrosis factor alpha-induced protein 2 |
| 295444879 |
|
Tnfaip8 |
|
0 |
1822 |
1697 |
1007 |
25896 |
|
n.v. |
0.21 |
0.04 |
0.59 |
0.08 |
|
tumor necrosis factor alpha-induced protein 8 isoform 1 |
| 295444881 |
|
Tnfaip8 |
|
0 |
1822 |
1122 |
1007 |
16096 |
|
n.v. |
0.21 |
0.08 |
0.59 |
0.08 |
|
tumor necrosis factor alpha-induced protein 8 isoform 2 |
| 295444883 |
|
Tnfaip8 |
|
0 |
1035 |
841 |
1007 |
13098 |
|
n.v. |
0.21 |
0.08 |
0.59 |
0.08 |
|
tumor necrosis factor alpha-induced protein 8 isoform 3 |
| 31560244 |
|
Tnfaip8l1 |
|
0 |
0 |
0 |
221 |
0 |
|
n.v. |
n.v. |
n.v. |
-0.25 |
n.v. |
|
tumor necrosis factor alpha-induced protein 8-like
protein 1 |
| 244792359 |
|
Tnik |
|
0 |
0 |
247 |
0 |
0 |
|
n.v. |
n.v. |
0.21 |
n.v. |
n.v. |
|
traf2 and NCK-interacting protein kinase isoform 1 |
| 244792600 |
|
Tnik |
|
0 |
0 |
247 |
0 |
0 |
|
n.v. |
n.v. |
0.21 |
n.v. |
n.v. |
|
traf2 and NCK-interacting protein kinase isoform 2 |
| 244792613 |
|
Tnik |
|
0 |
0 |
247 |
0 |
0 |
|
n.v. |
n.v. |
0.21 |
n.v. |
n.v. |
|
traf2 and NCK-interacting protein kinase isoform 3 |
| 244792650 |
|
Tnik |
|
0 |
0 |
247 |
0 |
0 |
|
n.v. |
n.v. |
0.21 |
n.v. |
n.v. |
|
traf2 and NCK-interacting protein kinase isoform 4 |
| 254939617 |
|
Tnip1 |
|
0 |
0 |
0 |
0 |
2613 |
|
n.v. |
n.v. |
n.v. |
n.v. |
0.02 |
|
TNFAIP3-interacting protein 1 isoform 1 |
| 407027872;313103031 |
|
Tnip1 |
|
0 |
0 |
0 |
0 |
2613 |
|
n.v. |
n.v. |
n.v. |
n.v. |
0.02 |
|
TNFAIP3-interacting protein 1 isoform 2 |
| 407027874 |
|
Tnip1 |
|
0 |
0 |
0 |
0 |
2613 |
|
n.v. |
n.v. |
n.v. |
n.v. |
0.02 |
|
TNFAIP3-interacting protein 1 isoform 3 |
| 124486923 |
|
Tnks1bp1 |
|
0 |
1561 |
9062 |
0 |
11084 |
|
n.v. |
0.3 |
0.19 |
n.v. |
-0.03 |
|
182 kDa tankyrase-1-binding protein |
| 6678391 |
|
Tnni2 |
|
2343 |
0 |
0 |
0 |
0 |
|
0.07 |
n.v. |
n.v. |
n.v. |
n.v. |
|
troponin I, fast skeletal muscle |
| 115385966 |
|
Tnpo1 |
|
0 |
5000 |
7077 |
28453 |
20584 |
|
n.v. |
0.14 |
0.05 |
0.07 |
-0.02 |
|
transportin-1 isoform 2 |
| 115385968 |
|
Tnpo1 |
|
0 |
5000 |
7077 |
28453 |
20584 |
|
n.v. |
0.14 |
0.05 |
0.07 |
-0.02 |
|
transportin-1 isoform 1 |
| 170932528 |
|
Tnpo2 |
|
0 |
2724 |
3486 |
12458 |
17317 |
|
n.v. |
0.21 |
0.09 |
0.17 |
0.07 |
|
transportin-2 |
| 54312056 |
|
Tnpo3 |
|
476 |
589 |
2211 |
4469 |
11106 |
|
-0.23 |
-0.2 |
0.1 |
-0.05 |
0.1 |
|
transportin-3 |
| 159110982 |
|
Tnrc6b |
|
0 |
0 |
85 |
0 |
0 |
|
n.v. |
n.v. |
0.85 |
n.v. |
n.v. |
|
trinucleotide repeat-containing gene 6B protein isoform
2 |
| 67782332 |
|
Tnrc6b |
|
0 |
0 |
85 |
0 |
0 |
|
n.v. |
n.v. |
0.85 |
n.v. |
n.v. |
|
trinucleotide repeat-containing gene 6B protein isoform
1 |
| 124378035 |
|
Tnrc6c |
|
0 |
0 |
0 |
0 |
0 |
|
n.v. |
n.v. |
1.24 |
n.v. |
n.v. |
|
trinucleotide repeat-containing gene 6C protein |
| 226437589 |
|
Tns1 |
|
0 |
240 |
363 |
0 |
7015 |
|
n.v. |
-0.61 |
0.15 |
n.v. |
-0.53 |
|
tensin 1 |
| 134152676 |
|
Tns3 |
|
0 |
240 |
357 |
0 |
8118 |
|
n.v. |
-0.61 |
0.15 |
n.v. |
0 |
|
tensin-3 |
| 21311839 |
|
Toe1 |
|
0 |
86 |
1632 |
15315 |
771 |
|
n.v. |
0.07 |
-0.26 |
0.03 |
0.11 |
|
target of EGR1 protein 1 |
| 13591860 |
|
Tollip |
|
0 |
420 |
669 |
0 |
1735 |
|
n.v. |
-1.22 |
-0.23 |
n.v. |
-0.07 |
|
toll-interacting protein |
| 210147426 |
|
Tom1 |
|
0 |
109 |
944 |
0 |
5226 |
|
n.v. |
0.16 |
-0.15 |
n.v. |
0.27 |
|
target of Myb protein 1 isoform 2 |
| 6755847 |
|
Tom1 |
|
0 |
109 |
944 |
0 |
5226 |
|
n.v. |
0.16 |
-0.15 |
n.v. |
0.27 |
|
target of Myb protein 1 isoform 1 |
| 110625896 |
|
Tom1l1 |
|
97718 |
12483 |
17059 |
3634 |
34988 |
|
0.07 |
-0.27 |
-0.26 |
-0.24 |
-0.29 |
|
TOM1-like protein 1 |
| 31982091 |
|
Tomm22 |
|
12283 |
253 |
1330 |
909 |
0 |
|
-0.09 |
-0.2 |
-0.26 |
-0.67 |
n.v. |
|
mitochondrial import receptor subunit TOM22 homolog |
| 13385500 |
|
Tomm34 |
|
0 |
6173 |
4191 |
9814 |
34913 |
|
n.v. |
0.18 |
0.05 |
-0.1 |
0.08 |
|
mitochondrial import receptor subunit TOM34 |
| 157909797 |
|
Tomm40 |
|
13876 |
7496 |
1686 |
0 |
0 |
|
0.15 |
-0.18 |
-0.45 |
n.v. |
n.v. |
|
mitochondrial import receptor subunit TOM40 homolog |
| 153791486 |
|
Tomm5 |
|
2984 |
1052 |
0 |
0 |
0 |
|
-0.02 |
-0.22 |
n.v. |
n.v. |
n.v. |
|
mitochondrial import receptor subunit TOM5 homolog
isoform 1 |
| 197382455 |
|
Tomm5 |
|
2984 |
1052 |
0 |
0 |
0 |
|
-0.02 |
-0.22 |
n.v. |
n.v. |
n.v. |
|
mitochondrial import receptor subunit TOM5 homolog
isoform 2 |
| 21313592 |
|
Tomm7 |
|
3057 |
797 |
331 |
0 |
0 |
|
-0.05 |
-0.25 |
-0.28 |
n.v. |
n.v. |
|
mitochondrial import receptor subunit TOM7 homolog |
|
style='color:#061E96'>27552760 |
|
Tomm70a |
|
2343 |
32786 |
4014 |
0 |
0 |
|
0.1 |
-0.13 |
-0.3 |
n.v. |
n.v. |
|
mitochondrial import receptor subunit TOM70 |
| 187608797 |
|
Tonsl |
|
0 |
0 |
0 |
0 |
9928 |
|
n.v. |
n.v. |
n.v. |
n.v. |
-0.39 |
|
tonsoku-like protein |
| 112734855 |
|
Top1 |
|
79228 |
4311 |
10654 |
0 |
0 |
|
0.06 |
-0.04 |
-0.27 |
n.v. |
n.v. |
|
DNA topoisomerase 1 |
| 50657345 |
|
Top1mt |
|
0 |
1098 |
1564 |
0 |
0 |
|
n.v. |
0.19 |
-0.4 |
n.v. |
n.v. |
|
DNA topoisomerase I, mitochondrial |
| 153945749 |
|
Top2a |
|
348 |
0 |
20 |
0 |
0 |
|
0.26 |
n.v. |
-0.17 |
n.v. |
n.v. |
|
DNA topoisomerase 2-alpha |
| 34328148 |
|
Top2b |
|
10471 |
0 |
12 |
0 |
0 |
|
-0.27 |
n.v. |
0.03 |
n.v. |
n.v. |
|
DNA topoisomerase 2-beta |
| 6678403 |
|
Top3a |
|
0 |
0 |
1528 |
0 |
0 |
|
n.v. |
n.v. |
0.2 |
n.v. |
n.v. |
|
DNA topoisomerase 3-alpha |
| 6755851 |
|
Top3b |
|
0 |
248 |
16789 |
606 |
0 |
|
n.v. |
0.84 |
0.17 |
0.5 |
n.v. |
|
DNA topoisomerase 3-beta-1 |
| 21450255 |
|
Tor1a |
|
0 |
1822 |
16 |
0 |
0 |
|
n.v. |
-0.5 |
-0.49 |
n.v. |
n.v. |
|
torsin-1A precursor |
| 229608948 |
|
Tor1aip1 |
|
0 |
119 |
32 |
0 |
0 |
|
n.v. |
-0.82 |
0.43 |
n.v. |
n.v. |
|
torsin-1A-interacting protein 1 isoform 3 |
| 229608944 |
|
Tor1aip1 |
|
1867 |
119 |
32 |
0 |
0 |
|
-0.14 |
-0.82 |
0.43 |
n.v. |
n.v. |
|
torsin-1A-interacting protein 1 isoform 2 |
| 229608946 |
|
Tor1aip1 |
|
1867 |
119 |
32 |
0 |
0 |
|
-0.14 |
-0.82 |
0.43 |
n.v. |
n.v. |
|
torsin-1A-interacting protein 1 isoform 1 |
| 229892347 |
|
Tor1aip2 |
|
0 |
1361 |
209 |
0 |
0 |
|
n.v. |
-0.3 |
-0.48 |
n.v. |
n.v. |
|
torsin-1A-interacting protein 2 isoform b |
| 11612513 |
|
Tor1aip2 |
|
0 |
0 |
0 |
655 |
685 |
|
n.v. |
n.v. |
n.v. |
0.28 |
0.09 |
|
interferon alpha responsive protein isoform a |
| 31559990 |
|
Tor1b |
|
4229 |
816 |
161 |
0 |
0 |
|
0.05 |
-0.51 |
-0.56 |
n.v. |
n.v. |
|
torsin-1B precursor |
| 22779883 |
|
Tor2a |
|
0 |
159 |
0 |
0 |
0 |
|
n.v. |
-0.04 |
n.v. |
n.v. |
n.v. |
|
torsin-2A precursor |
| 224809275 |
|
Tor3a |
|
0 |
324 |
509 |
0 |
0 |
|
n.v. |
-0.09 |
-0.4 |
n.v. |
n.v. |
|
torsin-3A precursor |
| 258645109 |
|
Tpbg |
|
0 |
0 |
19 |
0 |
0 |
|
n.v. |
n.v. |
0.7 |
n.v. |
n.v. |
|
trophoblast glycoprotein precursor |
| 6678407 |
|
Tpd52 |
|
7689 |
14915 |
31881 |
40658 |
64246 |
|
0.08 |
0.15 |
0.04 |
-0.01 |
-0.02 |
|
tumor protein D52 isoform 5 |
| 70608194 |
|
Tpd52 |
|
7689 |
14915 |
31881 |
40658 |
64246 |
|
0.08 |
0.15 |
0.04 |
-0.01 |
-0.02 |
|
tumor protein D52 isoform 1 |
| 70608198 |
|
Tpd52 |
|
7689 |
14915 |
31881 |
40658 |
64246 |
|
0.08 |
0.15 |
0.04 |
-0.01 |
-0.02 |
|
tumor protein D52 isoform 2 |
| 70608205 |
|
Tpd52 |
|
7689 |
14915 |
31881 |
42221 |
64246 |
|
0.08 |
0.15 |
0.04 |
-0.01 |
-0.02 |
|
tumor protein D52 isoform 4 |
| 70608214 |
|
Tpd52 |
|
7689 |
14915 |
31881 |
42246 |
64246 |
|
0.08 |
0.15 |
0.04 |
-0.01 |
-0.02 |
|
tumor protein D52 isoform 3 |
| 6678409 |
|
Tpd52l1 |
|
0 |
6770 |
6924 |
7195 |
16032 |
|
n.v. |
-0.02 |
0.04 |
0.14 |
0.13 |
|
tumor protein D53 |
| 31560247 |
|
Tpd52l2 |
|
0 |
3096 |
2693 |
20587 |
16835 |
|
n.v. |
0.24 |
0.12 |
0.01 |
-0.05 |
|
tumor protein D54 |
| 226958349 |
|
Tpi1 |
|
797044 |
84974 |
230414 |
62898 |
1403534 |
|
0.03 |
-0.03 |
-0.03 |
0.07 |
0.04 |
|
triosephosphate isomerase |
| 7305589 |
|
Tpk1 |
|
0 |
165 |
435 |
41 |
20134 |
|
n.v. |
0.21 |
0.01 |
0.5 |
0.11 |
|
thiamin pyrophosphokinase 1 |
| 256000780 |
|
Tpm1 |
|
170575 |
28774 |
23397 |
132238 |
351111 |
|
0.22 |
0.43 |
0.27 |
0.32 |
0.21 |
|
tropomyosin alpha-1 chain isoform 1 |
| 256000782 |
|
Tpm1 |
|
121149 |
21806 |
21233 |
105004 |
307716 |
|
0.21 |
0.43 |
0.29 |
0.32 |
0.19 |
|
tropomyosin alpha-1 chain isoform 2 |
| 256000784 |
|
Tpm1 |
|
198382 |
28774 |
26483 |
131665 |
391871 |
|
0.21 |
0.43 |
0.26 |
0.32 |
0.21 |
|
tropomyosin alpha-1 chain isoform 4 |
| 256000786 |
|
Tpm1 |
|
198382 |
28774 |
24988 |
131665 |
346485 |
|
0.21 |
0.43 |
0.26 |
0.32 |
0.22 |
|
tropomyosin alpha-1 chain isoform 5 |
| 256000788 |
|
Tpm1 |
|
118257 |
23088 |
21530 |
112183 |
331888 |
|
0.2 |
0.43 |
0.27 |
0.33 |
0.19 |
|
tropomyosin alpha-1 chain isoform 6 |
| 256000790 |
|
Tpm1 |
|
146064 |
23088 |
23120 |
111610 |
328332 |
|
0.19 |
0.43 |
0.26 |
0.34 |
0.19 |
|
tropomyosin alpha-1 chain isoform 7 |
| 256000792 |
|
Tpm1 |
|
118257 |
23088 |
20036 |
112183 |
288439 |
|
0.2 |
0.43 |
0.27 |
0.33 |
0.19 |
|
tropomyosin alpha-1 chain isoform 8 |
| 256000794 |
|
Tpm1 |
|
170575 |
28774 |
23397 |
132238 |
350672 |
|
0.22 |
0.43 |
0.27 |
0.32 |
0.21 |
|
tropomyosin alpha-1 chain isoform 9 |
| 256000796 |
|
Tpm1 |
|
118257 |
23088 |
20036 |
114590 |
288000 |
|
0.2 |
0.43 |
0.27 |
0.32 |
0.2 |
|
tropomyosin alpha-1 chain isoform 10 |
| 31560030 |
|
Tpm1 |
|
170575 |
28774 |
24893 |
132238 |
451855 |
|
0.22 |
0.43 |
0.28 |
0.32 |
0.21 |
|
tropomyosin alpha-1 chain isoform 3 |
| 482677662 |
|
Tpm2 |
|
101800 |
0 |
2352 |
0 |
0 |
|
0.22 |
n.v. |
0.26 |
n.v. |
n.v. |
|
tropomyosin beta chain isoform 2 |
| 482677666 |
|
Tpm2 |
|
101800 |
0 |
2352 |
0 |
0 |
|
0.22 |
n.v. |
0.26 |
n.v. |
n.v. |
|
tropomyosin beta chain isoform 3 |
| 11875203 |
|
Tpm2 |
|
110934 |
12546 |
13805 |
53656 |
176910 |
|
0.22 |
0.45 |
0.26 |
0.35 |
0.17 |
|
tropomyosin beta chain isoform 1 |
| 359279904 |
|
Tpm3 |
|
243012 |
37498 |
41296 |
149468 |
365558 |
|
0.13 |
0.35 |
0.2 |
0.24 |
0.16 |
|
tropomyosin alpha-3 chain isoform 3 |
| 359279908 |
|
Tpm3 |
|
243012 |
37498 |
41285 |
148936 |
314656 |
|
0.13 |
0.35 |
0.2 |
0.24 |
0.17 |
|
tropomyosin alpha-3 chain isoform 4 |
| 40254525 |
|
Tpm3 |
|
121442 |
26173 |
25415 |
130715 |
278940 |
|
0.19 |
0.41 |
0.25 |
0.3 |
0.19 |
|
tropomyosin alpha-3 chain isoform 1 |
| 418203916 |
|
Tpm3 |
|
243012 |
35356 |
38162 |
138639 |
309730 |
|
0.13 |
0.35 |
0.22 |
0.24 |
0.18 |
|
tropomyosin alpha-3 chain isoform 5 |
| 47894398 |
|
Tpm4 |
|
19789 |
5079 |
9311 |
50399 |
154495 |
|
0.11 |
0.48 |
0.11 |
0.21 |
0.11 |
|
tropomyosin alpha-4 chain |
| 253795504 |
|
Tpmt |
|
0 |
0 |
0 |
0 |
568 |
|
n.v. |
n.v. |
n.v. |
n.v. |
0.22 |
|
thiopurine S-methyltransferase |
| 6753448 |
|
Tpp1 |
|
69837 |
10886 |
11992 |
18606 |
16643 |
|
0.19 |
-0.09 |
-0.05 |
-0.13 |
-0.21 |
|
tripeptidyl-peptidase 1 precursor |
| 6678419 |
|
Tpp2 |
|
0 |
3540 |
6333 |
76928 |
30158 |
|
n.v. |
0.1 |
0.08 |
0.13 |
-0.14 |
|
tripeptidyl-peptidase 2 |
| 270309140 |
|
Tpr |
|
36630 |
378 |
50 |
0 |
82892 |
|
0.11 |
-0.37 |
-0.12 |
n.v. |
-0.28 |
|
nucleoprotein TPR |
| 21312776 |
|
Tprgl |
|
0 |
1518 |
1419 |
467 |
0 |
|
n.v. |
0.17 |
0.12 |
-0.41 |
n.v. |
|
tumor protein p63-regulated gene 1-like protein |
| 28849893 |
|
Tprkb |
|
275 |
0 |
0 |
0 |
0 |
|
0.26 |
n.v. |
n.v. |
n.v. |
n.v. |
|
TP53RK-binding protein |
| 28849893;281427253 |
|
Tprkb |
|
0 |
0 |
354 |
0 |
0 |
|
n.v. |
n.v. |
0.11 |
n.v. |
n.v. |
|
TP53RK-binding protein |
| 281427253;28849893 |
|
Tprkb |
|
0 |
0 |
0 |
4535 |
8696 |
|
n.v. |
n.v. |
n.v. |
0.14 |
-0.01 |
|
TP53RK-binding protein |
| 190014629 |
|
Tprn |
|
0 |
1994 |
15621 |
0 |
0 |
|
n.v. |
0.1 |
-0.37 |
n.v. |
n.v. |
|
taperin |
| 255683445 |
|
Tpsg1 |
|
0 |
180 |
0 |
0 |
0 |
|
n.v. |
0.2 |
n.v. |
n.v. |
n.v. |
|
tryptase gamma precursor |
| 6678437 |
|
Tpt1 |
|
18654 |
4883 |
40727 |
7146 |
270297 |
|
0.08 |
0.2 |
0.11 |
0.11 |
0.12 |
|
translationally-controlled tumor protein |
| 269784764 |
|
Tpte |
|
2087 |
0 |
559 |
3070 |
0 |
|
-0.09 |
n.v. |
-0.03 |
0.18 |
n.v. |
|
transmembrane phosphatase with tensin homology |
| 111160869 |
|
Tra2a |
|
0 |
1246 |
132 |
933 |
0 |
|
n.v. |
-0.25 |
0.1 |
-0.19 |
n.v. |
|
transformer-2 protein homolog alpha |
| 6677975 |
|
Tra2b |
|
14132 |
0 |
67 |
3954 |
0 |
|
0.02 |
n.v. |
0.04 |
0.27 |
n.v. |
|
transformer-2 protein homolog beta |
| 117606383 |
|
Trabd |
|
0 |
63 |
258 |
0 |
75 |
|
n.v. |
-0.08 |
-0.19 |
n.v. |
0.15 |
|
traB domain-containing protein |
| 75677522 |
|
Tradd |
|
0 |
486 |
347 |
4314 |
5997 |
|
n.v. |
0.47 |
-0.02 |
0.19 |
0.14 |
|
tumor necrosis factor receptor type 1-associated DEATH
domain protein |
| 83921633 |
|
Traf2 |
|
0 |
154 |
76 |
25 |
3320 |
|
n.v. |
-0.61 |
0.34 |
0.76 |
0.27 |
|
TNF receptor-associated factor 2 |
| 6755867 |
|
Traf5 |
|
0 |
0 |
154 |
0 |
0 |
|
n.v. |
n.v. |
-0.3 |
n.v. |
n.v. |
|
TNF receptor-associated factor 5 |
| 30794386 |
|
Tram1 |
|
0 |
1129 |
369 |
0 |
0 |
|
n.v. |
-0.14 |
-0.01 |
n.v. |
n.v. |
|
translocating chain-associated membrane protein 1 |
| 13385998 |
|
Trap1 |
|
523808 |
80858 |
29585 |
86890 |
34934 |
|
-0.14 |
-0.22 |
-0.1 |
-0.05 |
-0.04 |
|
heat shock protein 75 kDa, mitochondrial precursor |
| 66730565 |
|
Trappc1 |
|
0 |
495 |
259 |
8357 |
32 |
|
n.v. |
0.64 |
-0.09 |
0 |
0.2 |
|
trafficking protein particle complex subunit 1 |
| 124486684 |
|
Trappc10 |
|
0 |
530 |
1103 |
0 |
3556 |
|
n.v. |
-0.43 |
0.11 |
n.v. |
0.28 |
|
trafficking protein particle complex subunit 10 |
| 62241019 |
|
Trappc11 |
|
0 |
0 |
1465 |
0 |
0 |
|
n.v. |
n.v. |
-0.04 |
n.v. |
n.v. |
|
trafficking protein particle complex subunit 11 |
| 238637273;238637271 |
|
Trappc12 |
|
0 |
0 |
369 |
0 |
0 |
|
n.v. |
n.v. |
-0.19 |
n.v. |
n.v. |
|
trafficking protein particle complex subunit 12 isoform 1 |
| 238637273 |
|
Trappc12 |
|
0 |
0 |
0 |
0 |
332 |
|
n.v. |
n.v. |
n.v. |
n.v. |
0.9 |
|
trafficking protein particle complex subunit 12 isoform 1 |
| 238637275 |
|
Trappc12 |
|
0 |
0 |
1 |
0 |
332 |
|
n.v. |
n.v. |
0.21 |
n.v. |
0.9 |
|
trafficking protein particle complex subunit 12 isoform 2 |
| 153791919 |
|
Trappc2 |
|
0 |
75 |
309 |
5714 |
54 |
|
n.v. |
0.22 |
0.02 |
-0.02 |
-0.08 |
|
trafficking protein particle complex subunit 2 |
| 10946914 |
|
Trappc2l |
|
0 |
426 |
667 |
3151 |
3556 |
|
n.v. |
0.06 |
-0.05 |
-0.06 |
-0.15 |
|
trafficking protein particle complex subunit 2-like
protein |
| 7304929 |
|
Trappc3 |
|
275 |
1349 |
3796 |
32177 |
16985 |
|
-0.1 |
0.06 |
-0.03 |
-0.03 |
0.04 |
|
trafficking protein particle complex subunit 3 |
| 11140825 |
|
Trappc4 |
|
0 |
501 |
419 |
8382 |
2624 |
|
n.v. |
0 |
0.05 |
0.02 |
0.17 |
|
trafficking protein particle complex subunit 4 |
| 157266281 |
|
Trappc5 |
|
0 |
4281 |
4326 |
25023 |
7861 |
|
n.v. |
0.07 |
-0.05 |
0 |
-0.1 |
|
trafficking protein particle complex subunit 5 |
| 31981104 |
|
Trappc6a |
|
0 |
0 |
0 |
74 |
0 |
|
n.v. |
n.v. |
n.v. |
-0.2 |
n.v. |
|
trafficking protein particle complex subunit 6A |
| 58037519 |
|
Trappc6b |
|
238 |
883 |
1816 |
22920 |
5333 |
|
0.12 |
0.33 |
0.04 |
0.09 |
-0.06 |
|
trafficking protein particle complex subunit 6B |
| 291621688 |
|
Trappc8 |
|
0 |
0 |
0 |
246 |
0 |
|
n.v. |
n.v. |
n.v. |
-0.65 |
n.v. |
|
uncharacterized protein LOC75964 isoform 1 |
| 257467575 |
|
Trappc9 |
|
0 |
1023 |
1715 |
2063 |
6019 |
|
n.v. |
0.23 |
0.01 |
0.23 |
-0.15 |
|
trafficking protein particle complex subunit 9 isoform 2 |
| 257467578 |
|
Trappc9 |
|
0 |
1023 |
1636 |
2063 |
5258 |
|
n.v. |
0.23 |
0 |
0.23 |
-0.16 |
|
trafficking protein particle complex subunit 9 isoform 3 |
| 257467580 |
|
Trappc9 |
|
0 |
1023 |
1636 |
2063 |
5258 |
|
n.v. |
0.23 |
0 |
0.23 |
-0.16 |
|
trafficking protein particle complex subunit 9 isoform 4 |
| 257467582 |
|
Trappc9 |
|
0 |
303 |
711 |
2063 |
2035 |
|
n.v. |
0.2 |
0.01 |
0.23 |
-0.16 |
|
trafficking protein particle complex subunit 9 isoform 5 |
| 30840992 |
|
Trappc9 |
|
0 |
898 |
1033 |
1342 |
5580 |
|
n.v. |
0.26 |
0.07 |
0.25 |
-0.17 |
|
trafficking protein particle complex subunit 9 isoform 1 |
| 21312202 |
|
Triap1 |
|
0 |
115 |
0 |
0 |
54 |
|
n.v. |
0.03 |
n.v. |
n.v. |
-0.03 |
|
TP53-regulated inhibitor of apoptosis 1 |
| 70778828 |
|
Trim16 |
|
0 |
0 |
0 |
0 |
3277 |
|
n.v. |
n.v. |
n.v. |
n.v. |
0.17 |
|
tripartite motif-containing protein 16 |
| 29789263 |
|
Trim23 |
|
604 |
104 |
1444 |
990 |
171 |
|
0.4 |
-0.02 |
0 |
0.01 |
0.25 |
|
E3 ubiquitin-protein ligase TRIM23 |
| 440918679 |
|
Trim24 |
|
0 |
0 |
13 |
0 |
1649 |
|
n.v. |
n.v. |
0.51 |
n.v. |
0.07 |
|
transcription intermediary factor 1-alpha isoform 2 |
| 440918697 |
|
Trim24 |
|
0 |
0 |
13 |
0 |
1649 |
|
n.v. |
n.v. |
0.51 |
n.v. |
0.07 |
|
transcription intermediary factor 1-alpha isoform 3 |
| 94420998 |
|
Trim24 |
|
0 |
0 |
13 |
0 |
1649 |
|
n.v. |
n.v. |
0.51 |
n.v. |
0.07 |
|
transcription intermediary factor 1-alpha isoform 1 |
| 145207948 |
|
Trim25 |
|
0 |
3008 |
21032 |
23959 |
0 |
|
n.v. |
0.26 |
0.02 |
0.08 |
n.v. |
|
E3 ubiquitin/ISG15 ligase TRIM25 |
| 125347389 |
|
Trim27 |
|
0 |
0 |
0 |
426 |
43 |
|
n.v. |
n.v. |
n.v. |
-0.64 |
-0.31 |
|
zinc finger protein RFP |
| 170295840 |
|
Trim28 |
|
114614 |
3209 |
8806 |
182137 |
136011 |
|
0.03 |
0.03 |
0.03 |
0.05 |
-0.07 |
|
transcription intermediary factor 1-beta |
| 33468961 |
|
Trim3 |
|
0 |
0 |
1853 |
0 |
0 |
|
n.v. |
n.v. |
0.1 |
n.v. |
n.v. |
|
tripartite motif-containing protein 3 |
| 239937489 |
|
Trim32 |
|
0 |
0 |
296 |
0 |
0 |
|
n.v. |
n.v. |
-0.37 |
n.v. |
n.v. |
|
E3 ubiquitin-protein ligase TRIM32 |
| 119637828 |
|
Trim33 |
|
0 |
0 |
34 |
10797 |
4123 |
|
n.v. |
n.v. |
-0.82 |
-0.04 |
0.37 |
|
E3 ubiquitin-protein ligase TRIM33 isoform 1 |
| 119637830 |
|
Trim33 |
|
0 |
0 |
34 |
10797 |
4123 |
|
n.v. |
n.v. |
-0.82 |
-0.04 |
0.37 |
|
E3 ubiquitin-protein ligase TRIM33 isoform 2 |
| 326537318 |
|
Trim47 |
|
0 |
0 |
80 |
0 |
13398 |
|
n.v. |
n.v. |
0.34 |
n.v. |
0.22 |
|
tripartite motif-containing protein 47 isoform 1 |
| 326537320 |
|
Trim47 |
|
0 |
40 |
80 |
0 |
13398 |
|
n.v. |
0.34 |
0.34 |
n.v. |
0.22 |
|
tripartite motif-containing protein 47 isoform 2 |
| 41235779 |
|
Trim56 |
|
0 |
0 |
5130 |
2259 |
0 |
|
n.v. |
n.v. |
0.15 |
-0.29 |
n.v. |
|
E3 ubiquitin-protein ligase TRIM56 |
| 170295836 |
|
Trim59 |
|
0 |
0 |
155 |
0 |
0 |
|
n.v. |
n.v. |
-0.21 |
n.v. |
n.v. |
|
tripartite motif-containing protein 59 |
| 164518923 |
|
Trim65 |
|
0 |
0 |
57 |
0 |
1949 |
|
n.v. |
n.v. |
-0.02 |
n.v. |
-1.17 |
|
tripartite motif-containing protein 65 |
| 85701941 |
|
Trim75 |
|
0 |
0 |
45 |
0 |
0 |
|
n.v. |
n.v. |
0.06 |
n.v. |
n.v. |
|
tripartite motif-containing protein 75 |
| 154240708 |
|
Trim8 |
|
0 |
0 |
0 |
0 |
139 |
|
n.v. |
n.v. |
n.v. |
n.v. |
0.22 |
|
probable E3 ubiquitin-protein ligase TRIM8 |
| 145587082 |
|
Trio |
|
0 |
0 |
10 |
25 |
1146 |
|
n.v. |
n.v. |
-0.65 |
-0.26 |
0.43 |
|
triple functional domain protein |
| 88501743 |
|
Triobp |
|
439 |
612 |
558 |
0 |
750 |
|
0.07 |
0.18 |
-0.2 |
n.v. |
-0.22 |
|
TRIO and F-actin-binding protein isoform 5 |
| 88501745 |
|
Triobp |
|
439 |
612 |
337 |
0 |
750 |
|
0.07 |
0.18 |
-0.19 |
n.v. |
-0.22 |
|
TRIO and F-actin-binding protein isoform 1 |
| 88501749 |
|
Triobp |
|
439 |
612 |
558 |
0 |
750 |
|
0.07 |
0.18 |
-0.2 |
n.v. |
-0.22 |
|
TRIO and F-actin-binding protein isoform 3 |
| 19527354 |
|
Trip10 |
|
0 |
1764 |
8805 |
57815 |
10131 |
|
n.v. |
0.28 |
0.11 |
0.1 |
-0.36 |
|
cdc42-interacting protein 4 isoform 3 |
| 334724448 |
|
Trip10 |
|
0 |
1764 |
8805 |
56644 |
10131 |
|
n.v. |
0.28 |
0.11 |
0.08 |
-0.36 |
|
cdc42-interacting protein 4 isoform 1 |
| 334724450 |
|
Trip10 |
|
0 |
1764 |
8805 |
56644 |
10131 |
|
n.v. |
0.28 |
0.11 |
0.08 |
-0.36 |
|
cdc42-interacting protein 4 isoform 2 |
| 334724453 |
|
Trip10 |
|
0 |
1764 |
8805 |
56955 |
10131 |
|
n.v. |
0.28 |
0.11 |
0.08 |
-0.36 |
|
cdc42-interacting protein 4 isoform 4 |
| 226531227 |
|
Trip11 |
|
0 |
672 |
812 |
0 |
8535 |
|
n.v. |
0.17 |
0.25 |
n.v. |
-0.27 |
|
thyroid hormone receptor interactor 11 |
| 91932791 |
|
Trip12 |
|
6590 |
15 |
11922 |
2153 |
0 |
|
0.04 |
-0.03 |
0.33 |
-0.15 |
n.v. |
|
E3 ubiquitin-protein ligase TRIP12 |
| 110625724 |
|
Trip13 |
|
0 |
0 |
0 |
0 |
503 |
|
n.v. |
n.v. |
n.v. |
n.v. |
-0.21 |
|
pachytene checkpoint protein 2 homolog |
| 283945454 |
|
Trip4 |
|
0 |
0 |
445 |
0 |
0 |
|
n.v. |
n.v. |
0.17 |
n.v. |
n.v. |
|
activating signal cointegrator 1 isoform 2 |
| 71773829 |
|
Trip4 |
|
0 |
0 |
445 |
0 |
0 |
|
n.v. |
n.v. |
0.17 |
n.v. |
n.v. |
|
activating signal cointegrator 1 isoform 1 |
| 6755879 |
|
Trip6 |
|
0 |
0 |
0 |
0 |
6672 |
|
n.v. |
n.v. |
n.v. |
n.v. |
0.51 |
|
thyroid receptor-interacting protein 6 |
| 257095998 |
|
Trmt1 |
|
0 |
0 |
0 |
745 |
3695 |
|
n.v. |
n.v. |
n.v. |
0.25 |
0.27 |
|
tRNA (guanine(26)-N(2))-dimethyltransferase isoform 1 |
| 257096002 |
|
Trmt1 |
|
0 |
0 |
0 |
745 |
3695 |
|
n.v. |
n.v. |
n.v. |
0.25 |
0.27 |
|
tRNA (guanine(26)-N(2))-dimethyltransferase isoform 2 |
| 60593005 |
|
Trmt10a |
|
0 |
0 |
50 |
0 |
353 |
|
n.v. |
n.v. |
0.11 |
n.v. |
0.42 |
|
tRNA methyltransferase 10 homolog A |
| 21312876 |
|
Trmt10c |
|
0 |
1630 |
0 |
0 |
0 |
|
n.v. |
0 |
n.v. |
n.v. |
n.v. |
|
mitochondrial ribonuclease P protein 1 precursor |
| 114051171 |
|
Trmt11 |
|
0 |
8 |
0 |
0 |
182 |
|
n.v. |
-0.65 |
n.v. |
n.v. |
0 |
|
tRNA (guanine(10)-N2)-methyltransferase homolog |
| 261823938;261823936 |
|
Trmt112 |
|
897 |
0 |
1725 |
0 |
0 |
|
0.13 |
n.v. |
-0.07 |
n.v. |
n.v. |
|
tRNA methyltransferase 112 homolog |
| 261823936 |
|
Trmt112 |
|
0 |
612 |
0 |
2202 |
1521 |
|
n.v. |
0.07 |
n.v. |
0.07 |
-0.02 |
|
tRNA methyltransferase 112 homolog |
| 229608908 |
|
Trmt1l |
|
0 |
0 |
882 |
3913 |
0 |
|
n.v. |
n.v. |
0.02 |
0.1 |
n.v. |
|
TRMT1-like protein |
| 124487421 |
|
Trmt2a |
|
531 |
3545 |
23306 |
50529 |
10688 |
|
0.25 |
-0.11 |
0.01 |
0.03 |
0.06 |
|
tRNA (uracil-5-)-methyltransferase homolog A isoform 1 |
| 124487423 |
|
Trmt2a |
|
531 |
3545 |
23306 |
50529 |
10688 |
|
0.25 |
-0.11 |
0.01 |
0.03 |
0.06 |
|
tRNA (uracil-5-)-methyltransferase homolog A isoform 2 |
| 304555603 |
|
Trmt2a |
|
531 |
2532 |
16977 |
45913 |
7015 |
|
0.25 |
-0.06 |
0.01 |
0.03 |
0.01 |
|
tRNA (uracil-5-)-methyltransferase homolog A isoform 4 |
| 21313170 |
|
Trmt5 |
|
0 |
232 |
143 |
1146 |
39657 |
|
n.v. |
0.24 |
-0.05 |
0.02 |
0 |
|
tRNA (guanine(37)-N1)-methyltransferase |
| 148747333 |
|
Trmt6 |
|
0 |
150 |
12 |
12205 |
11202 |
|
n.v. |
0.39 |
0.11 |
0.26 |
0.18 |
|
tRNA (adenine(58)-N(1))-methyltransferase non-catalytic
subunit TRM6 |
| 152963551 |
|
Trmt61a |
|
0 |
0 |
22 |
3127 |
1906 |
|
n.v. |
n.v. |
-0.2 |
0.39 |
-0.18 |
|
tRNA (adenine(58)-N(1))-methyltransferase catalytic
subunit TRMT61A |
| 334358911 |
|
Trnt1 |
|
0 |
856 |
148 |
0 |
22319 |
|
n.v. |
-0.43 |
0.08 |
n.v. |
0 |
|
CCA tRNA nucleotidyltransferase 1, mitochondrial isoform
b |
| 33859692 |
|
Trnt1 |
|
0 |
2973 |
339 |
0 |
42474 |
|
n.v. |
-0.43 |
0.07 |
n.v. |
-0.02 |
|
CCA tRNA nucleotidyltransferase 1, mitochondrial isoform
a |
| 7305523 |
|
Trove2 |
|
0 |
420 |
145 |
14284 |
3459 |
|
n.v. |
0.1 |
0.04 |
0.09 |
-0.34 |
|
60 kDa SS-A/Ro ribonucleoprotein |
| 148747262 |
|
Trp53 |
|
9153 |
2762 |
1807 |
199990 |
975 |
|
0.09 |
0.2 |
0.22 |
0.11 |
0.64 |
|
cellular tumor antigen p53 isoform a |
| 187960040 |
|
Trp53 |
|
9153 |
2762 |
1807 |
199990 |
975 |
|
0.09 |
0.2 |
0.22 |
0.11 |
0.64 |
|
cellular tumor antigen p53 isoform b |
| 160333077 |
|
Trp53bp1 |
|
879 |
0 |
0 |
33 |
2260 |
|
0 |
n.v. |
n.v. |
-1.74 |
-0.14 |
|
tumor suppressor p53-binding protein 1 |
| 31560052 |
|
Trp53rk |
|
0 |
157 |
7 |
57 |
2206 |
|
n.v. |
0.1 |
0.01 |
-0.04 |
0.06 |
|
TP53-regulating kinase |
| 409168273 |
|
Trp53tg5 |
|
0 |
0 |
0 |
15061 |
0 |
|
n.v. |
n.v. |
n.v. |
-0.11 |
n.v. |
|
transformation related protein 53 target 5 |
| 358439497 |
|
Trpc4 |
|
0 |
0 |
0 |
19572 |
0 |
|
n.v. |
n.v. |
n.v. |
-0.16 |
n.v. |
|
short transient receptor potential channel 4 isoform 2 |
| 8394487 |
|
Trpc4 |
|
0 |
0 |
0 |
19572 |
0 |
|
n.v. |
n.v. |
n.v. |
-0.16 |
n.v. |
|
short transient receptor potential channel 4 isoform 1 |
| 6678435 |
|
Trpc5 |
|
0 |
0 |
0 |
19572 |
0 |
|
n.v. |
n.v. |
n.v. |
-0.16 |
n.v. |
|
short transient receptor potential channel 5 |
| 157824093 |
|
Trpm4 |
|
0 |
0 |
152 |
0 |
0 |
|
n.v. |
n.v. |
-0.18 |
n.v. |
n.v. |
|
transient receptor potential cation channel subfamily M
member 4 |
| 224994263 |
|
Trpt1 |
|
0 |
0 |
386 |
3544 |
0 |
|
n.v. |
n.v. |
0 |
0.03 |
n.v. |
|
tRNA 2'-phosphotransferase 1 |
| 269784723 |
|
Trpv4 |
|
13986 |
7060 |
18649 |
0 |
0 |
|
0.19 |
0.23 |
0.04 |
n.v. |
n.v. |
|
transient receptor potential cation channel subfamily V
member 4 |
| 124486949 |
|
Trrap |
|
3661 |
0 |
0 |
0 |
0 |
|
0.07 |
n.v. |
n.v. |
n.v. |
n.v. |
|
transformation/transcription domain-associated
protein |
| 21312414 |
|
Trub1 |
|
0 |
0 |
129 |
0 |
4262 |
|
n.v. |
n.v. |
0.32 |
n.v. |
0.11 |
|
probable tRNA pseudouridine synthase 1 isoform 1 |
| 268607501 |
|
Trub1 |
|
0 |
0 |
129 |
0 |
4262 |
|
n.v. |
n.v. |
0.32 |
n.v. |
0.11 |
|
probable tRNA pseudouridine synthase 1 isoform 2 |
| 224994213 |
|
Trub2 |
|
0 |
88 |
0 |
0 |
0 |
|
n.v. |
-1.89 |
n.v. |
n.v. |
n.v. |
|
probable tRNA pseudouridine synthase 2 |
| 79750409 |
|
Tsc1 |
|
0 |
0 |
0 |
966 |
225 |
|
n.v. |
n.v. |
n.v. |
0.32 |
0.17 |
|
hamartin |
| 86439987 |
|
Tsc2 |
|
0 |
0 |
411 |
1056 |
0 |
|
n.v. |
n.v. |
-0.01 |
0.09 |
n.v. |
|
tuberin isoform 1 |
| 86439992 |
|
Tsc2 |
|
0 |
0 |
411 |
1056 |
0 |
|
n.v. |
n.v. |
-0.01 |
0.09 |
n.v. |
|
tuberin isoform 2 |
| 295293202 |
|
Tsc22d1 |
|
0 |
221 |
872 |
0 |
10003 |
|
n.v. |
0.2 |
0.17 |
n.v. |
0.17 |
|
TSC22 domain family protein 1 isoform 1 |
| 295293205 |
|
Tsc22d1 |
|
0 |
221 |
872 |
0 |
10003 |
|
n.v. |
0.2 |
0.17 |
n.v. |
0.17 |
|
TSC22 domain family protein 1 isoform 3 |
| 6678315 |
|
Tsc22d1 |
|
0 |
271 |
872 |
49 |
14254 |
|
n.v. |
0.24 |
0.17 |
-0.32 |
0.17 |
|
TSC22 domain family protein 1 isoform 2 |
| 124487001 |
|
Tsc22d2 |
|
0 |
0 |
0 |
0 |
6222 |
|
n.v. |
n.v. |
n.v. |
n.v. |
0.17 |
|
TSC22 domain family protein 2 |
| 116517338 |
|
Tsc22d3 |
|
0 |
0 |
0 |
0 |
1499 |
|
n.v. |
n.v. |
n.v. |
n.v. |
0 |
|
TSC22 domain family protein 3 isoform 1 |
| 116517342 |
|
Tsc22d3 |
|
0 |
0 |
0 |
0 |
760 |
|
n.v. |
n.v. |
n.v. |
n.v. |
0.38 |
|
TSC22 domain family protein 3 isoform 2 |
| 356995846 |
|
Tsc22d4 |
|
0 |
0 |
0 |
0 |
16129 |
|
n.v. |
n.v. |
n.v. |
n.v. |
0.26 |
|
TSC22 domain family protein 4 isoform 1 |
| 75750501 |
|
Tsc22d4 |
|
0 |
0 |
0 |
0 |
16889 |
|
n.v. |
n.v. |
n.v. |
n.v. |
0.26 |
|
TSC22 domain family protein 4 isoform 2 |
| 228008361 |
|
Tsen15 |
|
0 |
19 |
0 |
1318 |
707 |
|
n.v. |
0.12 |
n.v. |
0.14 |
0.14 |
|
tRNA-splicing endonuclease subunit Sen15 |
| 255958183 |
|
Tsen34 |
|
494 |
0 |
0 |
0 |
0 |
|
0.09 |
n.v. |
n.v. |
n.v. |
n.v. |
|
tRNA-splicing endonuclease subunit Sen34 isoform a |
| 255958183;13195596 |
|
Tsen34 |
|
0 |
367 |
176 |
434 |
5569 |
|
n.v. |
0.32 |
0.17 |
-0.09 |
0.02 |
|
tRNA-splicing endonuclease subunit Sen34 isoform a |
| 255958185 |
|
Tsen34 |
|
494 |
165 |
176 |
156 |
5076 |
|
0.09 |
-1.92 |
0.17 |
0.52 |
-0.08 |
|
tRNA-splicing endonuclease subunit Sen34 isoform b |
| 108389163 |
|
Tsen54 |
|
0 |
0 |
0 |
0 |
268 |
|
n.v. |
n.v. |
n.v. |
n.v. |
-0.34 |
|
tRNA-splicing endonuclease subunit Sen54 |
| 21313468 |
|
Tsfm |
|
12961 |
5085 |
0 |
0 |
0 |
|
-0.15 |
-0.26 |
n.v. |
n.v. |
n.v. |
|
elongation factor Ts, mitochondrial precursor |
| 11230780 |
|
Tsg101 |
|
0 |
1718 |
2520 |
5124 |
22212 |
|
n.v. |
0.16 |
0.25 |
-0.02 |
0.18 |
|
tumor susceptibility gene 101 protein |
| 6755899 |
|
Tsn |
|
8897 |
5190 |
6136 |
48802 |
61676 |
|
0.26 |
0.14 |
0.03 |
0.25 |
0.02 |
|
translin |
| 8394490 |
|
Tsnax |
|
0 |
2088 |
623 |
18581 |
34870 |
|
n.v. |
0.18 |
-0.05 |
0.28 |
0.04 |
|
translin-associated protein X |
| 22122345 |
|
Tspan14 |
|
0 |
992 |
2612 |
802 |
0 |
|
n.v. |
0.21 |
-0.14 |
0.65 |
n.v. |
|
tetraspanin-14 |
| 110347498 |
|
Tspan15 |
|
0 |
0 |
16 |
0 |
0 |
|
n.v. |
n.v. |
0.4 |
n.v. |
n.v. |
|
tetraspanin-15 |
| 13385482 |
|
Tspan31 |
|
1593 |
660 |
2227 |
0 |
0 |
|
0.01 |
-0.12 |
0.07 |
n.v. |
n.v. |
|
tetraspanin-31 |
| 31560378 |
|
Tspan6 |
|
0 |
0 |
88 |
0 |
0 |
|
n.v. |
n.v. |
-0.65 |
n.v. |
n.v. |
|
tetraspanin-6 |
| 22122475 |
|
Tspan8 |
|
144489 |
86680 |
160356 |
57127 |
0 |
|
0.11 |
0 |
-0.13 |
-0.39 |
n.v. |
|
tetraspanin-8 |
| 30425124 |
|
Tspan9 |
|
0 |
144 |
484 |
0 |
0 |
|
n.v. |
0 |
-0.03 |
n.v. |
n.v. |
|
tetraspanin-9 |
| 6678445 |
|
Tspyl1 |
|
0 |
0 |
44 |
0 |
0 |
|
n.v. |
n.v. |
-0.59 |
n.v. |
n.v. |
|
testis-specific Y-encoded-like protein 1 |
| 126506294 |
|
Tsr1 |
|
0 |
0 |
716 |
17779 |
3459 |
|
n.v. |
n.v. |
0.01 |
0.31 |
0.09 |
|
pre-rRNA-processing protein TSR1 homolog |
| 257153359 |
|
Tsr2 |
|
0 |
0 |
328 |
737 |
0 |
|
n.v. |
n.v. |
0.17 |
-0.48 |
n.v. |
|
pre-rRNA-processing protein TSR2 homolog isoform 1 |
| 257196134 |
|
Tsr2 |
|
0 |
0 |
328 |
737 |
0 |
|
n.v. |
n.v. |
0.17 |
-0.48 |
n.v. |
|
pre-rRNA-processing protein TSR2 homolog isoform 2 |
| 238550175 |
|
Tssc1 |
|
0 |
1227 |
2166 |
884 |
20787 |
|
n.v. |
-0.24 |
-0.14 |
0.52 |
0.05 |
|
protein TSSC1 |
| 13654268 |
|
Tsta3 |
|
0 |
79 |
1692 |
10150 |
81842 |
|
n.v. |
0.06 |
0.01 |
0.26 |
0.18 |
|
GDP-L-fucose synthase |
| 67906805 |
|
Ttbk2 |
|
0 |
0 |
3 |
0 |
0 |
|
n.v. |
n.v. |
-0.64 |
n.v. |
n.v. |
|
tau-tubulin kinase 2 isoform 1 |
| 67906807 |
|
Ttbk2 |
|
0 |
0 |
3 |
0 |
0 |
|
n.v. |
n.v. |
-0.64 |
n.v. |
n.v. |
|
tau-tubulin kinase 2 isoform 2 |
| 20452462 |
|
Ttc1 |
|
0 |
138 |
91 |
0 |
17510 |
|
n.v. |
-0.19 |
-0.29 |
n.v. |
-0.01 |
|
tetratricopeptide repeat protein 1 |
| 27370132 |
|
Ttc12 |
|
0 |
0 |
0 |
884 |
0 |
|
n.v. |
n.v. |
n.v. |
-0.12 |
n.v. |
|
tetratricopeptide repeat protein 12 |
| 114158711 |
|
Ttc21b |
|
0 |
0 |
342 |
0 |
0 |
|
n.v. |
n.v. |
0.27 |
n.v. |
n.v. |
|
tetratricopeptide repeat protein 21B |
| 254281218 |
|
Ttc23l |
|
0 |
138 |
75 |
1367 |
653 |
|
n.v. |
0.13 |
0.36 |
0.27 |
-0.18 |
|
tetratricopeptide repeat protein 23-like |
| 42734471 |
|
Ttc26 |
|
0 |
0 |
0 |
925 |
0 |
|
n.v. |
n.v. |
n.v. |
-0.25 |
n.v. |
|
tetratricopeptide repeat protein 26 |
| 164519039 |
|
Ttc27 |
|
0 |
104 |
10 |
295 |
1628 |
|
n.v. |
-0.27 |
-0.16 |
-0.07 |
0.14 |
|
tetratricopeptide repeat protein 27 |
| 154091024 |
|
Ttc3 |
|
0 |
2 |
1403 |
8 |
0 |
|
n.v. |
1.07 |
0.15 |
-0.03 |
n.v. |
|
E3 ubiquitin-protein ligase TTC3 |
| 125988391 |
|
Ttc30a1 |
|
0 |
0 |
0 |
3446 |
0 |
|
n.v. |
n.v. |
n.v. |
-1.53 |
n.v. |
|
tetratricopeptide repeat protein 30A1 |
| 124487007 |
|
Ttc30a2 |
|
0 |
0 |
0 |
3446 |
0 |
|
n.v. |
n.v. |
n.v. |
-1.53 |
n.v. |
|
tetratricopeptide repeat protein 30A2 |
| 125988383 |
|
Ttc30b |
|
0 |
0 |
0 |
3446 |
0 |
|
n.v. |
n.v. |
n.v. |
-1.53 |
n.v. |
|
tetratricopeptide repeat protein 30B |
| 58037417 |
|
Ttc32 |
|
0 |
0 |
0 |
0 |
1103 |
|
n.v. |
n.v. |
n.v. |
n.v. |
0.36 |
|
tetratricopeptide repeat protein 32 |
| 21312920 |
|
Ttc33 |
|
0 |
17 |
25 |
3823 |
2356 |
|
n.v. |
0.77 |
0.64 |
0.32 |
0.32 |
|
tetratricopeptide repeat protein 33 |
| 225543265 |
|
Ttc34 |
|
5382 |
0 |
157 |
859 |
0 |
|
0.21 |
n.v. |
-0.25 |
0.03 |
n.v. |
|
tetratricopeptide repeat protein 34 |
| 124486883 |
|
Ttc37 |
|
0 |
0 |
2900 |
2865 |
1360 |
|
n.v. |
n.v. |
-0.01 |
-0.22 |
0.01 |
|
tetratricopeptide repeat protein 37 |
| 158517895 |
|
Ttc38 |
|
0 |
1092 |
2985 |
360 |
98924 |
|
n.v. |
0.09 |
0.03 |
0.06 |
0.05 |
|
tetratricopeptide repeat protein 38 |
| 124358948 |
|
Ttc5 |
|
0 |
0 |
2040 |
0 |
3320 |
|
n.v. |
n.v. |
0.28 |
n.v. |
0.01 |
|
tetratricopeptide repeat protein 5 isoform a |
| 29244012 |
|
Ttc5 |
|
0 |
0 |
1081 |
0 |
1017 |
|
n.v. |
n.v. |
0.31 |
n.v. |
0.24 |
|
tetratricopeptide repeat protein 5 isoform b |
| 85701652 |
|
Ttc9 |
|
0 |
0 |
0 |
0 |
5398 |
|
n.v. |
n.v. |
n.v. |
n.v. |
-0.29 |
|
tetratricopeptide repeat protein 9A |
| 110625776 |
|
Ttc9c |
|
0 |
0 |
29 |
5288 |
3159 |
|
n.v. |
n.v. |
0 |
0.2 |
0.18 |
|
tetratricopeptide repeat protein 9C |
| 111154070 |
|
Ttf1 |
|
0 |
0 |
26 |
25 |
0 |
|
n.v. |
n.v. |
-0.28 |
-0.49 |
n.v. |
|
transcription termination factor 1 |
| 254692909 |
|
Ttf2 |
|
0 |
0 |
881 |
712 |
0 |
|
n.v. |
n.v. |
-0.11 |
0.08 |
n.v. |
|
transcription termination factor 2 |
| 33859732 |
|
Tti1 |
|
0 |
0 |
281 |
3495 |
0 |
|
n.v. |
n.v. |
0.06 |
0.08 |
n.v. |
|
TELO2-interacting protein 1 homolog |
| 31542190 |
|
Tti2 |
|
0 |
0 |
176 |
941 |
878 |
|
n.v. |
n.v. |
-0.16 |
-0.18 |
0.04 |
|
TELO2-interacting protein 2 isoform a |
| 316983174 |
|
Tti2 |
|
0 |
0 |
176 |
941 |
878 |
|
n.v. |
n.v. |
-0.16 |
-0.5 |
0.04 |
|
TELO2-interacting protein 2 isoform b |
| 269954711 |
|
Ttll12 |
|
0 |
1253 |
3939 |
810 |
18281 |
|
n.v. |
0.07 |
0.03 |
0.38 |
0.19 |
|
tubulin--tyrosine ligase-like protein 12 |
| 77812697 |
|
Ttn |
|
7927 |
0 |
900 |
5648 |
0 |
|
0.12 |
n.v. |
0.18 |
-0.08 |
n.v. |
|
titin isoform N2-A |
| 77812699 |
|
Ttn |
|
7927 |
0 |
900 |
5648 |
0 |
|
0.12 |
n.v. |
0.18 |
-0.08 |
n.v. |
|
titin isoform N2-B |
| 254588052 |
|
Ttyh3 |
|
0 |
2 |
48 |
0 |
0 |
|
n.v. |
0.24 |
-0.11 |
n.v. |
n.v. |
|
protein tweety homolog 3 |
| 6755901 |
|
Tuba1a |
|
558791 |
134131 |
209531 |
1160754 |
1258656 |
|
0.12 |
-0.07 |
-0.04 |
0.01 |
0.1 |
|
tubulin alpha-1A chain |
| 34740335 |
|
Tuba1b |
|
730483 |
138335 |
207215 |
1126137 |
1272128 |
|
0.08 |
-0.07 |
-0.05 |
0 |
0.1 |
|
tubulin alpha-1B chain |
| 6678469 |
|
Tuba1c |
|
581509 |
128478 |
209600 |
1169316 |
1461601 |
|
0.1 |
-0.08 |
-0.04 |
0.01 |
0.1 |
|
tubulin alpha-1C chain |
| 6678465 |
|
Tuba3a |
|
456644 |
125476 |
141415 |
796684 |
997879 |
|
0.12 |
-0.09 |
-0.04 |
0.03 |
0.08 |
|
tubulin alpha-3 chain |
| 6678467 |
|
Tuba4a |
|
549931 |
108513 |
130009 |
644343 |
1078554 |
|
0.08 |
-0.09 |
-0.05 |
0.03 |
0.1 |
|
tubulin alpha-4A chain |
| 8394493 |
|
Tuba8 |
|
354697 |
70596 |
64793 |
532291 |
853783 |
|
0.14 |
-0.1 |
-0.02 |
0.03 |
0.07 |
|
tubulin alpha-8 chain |
| 224809300 |
|
Tubal3 |
|
3295 |
13043 |
70254 |
82748 |
220241 |
|
0.53 |
0.12 |
0.1 |
0.14 |
0.12 |
|
tubulin alpha chain-like 3 |
| 124430500 |
|
Tubb1 |
|
132828 |
35813 |
51323 |
176759 |
191272 |
|
0.1 |
0.09 |
0.01 |
0.07 |
0.17 |
|
tubulin beta-1 chain |
| 33859488 |
|
Tubb2a |
|
480972 |
107870 |
240887 |
1076402 |
636948 |
|
0.09 |
0.07 |
0 |
0 |
0.07 |
|
tubulin beta-2A chain |
| 21746161 |
|
Tubb2b |
|
480972 |
105248 |
235856 |
1076156 |
623946 |
|
0.09 |
0.07 |
0 |
0.01 |
0.07 |
|
tubulin beta-2B chain |
| 12963615 |
|
Tubb3 |
|
399437 |
104737 |
155631 |
632613 |
605901 |
|
0.14 |
0.1 |
0.01 |
0.02 |
0.07 |
|
tubulin beta-3 chain |
| 31981939 |
|
Tubb4a |
|
494244 |
139110 |
184469 |
957965 |
965922 |
|
0.09 |
0.07 |
0 |
0.01 |
0.06 |
|
tubulin beta-4A chain |
| 22165384 |
|
Tubb4b |
|
568438 |
162828 |
282374 |
1245638 |
1077055 |
|
0.09 |
0.05 |
-0.01 |
-0.01 |
0.05 |
|
tubulin beta-4B chain |
| 7106439 |
|
Tubb5 |
|
645452 |
157288 |
294588 |
1390146 |
781376 |
|
0.09 |
0.04 |
-0.01 |
-0.02 |
0.07 |
|
tubulin beta-5 chain |
| 27754056 |
|
Tubb6 |
|
290260 |
43412 |
86858 |
464023 |
510169 |
|
0.14 |
0.09 |
0.01 |
0.03 |
0.09 |
|
tubulin beta-6 chain |
| 19527242 |
|
Tubg1 |
|
0 |
1733 |
3546 |
9790 |
0 |
|
n.v. |
0.26 |
0.22 |
-0.09 |
n.v. |
|
tubulin gamma-1 chain |
| 19527246 |
|
Tubg2 |
|
0 |
1733 |
3546 |
5001 |
0 |
|
n.v. |
0.26 |
0.22 |
-0.1 |
n.v. |
|
tubulin gamma-2 chain |
| 228008297 |
|
Tubgcp2 |
|
0 |
618 |
8879 |
18499 |
0 |
|
n.v. |
0.22 |
0.26 |
0.08 |
n.v. |
|
gamma-tubulin complex component 2 |
| 39930567 |
|
Tubgcp3 |
|
0 |
635 |
1949 |
13228 |
0 |
|
n.v. |
-0.34 |
0.25 |
0.03 |
n.v. |
|
gamma-tubulin complex component 3 |
| 23943924 |
|
Tubgcp4 |
|
0 |
0 |
140 |
958 |
0 |
|
n.v. |
n.v. |
0.15 |
-0.31 |
n.v. |
|
gamma-tubulin complex component 4 |
| 46560557 |
|
Tubgcp5 |
|
0 |
0 |
167 |
25 |
0 |
|
n.v. |
n.v. |
0.49 |
-0.31 |
n.v. |
|
gamma-tubulin complex component 5 |
| 254039634 |
|
Tubgcp6 |
|
0 |
0 |
184 |
909 |
0 |
|
n.v. |
n.v. |
0.13 |
0.37 |
n.v. |
|
tubulin, gamma complex associated protein 6 |
| 254911131 |
|
Tufm |
|
214309 |
29770 |
938 |
0 |
7925 |
|
0 |
-0.12 |
-0.4 |
n.v. |
-0.05 |
|
elongation factor Tu, mitochondrial isoform 2 |
| 27370092 |
|
Tufm |
|
225969 |
36408 |
6109 |
2881 |
8461 |
|
0 |
-0.13 |
-0.13 |
0.11 |
-0.07 |
|
elongation factor Tu, mitochondrial isoform 1 |
| 124248487 |
|
Tusc3 |
|
0 |
4281 |
1317 |
0 |
0 |
|
n.v. |
-0.6 |
-0.4 |
n.v. |
n.v. |
|
tumor suppressor candidate 3 precursor |
| 37574078 |
|
Tut1 |
|
0 |
0 |
0 |
0 |
910 |
|
n.v. |
n.v. |
n.v. |
n.v. |
0.02 |
|
speckle targeted PIP5K1A-regulated poly(A)
polymerase |
| 21312930 |
|
Tvp23b |
|
0 |
0 |
47 |
0 |
0 |
|
n.v. |
n.v. |
0.19 |
n.v. |
n.v. |
|
protein FAM18B1 |
|
style='color:#061E96'>62990169 |
|
Twf1 |
|
3680 |
923 |
1845 |
105160 |
66988 |
|
0.16 |
0.02 |
0.04 |
0.03 |
-0.01 |
|
twinfilin-1 |
| 6755224 |
|
Twf2 |
|
0 |
0 |
0 |
19130 |
17617 |
|
n.v. |
n.v. |
n.v. |
-0.03 |
0.24 |
|
twinfilin-2 |
| 91598586 |
|
Txlna |
|
0 |
829 |
20950 |
5967 |
407 |
|
n.v. |
0.54 |
0.08 |
0.08 |
0.06 |
|
alpha-taxilin |
| 30725808 |
|
Txlng |
|
0 |
0 |
4 |
0 |
0 |
|
n.v. |
n.v. |
1.05 |
n.v. |
n.v. |
|
gamma-taxilin |
| 6755911 |
|
Txn1 |
|
57920 |
5701 |
11268 |
15045 |
78137 |
|
0.36 |
0.26 |
-0.01 |
-0.04 |
0.09 |
|
thioredoxin |
| 13384700 |
|
Txndc12 |
|
3112 |
3367 |
1433 |
0 |
5922 |
|
0.28 |
-0.2 |
-0.15 |
n.v. |
-0.22 |
|
thioredoxin domain-containing protein 12 precursor |
| <
style='color:#061E96'>52693935 |
|
Txndc15 |
|
0 |
10 |
25 |
0 |
0 |
|
n.v. |
-0.38 |
-0.26 |
n.v. |
n.v. |
|
thioredoxin domain-containing protein 15 precursor |
| 13386060 |
|
Txndc17 |
|
311 |
382 |
1891 |
0 |
34527 |
|
0.52 |
0.22 |
0.17 |
n.v. |
0.06 |
|
thioredoxin domain-containing protein 17 |
| 83921612 |
|
Txndc5 |
|
16951 |
10160 |
3197 |
0 |
14747 |
|
0.15 |
-0.27 |
-0.29 |
n.v. |
-0.35 |
|
thioredoxin domain-containing protein 5 precursor |
| 25286717 |
|
Txndc9 |
|
0 |
69 |
0 |
29926 |
0 |
|
n.v. |
0.27 |
n.v. |
0.06 |
n.v. |
|
thioredoxin domain-containing protein 9 |
| 254553444 |
|
Txnip |
|
0 |
257 |
350 |
0 |
0 |
|
n.v. |
0.16 |
-0.05 |
n.v. |
n.v. |
|
thioredoxin-interacting protein isoform 2 |
| 60687518 |
|
Txnip |
|
0 |
257 |
350 |
0 |
0 |
|
n.v. |
0.16 |
-0.05 |
n.v. |
n.v. |
|
thioredoxin-interacting protein isoform 1 |
| 31543902 |
|
Txnl1 |
|
0 |
9818 |
5240 |
141512 |
41971 |
|
n.v. |
0.14 |
0.07 |
0.09 |
0.14 |
|
thioredoxin-like protein 1 |
| 109255210 |
|
Txnl4a |
|
256 |
317 |
439 |
2153 |
54 |
|
0.1 |
0.13 |
-0.06 |
0.04 |
0.66 |
|
thioredoxin-like protein 4A isoform b |
| 13384656 |
|
Txnl4a |
|
256 |
317 |
439 |
2521 |
54 |
|
0.1 |
0.13 |
-0.06 |
0.06 |
0.66 |
|
thioredoxin-like protein 4A isoform a |
| 160333183 |
|
Txnl4b |
|
0 |
0 |
119 |
0 |
600 |
|
n.v. |
n.v. |
-1.89 |
n.v. |
0.06 |
|
thioredoxin-like protein 4B |
| 110224447 |
|
Txnrd1 |
|
25592 |
13790 |
25171 |
36164 |
165130 |
|
0.02 |
0.05 |
-0.05 |
0.19 |
0.03 |
|
thioredoxin reductase 1, cytoplasmic isoform 1 |
| 13569841 |
|
Txnrd1 |
|
25592 |
13790 |
25171 |
36164 |
165130 |
|
0.02 |
0.05 |
-0.05 |
0.19 |
0.03 |
|
thioredoxin reductase 1, cytoplasmic isoform 2 |
| 102468565 |
|
Txnrd2 |
|
9904 |
6444 |
896 |
3561 |
0 |
|
-0.06 |
-0.04 |
-0.01 |
-0.06 |
n.v. |
|
thioredoxin reductase 2, mitochondrial precursor |
| 296010805 |
|
Txnrd3 |
|
0 |
0 |
0 |
810 |
0 |
|
n.v. |
n.v. |
n.v. |
0.3 |
n.v. |
|
thioredoxin reductase 3 isoform 3 |
| 296010807 |
|
Txnrd3 |
|
0 |
0 |
0 |
810 |
0 |
|
n.v. |
n.v. |
n.v. |
0.3 |
n.v. |
|
thioredoxin reductase 3 isoform 4 |
| 110735449 |
|
Txnrd3 |
|
0 |
169 |
499 |
1318 |
13558 |
|
n.v. |
-2.07 |
-0.22 |
0.31 |
-0.65 |
|
thioredoxin reductase 3 isoform 2 |
| 296010803 |
|
Txnrd3 |
|
0 |
169 |
499 |
1318 |
13558 |
|
n.v. |
-2.07 |
-0.22 |
0.31 |
-0.65 |
|
thioredoxin reductase 3 isoform 1 |
| 133922607 |
|
Tyk2 |
|
0 |
543 |
1346 |
0 |
0 |
|
n.v. |
0.23 |
-0.01 |
n.v. |
n.v. |
|
non-receptor tyrosine-protein kinase TYK2 isoform 2 |
| 328887920 |
|
Tyk2 |
|
0 |
543 |
1346 |
0 |
0 |
|
n.v. |
0.23 |
-0.01 |
n.v. |
n.v. |
|
non-receptor tyrosine-protein kinase TYK2 isoform 1 |
| 46358062 |
|
Tyms |
|
0 |
169 |
78 |
0 |
12873 |
|
n.v. |
0.58 |
0.01 |
n.v. |
0.04 |
|
thymidylate synthase |
| 30725740 |
|
Tyw1 |
|
0 |
171 |
391 |
0 |
0 |
|
n.v. |
-0.72 |
-0.08 |
n.v. |
n.v. |
|
tRNA wybutosine-synthesizing protein 1 homolog isoform
2 |
| 62899041 |
|
Tyw1 |
|
0 |
171 |
391 |
0 |
0 |
|
n.v. |
-0.72 |
-0.08 |
n.v. |
n.v. |
|
tRNA wybutosine-synthesizing protein 1 homolog isoform
1 |
| 291045186 |
|
Tyw3 |
|
0 |
0 |
0 |
139 |
0 |
|
n.v. |
n.v. |
n.v. |
-0.15 |
n.v. |
|
tRNA wybutosine-synthesizing protein 3 homolog isoform
2 |
| 33859785 |
|
Tyw3 |
|
0 |
0 |
0 |
139 |
0 |
|
n.v. |
n.v. |
n.v. |
-0.15 |
n.v. |
|
tRNA wybutosine-synthesizing protein 3 homolog isoform
1 |
| 166235142 |
|
Tyw5 |
|
0 |
0 |
0 |
0 |
1285 |
|
n.v. |
n.v. |
n.v. |
n.v. |
0.66 |
|
tRNA wybutosine-synthesizing protein 5 isoform 1 |
| 166235146 |
|
Tyw5 |
|
0 |
0 |
0 |
0 |
814 |
|
n.v. |
n.v. |
n.v. |
n.v. |
0.53 |
|
tRNA wybutosine-synthesizing protein 5 isoform 2 |
| 254939700 |
|
U2af1 |
|
27441 |
207 |
1670 |
0 |
0 |
|
0.05 |
-0.42 |
-0.07 |
n.v. |
n.v. |
|
splicing factor U2AF 35 kDa subunit isoform 2 |
| 254939694 |
|
U2af1 |
|
81864 |
207 |
2106 |
8 |
0 |
|
0.02 |
-0.42 |
-0.09 |
-0.18 |
n.v. |
|
splicing factor U2AF 35 kDa subunit isoform 1 |
| 25072205 |
|
U2af1l4 |
|
0 |
0 |
1670 |
0 |
0 |
|
n.v. |
n.v. |
-0.07 |
n.v. |
n.v. |
|
splicing factor U2AF 26 kDa subunit |
| 164565377 |
|
U2af2 |
|
99310 |
2044 |
3044 |
8423 |
11 |
|
0.09 |
0.05 |
-0.05 |
-0.07 |
-0.12 |
|
splicing factor U2AF 65 kDa subunit isoform 2 |
| 327365322 |
|
U2af2 |
|
99310 |
2044 |
3044 |
8423 |
11 |
|
0.09 |
0.05 |
-0.05 |
-0.07 |
-0.12 |
|
splicing factor U2AF 65 kDa subunit isoform 1 |
| 171460908 |
|
U2surp |
|
805 |
1152 |
559 |
0 |
0 |
|
0.33 |
-0.1 |
-0.11 |
n.v. |
n.v. |
|
U2 snRNP-associated SURP motif-containing protein isoform
2 |
| 171460910 |
|
U2surp |
|
805 |
1152 |
559 |
0 |
0 |
|
0.33 |
-0.1 |
-0.11 |
n.v. |
n.v. |
|
U2 snRNP-associated SURP motif-containing protein isoform
1 |
| 28077007 |
|
Uaca |
|
494 |
0 |
0 |
237 |
0 |
|
0.34 |
n.v. |
n.v. |
-0.41 |
n.v. |
|
uveal autoantigen with coiled-coil domains and ankyrin
repeats |
| 30520375 |
|
Uap1 |
|
0 |
818 |
4380 |
0 |
22115 |
|
n.v. |
0.01 |
0 |
n.v. |
0.12 |
|
UDP-N-acetylhexosamine pyrophosphorylase |
| 377833682 |
|
Uap1 |
|
0 |
818 |
4380 |
0 |
22115 |
|
n.v. |
0.01 |
0 |
n.v. |
0.12 |
|
PREDICTED: UDP-N-acetylhexosamine pyrophosphorylase |
| 84794548 |
|
Uap1l1 |
|
0 |
3192 |
13558 |
3634 |
209146 |
|
n.v. |
0.32 |
-0.03 |
0.18 |
0.02 |
|
UDP-N-acetylhexosamine pyrophosphorylase-like protein 1 |
| 209862989 |
|
Uba1 |
|
13876 |
0 |
0 |
0 |
0 |
|
0.38 |
n.v. |
n.v. |
n.v. |
n.v. |
|
ubiquitin-like modifier-activating enzyme 1 isoform 2 |
| 209862989;6678483 |
|
Uba1 |
|
0 |
0 |
31595 |
0 |
0 |
|
n.v. |
n.v. |
0.07 |
n.v. |
n.v. |
|
ubiquitin-like modifier-activating enzyme 1 isoform 2 |
| 6678483;209862989 |
|
Uba1 |
|
0 |
3760 |
0 |
51651 |
390286 |
|
n.v. |
0.26 |
n.v. |
0.15 |
0.07 |
|
ubiquitin-like modifier-activating enzyme 1 isoform 1 |
| 444189294 |
|
Uba1 |
|
13876 |
3760 |
31595 |
51651 |
394142 |
|
0.38 |
0.26 |
0.07 |
0.15 |
0.07 |
|
ubiquitin-like modifier-activating enzyme 1 isoform 1 |
| 6755923 |
|
Uba1y |
|
2471 |
94 |
1469 |
3446 |
82046 |
|
0.77 |
0.29 |
0.17 |
0.53 |
0.22 |
|
ubiquitin-like modifier-activating enzyme 1 Y |
| 7709986 |
|
Uba2 |
|
0 |
1785 |
852 |
14865 |
71250 |
|
n.v. |
0.16 |
0.15 |
0.12 |
0.07 |
|
SUMO-activating enzyme subunit 2 |
| 162135936 |
|
Uba3 |
|
0 |
367 |
195 |
2832 |
40600 |
|
n.v. |
0.15 |
0.3 |
0.42 |
0.06 |
|
NEDD8-activating enzyme E1 catalytic subunit isoform
1 |
| 162287057 |
|
Uba3 |
|
0 |
367 |
195 |
2832 |
39272 |
|
n.v. |
0.15 |
0.3 |
0.42 |
0.06 |
|
NEDD8-activating enzyme E1 catalytic subunit isoform
2 |
| 227499242 |
|
Uba5 |
|
0 |
0 |
413 |
0 |
13987 |
|
n.v. |
n.v. |
-0.13 |
n.v. |
-0.11 |
|
ubiquitin-like modifier-activating enzyme 5 |
| 9845265 |
|
Uba52 |
|
1885025 |
50244 |
74108 |
291627 |
146013 |
|
0 |
-0.06 |
-0.1 |
-0.04 |
-0.02 |
|
ubiquitin-60S ribosomal protein L40 |
| 27370032 |
|
Uba6 |
|
0 |
0 |
1187 |
0 |
78608 |
|
n.v. |
n.v. |
0.05 |
n.v. |
0.03 |
|
ubiquitin-like modifier-activating enzyme 6 |
| 30794156 |
|
Uba7 |
|
0 |
0 |
0 |
0 |
10195 |
|
n.v. |
n.v. |
n.v. |
n.v. |
-0.11 |
|
ubiquitin-like modifier-activating enzyme 7 |
| 260447056 |
|
Ubac1 |
|
0 |
0 |
0 |
0 |
503 |
|
n.v. |
n.v. |
n.v. |
n.v. |
0.07 |
|
ubiquitin-associated domain-containing protein 1 |
| 90568036 |
|
Ubac2 |
|
0 |
0 |
183 |
0 |
0 |
|
n.v. |
n.v. |
-0.5 |
n.v. |
n.v. |
|
ubiquitin-associated domain-containing protein 2
precursor |
| 28076915 |
|
Ubap2 |
|
0 |
15 |
1102 |
0 |
161 |
|
n.v. |
0.72 |
0.33 |
n.v. |
0.07 |
|
ubiquitin-associated protein 2 |
| 260166704 |
|
Ubap2l |
|
0 |
1148 |
34845 |
499 |
2881 |
|
n.v. |
0.07 |
-0.07 |
-0.11 |
0.42 |
|
ubiquitin-associated protein 2-like isoform 3 |
| 260166706 |
|
Ubap2l |
|
0 |
1148 |
34845 |
499 |
2881 |
|
n.v. |
0.07 |
-0.07 |
-0.11 |
0.42 |
|
ubiquitin-associated protein 2-like isoform 4 |
| 260166709 |
|
Ubap2l |
|
0 |
1148 |
30588 |
483 |
2881 |
|
n.v. |
0.07 |
-0.07 |
-0.15 |
0.42 |
|
ubiquitin-associated protein 2-like isoform 2 |
| 260166711;260166713 |
|
Ubap2l |
|
0 |
1148 |
34666 |
499 |
2881 |
|
n.v. |
0.07 |
-0.08 |
-0.11 |
0.42 |
|
ubiquitin-associated protein 2-like isoform 5 |
| 260166715 |
|
Ubap2l |
|
0 |
1148 |
30588 |
483 |
2881 |
|
n.v. |
0.07 |
-0.07 |
-0.15 |
0.42 |
|
ubiquitin-associated protein 2-like isoform 6 |
| 33239421 |
|
Ubap2l |
|
0 |
1148 |
34666 |
499 |
2881 |
|
n.v. |
0.07 |
-0.08 |
-0.11 |
0.42 |
|
ubiquitin-associated protein 2-like isoform 1 |
| 6755919 |
|
Ubb |
|
1885025 |
50244 |
74108 |
291627 |
146013 |
|
0 |
-0.06 |
-0.1 |
-0.04 |
-0.02 |
|
polyubiquitin-B |
| 157671923 |
|
Ubc |
|
1885025 |
50244 |
74108 |
291627 |
146013 |
|
0 |
-0.06 |
-0.1 |
-0.04 |
-0.02 |
|
polyubiquitin-C |
| 9790041 |
|
Ube2a |
|
0 |
0 |
0 |
0 |
1606 |
|
n.v. |
n.v. |
n.v. |
n.v. |
-0.14 |
|
ubiquitin-conjugating enzyme E2 A |
| 21312888 |
|
Ube2c |
|
0 |
620 |
133 |
0 |
3395 |
|
n.v. |
0.13 |
0.25 |
n.v. |
0.08 |
|
ubiquitin-conjugating enzyme E2 C |
| 21703838 |
|
Ube2d1 |
|
604 |
0 |
0 |
3880 |
0 |
|
0.14 |
n.v. |
n.v. |
-0.04 |
n.v. |
|
ubiquitin-conjugating enzyme E2 D1 |
| 9910600 |
|
Ube2d2a |
|
8384 |
15475 |
3590 |
8857 |
32750 |
|
0.04 |
0.13 |
-0.02 |
0.11 |
0.07 |
|
ubiquitin-conjugating enzyme E2 D2 |
| 448889035 |
|
Ube2d2b |
|
7780 |
15475 |
3590 |
2832 |
32750 |
|
0.02 |
0.13 |
-0.02 |
0.19 |
0.07 |
|
ubiquitin-conjugating enzyme E2 D2B |
| 13384718 |
|
Ube2d3 |
|
8384 |
15475 |
3590 |
6712 |
32750 |
|
0.04 |
0.13 |
-0.02 |
0.04 |
0.07 |
|
ubiquitin-conjugating enzyme E2 D3 |
| 6678479 |
|
Ube2e1 |
|
0 |
424 |
76 |
401 |
2784 |
|
n.v. |
0.08 |
-0.38 |
-0.33 |
0.11 |
|
ubiquitin-conjugating enzyme E2 E1 |
| 21450233 |
|
Ube2e2 |
|
0 |
601 |
203 |
630 |
3888 |
|
n.v. |
0.12 |
-0.33 |
-0.15 |
0.02 |
|
ubiquitin-conjugating enzyme E2 E2 |
| 6678477 |
|
Ube2e3 |
|
0 |
676 |
439 |
2513 |
4016 |
|
n.v. |
0.07 |
-0.05 |
-0.2 |
0.02 |
|
ubiquitin-conjugating enzyme E2 E3 |
| 13385948 |
|
Ube2f |
|
0 |
0 |
0 |
0 |
4894 |
|
n.v. |
n.v. |
n.v. |
n.v. |
0.67 |
|
NEDD8-conjugating enzyme UBE2F |
| 27754105 |
|
Ube2g1 |
|
0 |
271 |
0 |
0 |
6351 |
|
n.v. |
-0.03 |
n.v. |
n.v. |
0.04 |
|
ubiquitin-conjugating enzyme E2 G1 |
| 281332142 |
|
Ube2h |
|
0 |
1457 |
350 |
1302 |
9307 |
|
n.v. |
0 |
-0.48 |
0.02 |
-0.16 |
|
ubiquitin-conjugating enzyme E2 H isoform 2 |
| 6678487 |
|
Ube2h |
|
0 |
1457 |
350 |
1302 |
24086 |
|
n.v. |
0 |
-0.48 |
0.02 |
-0.04 |
|
ubiquitin-conjugating enzyme E2 H isoform 1 |
| 31542956 |
|
Ube2k |
|
2709 |
15370 |
15317 |
17779 |
43673 |
|
0.12 |
0.15 |
0.01 |
-0.06 |
0.18 |
|
ubiquitin-conjugating enzyme E2 K |
| 21704162 |
|
Ube2m |
|
586 |
9661 |
4118 |
13236 |
20776 |
|
-0.22 |
0.08 |
-0.03 |
0.02 |
0.43 |
|
NEDD8-conjugating enzyme Ubc12 isoform 1 |
| 270309117 |
|
Ube2m |
|
586 |
1242 |
3960 |
3381 |
7518 |
|
-0.22 |
0.03 |
-0.05 |
-0.14 |
0.43 |
|
NEDD8-conjugating enzyme Ubc12 isoform 2 |
| 345525404 |
|
Ube2m |
|
586 |
7252 |
4118 |
12156 |
20776 |
|
-0.22 |
0.08 |
-0.03 |
0 |
0.43 |
|
NEDD8-conjugating enzyme Ubc12 isoform 3 |
| 18017605 |
|
Ube2n |
|
45857 |
47274 |
23859 |
129929 |
21290 |
|
0.03 |
0.09 |
-0.03 |
0 |
0.01 |
|
ubiquitin-conjugating enzyme E2 N |
| 50234896 |
|
Ube2o |
|
0 |
17 |
15 |
393 |
33564 |
|
n.v. |
-0.39 |
0.17 |
0.77 |
0.07 |
|
ubiquitin-conjugating enzyme E2 O |
| 170172548 |
|
Ube2q1 |
|
0 |
0 |
0 |
0 |
3106 |
|
n.v. |
n.v. |
n.v. |
n.v. |
0.02 |
|
ubiquitin-conjugating enzyme E2 Q1 |
| 257796272 |
|
Ube2q2 |
|
0 |
0 |
0 |
0 |
18452 |
|
n.v. |
n.v. |
n.v. |
n.v. |
0.02 |
|
ubiquitin-conjugating enzyme E2 Q2 |
| 13385778 |
|
Ube2r2 |
|
0 |
0 |
0 |
0 |
5719 |
|
n.v. |
n.v. |
n.v. |
n.v. |
0.09 |
|
ubiquitin-conjugating enzyme E2 R2 |
| 19527004 |
|
Ube2s |
|
0 |
758 |
479 |
3266 |
2260 |
|
n.v. |
0.12 |
-0.08 |
0.12 |
-1.67 |
|
ubiquitin-conjugating enzyme E2 S |
| 13385530 |
|
Ube2t |
|
0 |
18126 |
0 |
24786 |
4466 |
|
n.v. |
0.15 |
n.v. |
0.21 |
0.11 |
|
ubiquitin-conjugating enzyme E2 T |
| 42741690 |
|
Ube2v1 |
|
23816 |
31142 |
32063 |
54909 |
431807 |
|
-0.02 |
0.16 |
-0.02 |
0.14 |
0.03 |
|
ubiquitin-conjugating enzyme E2 variant 1 |
| 226823223 |
|
Ube2v2 |
|
21729 |
20215 |
24364 |
39806 |
106977 |
|
-0.1 |
0.16 |
-0.06 |
0.05 |
0.06 |
|
ubiquitin-conjugating enzyme E2 variant 2 isoform 2 |
| 31543918 |
|
Ube2v2 |
|
21729 |
23629 |
25330 |
42622 |
295015 |
|
-0.1 |
0.13 |
-0.03 |
0.07 |
0.05 |
|
ubiquitin-conjugating enzyme E2 variant 2 isoform 1 |
| 401891882 |
|
Ube2w |
|
0 |
0 |
0 |
0 |
139 |
|
n.v. |
n.v. |
n.v. |
n.v. |
0.18 |
|
ubiquitin-conjugating enzyme E2 W isoform 1 |
| 401891885 |
|
Ube2w |
|
0 |
0 |
0 |
0 |
139 |
|
n.v. |
n.v. |
n.v. |
n.v. |
0.18 |
|
ubiquitin-conjugating enzyme E2 W isoform 2 |
| 401901244 |
|
Ube2w |
|
0 |
0 |
0 |
0 |
139 |
|
n.v. |
n.v. |
n.v. |
n.v. |
0.18 |
|
ubiquitin-conjugating enzyme E2 W isoform 3 |
| 110681729 |
|
Ube2z |
|
0 |
1643 |
2044 |
0 |
38993 |
|
n.v. |
0.02 |
0.05 |
n.v. |
0.1 |
|
ubiquitin-conjugating enzyme E2 Z |
| 27804321 |
|
Ube3a |
|
0 |
0 |
15 |
6041 |
8632 |
|
n.v. |
n.v. |
0.43 |
0.17 |
0.12 |
|
ubiquitin-protein ligase E3A isoform 1 |
| 76880494 |
|
Ube3a |
|
0 |
0 |
15 |
6082 |
8664 |
|
n.v. |
n.v. |
0.43 |
0.18 |
0.08 |
|
ubiquitin-protein ligase E3A isoform 2 |
| 76880500 |
|
Ube3a |
|
0 |
0 |
15 |
6041 |
8632 |
|
n.v. |
n.v. |
0.43 |
0.17 |
0.12 |
|
ubiquitin-protein ligase E3A isoform 3 |
| 29789341 |
|
Ube3c |
|
0 |
0 |
0 |
3454 |
2677 |
|
n.v. |
n.v. |
n.v. |
-0.01 |
-0.11 |
|
ubiquitin-protein ligase E3C |
| 167736371 |
|
Ube4a |
|
0 |
463 |
465 |
0 |
493 |
|
n.v. |
-0.94 |
-0.14 |
n.v. |
-0.82 |
|
ubiquitin conjugation factor E4 A |
| 172073169 |
|
Ube4b |
|
0 |
0 |
28 |
16 |
9896 |
|
n.v. |
n.v. |
0.77 |
0.77 |
0.19 |
|
ubiquitin conjugation factor E4 B |
| 77917602 |
|
Ubfd1 |
|
0 |
0 |
274 |
0 |
10859 |
|
n.v. |
n.v. |
-0.14 |
n.v. |
-0.02 |
|
ubiquitin domain-containing protein UBFD1 |
| 6755925 |
|
Ubl3 |
|
110 |
440 |
888 |
0 |
0 |
|
-0.07 |
-0.07 |
-0.11 |
n.v. |
n.v. |
|
ubiquitin-like protein 3 precursor |
| 21703810 |
|
Ubl4 |
|
0 |
228 |
748 |
3553 |
12123 |
|
n.v. |
0.19 |
-0.03 |
0.39 |
0.27 |
|
ubiquitin-like protein 4A |
| 13384784 |
|
Ubl5 |
|
3496 |
63 |
1294 |
1531 |
1917 |
|
0.11 |
0.38 |
0.05 |
0.2 |
-0.08 |
|
ubiquitin-like protein 5 |
| 407261853 |
|
Ublcp1 |
|
0 |
0 |
0 |
1113 |
0 |
|
n.v. |
n.v. |
n.v. |
0.26 |
n.v. |
|
PREDICTED: ubiquitin-like domain containing CTD
phosphatase 1 |
| 46575895 |
|
Ublcp1 |
|
0 |
96 |
588 |
4723 |
5869 |
|
n.v. |
0.53 |
-0.06 |
0.3 |
0.38 |
|
ubiquitin-like domain-containing CTD phosphatase 1 |
| 134032032 |
|
Ubp1 |
|
0 |
372 |
0 |
246 |
0 |
|
n.v. |
0.06 |
n.v. |
-0.75 |
n.v. |
|
upstream-binding protein 1 isoform a |
| 7305605 |
|
Ubp1 |
|
0 |
372 |
0 |
246 |
0 |
|
n.v. |
0.06 |
n.v. |
-0.75 |
n.v. |
|
upstream-binding protein 1 isoform b |
| 22726191 |
|
Ubqln1 |
|
0 |
703 |
2767 |
262 |
6415 |
|
n.v. |
0.38 |
0.12 |
0.28 |
0.07 |
|
ubiquilin-1 isoform 2 |
| 295054230 |
|
Ubqln1 |
|
0 |
703 |
2767 |
262 |
6415 |
|
n.v. |
0.38 |
0.12 |
0.28 |
0.07 |
|
ubiquilin-1 isoform 1 |
| 34328236 |
|
Ubqln2 |
|
0 |
1244 |
3585 |
6180 |
19705 |
|
n.v. |
-0.24 |
0.09 |
-0.45 |
0.01 |
|
ubiquilin-2 |
| 15805016 |
|
Ubqln4 |
|
0 |
0 |
1607 |
65 |
6640 |
|
n.v. |
n.v. |
0.09 |
0.41 |
0.01 |
|
ubiquilin-4 |
| 154091026 |
|
Ubr1 |
|
0 |
0 |
0 |
0 |
4809 |
|
n.v. |
n.v. |
n.v. |
n.v. |
0.14 |
|
E3 ubiquitin-protein ligase UBR1 |
| 293651567 |
|
Ubr2 |
|
0 |
0 |
37 |
769 |
9296 |
|
n.v. |
n.v. |
0.1 |
0.49 |
0.04 |
|
E3 ubiquitin-protein ligase UBR2 isoform 2 |
| 58615693 |
|
Ubr2 |
|
0 |
0 |
37 |
769 |
9296 |
|
n.v. |
n.v. |
0.1 |
0.49 |
0.04 |
|
E3 ubiquitin-protein ligase UBR2 isoform 1 |
| 160948616 |
|
Ubr3 |
|
0 |
0 |
0 |
0 |
3063 |
|
n.v. |
n.v. |
n.v. |
n.v. |
0.21 |
|
E3 ubiquitin-protein ligase UBR3 isoform 1 |
| 160948614 |
|
Ubr3 |
|
0 |
0 |
0 |
115 |
5365 |
|
n.v. |
n.v. |
n.v. |
0.46 |
0.17 |
|
E3 ubiquitin-protein ligase UBR3 isoform 2 |
| 237820660 |
|
Ubr4 |
|
0 |
3042 |
6289 |
427098 |
8075 |
|
n.v. |
0.23 |
0.01 |
0.09 |
-0.19 |
|
E3 ubiquitin-protein ligase UBR4 |
| 163310751 |
|
Ubr5 |
|
0 |
0 |
0 |
23525 |
0 |
|
n.v. |
n.v. |
n.v. |
0.25 |
n.v. |
|
E3 ubiquitin-protein ligase UBR5 isoform 1 |
| 163310753 |
|
Ubr5 |
|
0 |
0 |
0 |
23525 |
0 |
|
n.v. |
n.v. |
n.v. |
0.25 |
n.v. |
|
E3 ubiquitin-protein ligase UBR5 isoform 2 |
| 29789154 |
|
Ubr7 |
|
0 |
0 |
0 |
0 |
12873 |
|
n.v. |
n.v. |
n.v. |
n.v. |
0.17 |
|
putative E3 ubiquitin-protein ligase UBR7 |
| 21703984 |
|
Ubtd1 |
|
0 |
845 |
193 |
0 |
0 |
|
n.v. |
-0.89 |
-1.58 |
n.v. |
n.v. |
|
ubiquitin domain-containing protein 1 |
| 40254263 |
|
Ubtd2 |
|
0 |
522 |
193 |
0 |
0 |
|
n.v. |
-2.26 |
-1.58 |
n.v. |
n.v. |
|
ubiquitin domain-containing protein 2 |
| 113205053 |
|
Ubtf |
|
0 |
2964 |
241 |
0 |
0 |
|
n.v. |
0.16 |
0.23 |
n.v. |
n.v. |
|
nucleolar transcription factor 1 isoform 2 |
| 113205057 |
|
Ubtf |
|
0 |
2964 |
241 |
0 |
0 |
|
n.v. |
0.16 |
0.23 |
n.v. |
n.v. |
|
nucleolar transcription factor 1 isoform 1 |
| 22122591 |
|
Ubxn1 |
|
0 |
868 |
827 |
7302 |
48707 |
|
n.v. |
0.57 |
-0.04 |
0.2 |
0.14 |
|
UBX domain-containing protein 1 |
| 85861252 |
|
Ubxn4 |
|
2014 |
411 |
852 |
0 |
5751 |
|
0.1 |
-0.37 |
-0.24 |
n.v. |
-0.6 |
|
UBX domain-containing protein 4 |
| 13277354 |
|
Ubxn6 |
|
0 |
94 |
25 |
14865 |
2463 |
|
n.v. |
0.11 |
0.35 |
0.16 |
-0.13 |
|
UBX domain-containing protein 6 |
| 268839673 |
|
Ubxn7 |
|
0 |
630 |
171 |
0 |
6993 |
|
n.v. |
0.21 |
-0.07 |
n.v. |
0.13 |
|
UBX domain-containing protein 7 |
| 139948802 |
|
Uchl3 |
|
732 |
3929 |
3781 |
278 |
127207 |
|
-0.41 |
0.1 |
0.04 |
0.13 |
0.13 |
|
ubiquitin carboxyl-terminal hydrolase isozyme L3 |
| 15809026 |
|
Uchl4 |
|
732 |
1714 |
2426 |
278 |
61055 |
|
-0.41 |
0.12 |
0.02 |
0.13 |
0.13 |
|
ubiquitin carboxyl-terminal hydrolase isozyme L4 |
| 229577281 |
|
Uchl5 |
|
0 |
267 |
688 |
45479 |
2517 |
|
n.v. |
0.17 |
0.07 |
0.21 |
0.31 |
|
ubiquitin carboxyl-terminal hydrolase isozyme L5 isoform
1 |
| 229577283 |
|
Uchl5 |
|
0 |
267 |
688 |
45479 |
2517 |
|
n.v. |
0.17 |
0.07 |
0.21 |
0.31 |
|
ubiquitin carboxyl-terminal hydrolase isozyme L5 isoform
2 |
| 227498248 |
|
Uck1 |
|
0 |
0 |
0 |
0 |
7679 |
|
n.v. |
n.v. |
n.v. |
n.v. |
0 |
|
uridine-cytidine kinase 1 |
| 13507680 |
|
Uck2 |
|
0 |
0 |
0 |
1784 |
8021 |
|
n.v. |
n.v. |
n.v. |
-0.19 |
-0.02 |
|
uridine-cytidine kinase 2 |
| 31541796 |
|
Uckl1 |
|
0 |
0 |
0 |
4625 |
1124 |
|
n.v. |
n.v. |
n.v. |
0.05 |
0.03 |
|
uridine-cytidine kinase-like 1 |
| 104294890 |
|
Uevld |
|
0 |
4697 |
4106 |
12884 |
13558 |
|
n.v. |
0.23 |
0.21 |
0.01 |
-0.21 |
|
ubiquitin-conjugating enzyme E2 variant 3 |
| 13384768 |
|
Ufc1 |
|
0 |
265 |
0 |
0 |
2003 |
|
n.v. |
0.54 |
n.v. |
n.v. |
0.18 |
|
ubiquitin-fold modifier-conjugating enzyme 1 |
| 257153392 |
|
Ufd1l |
|
0 |
0 |
246 |
12548 |
16471 |
|
n.v. |
n.v. |
0.04 |
0.26 |
0.3 |
|
ubiquitin fusion degradation protein 1 homolog |
| 227330590 |
|
Ufl1 |
|
0 |
123 |
28 |
0 |
0 |
|
n.v. |
-1.34 |
-0.04 |
n.v. |
n.v. |
|
E3 UFM1-protein ligase 1 |
| 13385932 |
|
Ufm1 |
|
0 |
0 |
260 |
0 |
0 |
|
n.v. |
n.v. |
0.14 |
n.v. |
n.v. |
|
ubiquitin-fold modifier 1 precursor |
| 20149754 |
|
Ufsp2 |
|
0 |
1040 |
320 |
0 |
0 |
|
n.v. |
-0.38 |
-0.27 |
n.v. |
n.v. |
|
ufm1-specific protease 2 |
| 6678499 |
|
Ugdh |
|
0 |
3154 |
7944 |
96066 |
67984 |
|
n.v. |
0.13 |
-0.01 |
0.1 |
-0.09 |
|
UDP-glucose 6-dehydrogenase |
| 236466498 |
|
Uggt1 |
|
27605 |
236 |
12050 |
892 |
5772 |
|
0.14 |
-0.05 |
-0.3 |
-1.2 |
0.08 |
|
UDP-glucose:glycoprotein glucosyltransferase 1 precursor |
| 158749642 |
|
Uggt2 |
|
0 |
637 |
0 |
0 |
0 |
|
n.v. |
0.13 |
n.v. |
n.v. |
n.v. |
|
UDP-glucose:glycoprotein glucosyltransferase 2 precursor |
| 21314832 |
|
Ugp2 |
|
0 |
4657 |
5695 |
37441 |
55722 |
|
n.v. |
0.13 |
0.07 |
0.4 |
-0.08 |
|
UTP--glucose-1-phosphate uridylyltransferase |
| 31543926 |
|
Ugt8a |
|
0 |
488 |
208 |
0 |
0 |
|
n.v. |
-0.13 |
-0.32 |
n.v. |
n.v. |
|
2-hydroxyacylsphingosine 1-beta-galactosyltransferase
precursor |
| 161621269 |
|
Uhrf1 |
|
34122 |
0 |
0 |
0 |
0 |
|
0.1 |
n.v. |
n.v. |
n.v. |
n.v. |
|
E3 ubiquitin-protein ligase UHRF1 isoform A |
| 162287241 |
|
Uhrf1 |
|
34122 |
0 |
0 |
0 |
0 |
|
0.1 |
n.v. |
n.v. |
n.v. |
n.v. |
|
E3 ubiquitin-protein ligase UHRF1 isoform B |
| 124107591 |
|
Uhrf1bp1 |
|
0 |
0 |
70 |
8988 |
0 |
|
n.v. |
n.v. |
-0.62 |
0.22 |
n.v. |
|
UHRF1 (ICBP90) binding protein 1 |
| 33859498 |
|
Umps |
|
1318 |
10118 |
17899 |
47591 |
173398 |
|
0.15 |
0.09 |
0 |
0.13 |
0.23 |
|
uridine 5'-monophosphate synthase |
| 6755939 |
|
Unc119 |
|
0 |
0 |
0 |
0 |
364 |
|
n.v. |
n.v. |
n.v. |
n.v. |
0.28 |
|
protein unc-119 homolog A |
| 30425054 |
|
Unc119b |
|
0 |
1338 |
291 |
13506 |
22169 |
|
n.v. |
0.36 |
-0.1 |
0.15 |
0.07 |
|
protein unc-119 homolog B |
| 124487217 |
|
Unc13c |
|
0 |
0 |
0 |
172 |
0 |
|
n.v. |
n.v. |
n.v. |
-6.36 |
n.v. |
|
protein unc-13 homolog C |
| 62243588 |
|
Unc13d |
|
0 |
0 |
1 |
0 |
0 |
|
n.v. |
n.v. |
-1.01 |
n.v. |
n.v. |
|
protein unc-13 homolog D |
| 227908790 |
|
Unc45a |
|
0 |
1334 |
4952 |
10911 |
546 |
|
n.v. |
-0.35 |
0.21 |
-0.15 |
-0.02 |
|
protein unc-45 homolog A |
| 313661493 |
|
Unc79 |
|
0 |
0 |
66 |
0 |
0 |
|
n.v. |
n.v. |
-0.04 |
n.v. |
n.v. |
|
protein unc-79 homolog |
| 101943608 |
|
Ung |
|
0 |
0 |
0 |
344 |
54 |
|
n.v. |
n.v. |
n.v. |
-0.39 |
-0.19 |
|
uracil-DNA glycosylase isoform a |
| 27369808 |
|
Unk |
|
0 |
38 |
2728 |
0 |
0 |
|
n.v. |
-0.23 |
0.37 |
n.v. |
n.v. |
|
RING finger protein unkempt homolog |
| 170784811 |
|
Upf1 |
|
5711 |
7895 |
104742 |
62448 |
3331 |
|
0.04 |
0.05 |
0.16 |
0.14 |
0.15 |
|
regulator of nonsense transcripts 1 isoform b |
| 170784813 |
|
Upf1 |
|
5711 |
7895 |
104742 |
62448 |
3331 |
|
0.04 |
0.05 |
0.16 |
0.14 |
0.15 |
|
regulator of nonsense transcripts 1 isoform a |
| 124487283 |
|
Upf2 |
|
0 |
0 |
1573 |
745 |
0 |
|
n.v. |
n.v. |
0.21 |
0.17 |
n.v. |
|
regulator of nonsense transcripts 2 |
| 74959788 |
|
Upf3b |
|
0 |
0 |
890 |
3217 |
0 |
|
n.v. |
n.v. |
0.19 |
0.13 |
n.v. |
|
regulator of nonsense transcripts 3B |
| 58037127 |
|
Upk1a |
|
1135 |
3200 |
1488 |
0 |
0 |
|
0 |
-0.62 |
-0.7 |
n.v. |
n.v. |
|
uroplakin-1a |
| 121949819 |
|
Upk2 |
|
0 |
0 |
198 |
0 |
0 |
|
n.v. |
n.v. |
-0.57 |
n.v. |
n.v. |
|
uroplakin-2 precursor |
| 124487135 |
|
Uprt |
|
0 |
0 |
0 |
3143 |
0 |
|
n.v. |
n.v. |
n.v. |
0.08 |
n.v. |
|
uracil phosphoribosyltransferase homolog |
| 213512915 |
|
Uqcc1 |
|
12796 |
4484 |
555 |
0 |
0 |
|
-0.04 |
-0.11 |
-0.26 |
n.v. |
n.v. |
|
ubiquinol-cytochrome c reductase complex chaperone CBP3
homolog |
| 13385560 |
|
Uqcc2 |
|
567 |
2737 |
0 |
0 |
0 |
|
-0.29 |
0.33 |
n.v. |
n.v. |
n.v. |
|
mitochondrial nucleoid factor 1 |
| 37574048 |
|
Uqcr10 |
|
33244 |
6663 |
524 |
0 |
0 |
|
0.01 |
-0.08 |
-0.35 |
n.v. |
n.v. |
|
cytochrome b-c1 complex subunit 9 |
| 13385112 |
|
Uqcr11 |
|
696 |
0 |
28 |
0 |
0 |
|
0.4 |
n.v. |
-0.19 |
n.v. |
n.v. |
|
cytochrome b-c1 complex subunit 10 |
| 13385726 |
|
Uqcrb |
|
10984 |
6409 |
752 |
0 |
0 |
|
-0.07 |
-0.11 |
-0.25 |
n.v. |
n.v. |
|
cytochrome b-c1 complex subunit 7 |
| 46593021 |
|
Uqcrc1 |
|
331247 |
89642 |
19786 |
0 |
0 |
|
0 |
-0.09 |
-0.31 |
n.v. |
n.v. |
|
cytochrome b-c1 complex subunit 1, mitochondrial
precursor |
| 22267442 |
|
Uqcrc2 |
|
343549 |
67917 |
19834 |
598 |
0 |
|
-0.05 |
-0.13 |
-0.32 |
1 |
n.v. |
|
cytochrome b-c1 complex subunit 2, mitochondrial
precursor |
| 13385168 |
|
Uqcrfs1 |
|
36429 |
14105 |
157 |
0 |
0 |
|
-0.09 |
-0.25 |
0.18 |
n.v. |
n.v. |
|
cytochrome b-c1 complex subunit Rieske, mitochondrial |
| 21539599 |
|
Uqcrh |
|
4760 |
466 |
0 |
0 |
0 |
|
-0.07 |
-0.78 |
n.v. |
n.v. |
n.v. |
|
cytochrome b-c1 complex subunit 6, mitochondrial |
| 21539585 |
|
Uqcrq |
|
5217 |
443 |
312 |
0 |
0 |
|
0.35 |
-0.15 |
-0.26 |
n.v. |
n.v. |
|
cytochrome b-c1 complex subunit 8 |
| 256818750 |
|
Urb1 |
|
2087 |
0 |
559 |
3070 |
0 |
|
-0.09 |
n.v. |
-0.03 |
0.18 |
n.v. |
|
nucleolar pre-ribosomal-associated protein 1 |
| 71274162 |
|
Urb2 |
|
0 |
0 |
773 |
0 |
0 |
|
n.v. |
n.v. |
-0.29 |
n.v. |
n.v. |
|
unhealthy ribosome biogenesis protein 2 homolog |
| 110347606 |
|
Urod |
|
0 |
0 |
331 |
0 |
62458 |
|
n.v. |
n.v. |
-0.05 |
n.v. |
0.14 |
|
uroporphyrinogen decarboxylase |
| 6678519 |
|
Uros |
|
0 |
0 |
0 |
0 |
11963 |
|
n.v. |
n.v. |
n.v. |
n.v. |
-0.13 |
|
uroporphyrinogen-III synthase |
| 21630259 |
|
Use1 |
|
110 |
0 |
0 |
0 |
0 |
|
0.03 |
n.v. |
n.v. |
n.v. |
n.v. |
|
vesicle transport protein USE1 isoform 1 |
| 224809387 |
|
Use1 |
|
110 |
0 |
0 |
0 |
0 |
|
0.03 |
n.v. |
n.v. |
n.v. |
n.v. |
|
vesicle transport protein USE1 isoform 3 |
| 254911001 |
|
Ush1c |
|
0 |
2 |
0 |
0 |
0 |
|
n.v. |
0.6 |
n.v. |
n.v. |
n.v. |
|
harmonin isoform b3 |
| 254911003 |
|
Ush1c |
|
0 |
2 |
0 |
0 |
0 |
|
n.v. |
0.6 |
n.v. |
n.v. |
n.v. |
|
harmonin isoform a1 |
| 254911005 |
|
Ush1c |
|
0 |
2 |
0 |
0 |
0 |
|
n.v. |
0.6 |
n.v. |
n.v. |
n.v. |
|
harmonin isoform b4 |
| 23956096 |
|
Uso1 |
|
14315 |
9999 |
22990 |
16093 |
79614 |
|
0.16 |
0.03 |
-0.05 |
-0.04 |
-0.03 |
|
general vesicular transport factor p115 |
| 6678493 |
|
Usp10 |
|
0 |
0 |
25058 |
7948 |
0 |
|
n.v. |
n.v. |
0.04 |
0.52 |
n.v. |
|
ubiquitin carboxyl-terminal hydrolase 10 |
| 164663834 |
|
Usp11 |
|
0 |
0 |
0 |
0 |
2367 |
|
n.v. |
n.v. |
n.v. |
n.v. |
-0.25 |
|
ubiquitin carboxyl-terminal hydrolase 11 |
| 34328057 |
|
Usp12 |
|
0 |
0 |
53 |
0 |
0 |
|
n.v. |
n.v. |
0.06 |
n.v. |
n.v. |
|
ubiquitin carboxyl-terminal hydrolase 12 |
| 31560313 |
|
Usp14 |
|
0 |
4031 |
4566 |
157916 |
5944 |
|
n.v. |
-0.02 |
0.01 |
0.07 |
-0.23 |
|
ubiquitin carboxyl-terminal hydrolase 14 isoform 1 |
| 84452155 |
|
Usp14 |
|
0 |
4031 |
4566 |
153700 |
5944 |
|
n.v. |
-0.02 |
0.01 |
0.07 |
-0.23 |
|
ubiquitin carboxyl-terminal hydrolase 14 isoform 2 |
| 21489969 |
|
Usp15 |
|
0 |
0 |
250 |
6352 |
34003 |
|
n.v. |
n.v. |
0.21 |
0.16 |
0.1 |
|
ubiquitin carboxyl-terminal hydrolase 15 |
| 251823802 |
|
Usp16 |
|
0 |
0 |
47 |
1285 |
0 |
|
n.v. |
n.v. |
0.16 |
0.01 |
n.v. |
|
ubiquitin carboxyl-terminal hydrolase 16 |
| 112983634 |
|
Usp17ld |
|
0 |
0 |
597 |
0 |
0 |
|
n.v. |
n.v. |
0.08 |
n.v. |
n.v. |
|
deubiquitinating enzyme 2a |
| 270265841 |
|
Usp19 |
|
0 |
96 |
219 |
344 |
8450 |
|
n.v. |
-0.1 |
0.04 |
-0.13 |
0.21 |
|
ubiquitin carboxyl-terminal hydrolase 19 isoform 1 |
| 270265843 |
|
Usp19 |
|
0 |
96 |
219 |
344 |
8450 |
|
n.v. |
-0.1 |
0.04 |
-0.13 |
0.21 |
|
ubiquitin carboxyl-terminal hydrolase 19 isoform 2 |
| 270265845 |
|
Usp19 |
|
0 |
96 |
219 |
344 |
8450 |
|
n.v. |
-0.1 |
0.04 |
-0.13 |
0.21 |
|
ubiquitin carboxyl-terminal hydrolase 19 isoform 3 |
| 270265848 |
|
Usp19 |
|
0 |
96 |
219 |
344 |
8450 |
|
n.v. |
-0.1 |
0.04 |
-0.13 |
0.21 |
|
ubiquitin carboxyl-terminal hydrolase 19 isoform 4 |
| 270265851 |
|
Usp19 |
|
0 |
96 |
219 |
344 |
8450 |
|
n.v. |
-0.1 |
0.04 |
-0.13 |
0.21 |
|
ubiquitin carboxyl-terminal hydrolase 19 isoform 5 |
| 260064007 |
|
Usp24 |
|
0 |
0 |
790 |
712 |
535 |
|
n.v. |
n.v. |
-0.11 |
0.08 |
-0.35 |
|
ubiquitin carboxyl-terminal hydrolase 24 |
| 31980712 |
|
Usp25 |
|
0 |
0 |
0 |
0 |
8942 |
|
n.v. |
n.v. |
n.v. |
n.v. |
0.12 |
|
ubiquitin carboxyl-terminal hydrolase 25 |
| 126032299 |
|
Usp32 |
|
0 |
0 |
10 |
0 |
0 |
|
n.v. |
n.v. |
-0.22 |
n.v. |
n.v. |
|
ubiquitin specific protease 32 |
| 357527386 |
|
Usp34 |
|
0 |
0 |
0 |
5198 |
236 |
|
n.v. |
n.v. |
n.v. |
0.24 |
-0.08 |
|
ubiquitin carboxyl-terminal hydrolase 34 |
| 226442882 |
|
Usp36 |
|
0 |
0 |
0 |
0 |
300 |
|
n.v. |
n.v. |
n.v. |
n.v. |
-0.18 |
|
ubiquitin carboxyl-terminal hydrolase 36 |
| 34328301 |
|
Usp38 |
|
0 |
0 |
0 |
0 |
514 |
|
n.v. |
n.v. |
n.v. |
n.v. |
0.25 |
|
ubiquitin carboxyl-terminal hydrolase 38 |
| 20070404 |
|
Usp39 |
|
4339 |
453 |
3519 |
16379 |
0 |
|
-0.09 |
0.03 |
-0.05 |
0.01 |
n.v. |
|
U4/U6.U5 tri-snRNP-associated protein 2 |
| 164519045 |
|
Usp4 |
|
0 |
0 |
189 |
0 |
33724 |
|
n.v. |
n.v. |
0.49 |
n.v. |
0.18 |
|
ubiquitin carboxyl-terminal hydrolase 4 |
| 312836847 |
|
Usp47 |
|
0 |
0 |
102 |
0 |
48000 |
|
n.v. |
n.v. |
0.3 |
n.v. |
0.06 |
|
ubiquitin carboxyl-terminal hydrolase 47 isoform 1 |
| 48928014 |
|
Usp47 |
|
0 |
0 |
102 |
0 |
48000 |
|
n.v. |
n.v. |
0.3 |
n.v. |
0.06 |
|
ubiquitin carboxyl-terminal hydrolase 47 isoform 2 |
| 7305619 |
|
Usp5 |
|
0 |
4968 |
3810 |
1784 |
81671 |
|
n.v. |
-0.09 |
0 |
-1.21 |
0.04 |
|
ubiquitin carboxyl-terminal hydrolase 5 |
| 154146209 |
|
Usp7 |
|
1281 |
1887 |
3673 |
55514 |
51395 |
|
-0.25 |
0.04 |
-0.03 |
0.01 |
0.03 |
|
ubiquitin carboxyl-terminal hydrolase 7 |
| 31981044 |
|
Usp8 |
|
0 |
161 |
0 |
319 |
7936 |
|
n.v. |
0.23 |
n.v. |
0.27 |
0.04 |
|
ubiquitin carboxyl-terminal hydrolase 8 isoform 2 |
| 357588457 |
|
Usp8 |
|
0 |
161 |
0 |
319 |
7936 |
|
n.v. |
0.23 |
n.v. |
0.27 |
0.04 |
|
ubiquitin carboxyl-terminal hydrolase 8 isoform 1 |
| 115511018 |
|
Usp9x |
|
0 |
1215 |
5979 |
68210 |
85494 |
|
n.v. |
0.19 |
0.04 |
0.15 |
0.04 |
|
probable ubiquitin carboxyl-terminal hydrolase FAF-X |
| 120300980 |
|
Usp9y |
|
0 |
520 |
1037 |
13310 |
26238 |
|
n.v. |
0.27 |
0.02 |
0.17 |
0.08 |
|
ubiquitin specific peptidase 9, Y chromosome |
| 169646253 |
|
Uspl1 |
|
714 |
0 |
0 |
0 |
0 |
|
-0.18 |
n.v. |
n.v. |
n.v. |
n.v. |
|
SUMO-specific isopeptidase USPL1 isoform A |
| 169646335 |
|
Uspl1 |
|
714 |
0 |
0 |
0 |
0 |
|
-0.18 |
n.v. |
n.v. |
n.v. |
n.v. |
|
SUMO-specific isopeptidase USPL1 isoform B |
| 558472807 |
|
Uspl1 |
|
714 |
0 |
0 |
0 |
0 |
|
-0.18 |
n.v. |
n.v. |
n.v. |
n.v. |
|
SUMO-specific isopeptidase USPL1 isoform E |
| 110556631 |
|
Ust |
|
0 |
0 |
110 |
0 |
0 |
|
n.v. |
n.v. |
-0.24 |
n.v. |
n.v. |
|
uronyl 2-sulfotransferase |
| 30725776 |
|
Utp15 |
|
0 |
0 |
60 |
0 |
0 |
|
n.v. |
n.v. |
-0.39 |
n.v. |
n.v. |
|
U3 small nucleolar RNA-associated protein 15 homolog |
| 226437674 |
|
Utp20 |
|
0 |
2743 |
3098 |
0 |
32461 |
|
n.v. |
0.25 |
0.16 |
n.v. |
-0.02 |
|
small subunit processome component 20 homolog |
| 12746430 |
|
Utp3 |
|
1190 |
0 |
0 |
0 |
0 |
|
-0.19 |
n.v. |
n.v. |
n.v. |
n.v. |
|
something about silencing protein 10 |
| 110431378 |
|
Utrn |
|
4888 |
5977 |
17554 |
3495 |
15379 |
|
0.26 |
-0.04 |
0.03 |
-0.53 |
-0.3 |
|
utrophin |
| 6755931 |
|
Uts2 |
|
0 |
0 |
0 |
0 |
1596 |
|
n.v. |
n.v. |
n.v. |
n.v. |
-0.34 |
|
urotensin-2 precursor |
| 170671724 |
|
Uvrag |
|
0 |
0 |
852 |
0 |
0 |
|
n.v. |
n.v. |
0.06 |
n.v. |
n.v. |
|
UV radiation resistance associated |
| 28076899 |
|
Uxs1 |
|
0 |
15 |
0 |
0 |
0 |
|
n.v. |
-0.54 |
n.v. |
n.v. |
n.v. |
|
UDP-glucuronic acid decarboxylase 1 |
| 30841023 |
|
Uxt |
|
0 |
58 |
119 |
2996 |
150 |
|
n.v. |
-0.14 |
-0.33 |
0.14 |
0.08 |
|
protein UXT |
| 31542488 |
|
Vac14 |
|
915 |
2259 |
3130 |
60982 |
4766 |
|
-0.19 |
0.25 |
0.08 |
0.1 |
0.08 |
|
protein VAC14 homolog |
| 123702073 |
|
Vamp1 |
|
3002 |
73 |
2353 |
0 |
0 |
|
-0.06 |
-0.03 |
-0.11 |
n.v. |
n.v. |
|
vesicle-associated membrane protein 1 isoform b |
| 6678549 |
|
Vamp1 |
|
3002 |
73 |
2353 |
0 |
0 |
|
-0.06 |
-0.03 |
-0.11 |
n.v. |
n.v. |
|
vesicle-associated membrane protein 1 isoform a |
| 6678551 |
|
Vamp2 |
|
27496 |
6027 |
12526 |
20104 |
0 |
|
-0.32 |
0 |
0 |
-0.85 |
n.v. |
|
vesicle-associated membrane protein 2 |
| 6678553 |
|
Vamp3 |
|
28997 |
6058 |
13007 |
21667 |
0 |
|
-0.27 |
0 |
0.02 |
-0.31 |
n.v. |
|
vesicle-associated membrane protein 3 |
| 31543938 |
|
Vamp4 |
|
0 |
701 |
20 |
0 |
0 |
|
n.v. |
-0.22 |
-0.31 |
n.v. |
n.v. |
|
vesicle-associated membrane protein 4 |
| 124001562;8394526 |
|
Vamp5 |
|
0 |
33 |
82 |
0 |
0 |
|
n.v. |
-0.76 |
-0.18 |
n.v. |
n.v. |
|
vesicle-associated membrane protein 5 |
| 33468929 |
|
Vamp7 |
|
0 |
2046 |
2523 |
3364 |
0 |
|
n.v. |
-0.15 |
-0.06 |
-0.44 |
n.v. |
|
vesicle-associated membrane protein 7 |
| 31980629 |
|
Vamp8 |
|
14352 |
8972 |
13932 |
10232 |
0 |
|
0.08 |
0.09 |
-0.03 |
-0.22 |
n.v. |
|
vesicle-associated membrane protein 8 |
| 260099697 |
|
Vangl1 |
|
0 |
1626 |
7618 |
442 |
0 |
|
n.v. |
0.39 |
-0.06 |
0.36 |
n.v. |
|
vang-like protein 1 |
| 260099699 |
|
Vangl1 |
|
0 |
1626 |
5199 |
442 |
0 |
|
n.v. |
0.39 |
-0.04 |
0.36 |
n.v. |
|
vang-like protein 1 isoform 2 |
| 94721328 |
|
Vapa |
|
142055 |
14510 |
6737 |
6786 |
3116 |
|
0.06 |
-0.26 |
-0.13 |
-0.48 |
-0.49 |
|
vesicle-associated membrane protein-associated protein
A |
| 31543940 |
|
Vapb |
|
83842 |
14327 |
11392 |
6958 |
3116 |
|
0.02 |
-0.3 |
-0.27 |
-0.46 |
-0.49 |
|
vesicle-associated membrane protein-associated protein
B |
| 255069795 |
|
Vars |
|
92372 |
26530 |
67804 |
1419892 |
179663 |
|
0.12 |
0.1 |
-0.01 |
0.04 |
-0.11 |
|
valine--tRNA ligase |
| 160333671 |
|
Vars2 |
|
0 |
35 |
0 |
0 |
0 |
|
n.v. |
-1.05 |
n.v. |
n.v. |
n.v. |
|
valine--tRNA ligase, mitochondrial precursor |
| 31981693 |
|
Vasn |
|
0 |
0 |
0 |
0 |
75 |
|
n.v. |
n.v. |
n.v. |
n.v. |
0.26 |
|
vasorin precursor |
| 530537260 |
|
Vasp |
|
2014 |
0 |
0 |
0 |
0 |
|
-0.05 |
n.v. |
n.v. |
n.v. |
n.v. |
|
vasodilator-stimulated phosphoprotein isoform 2 |
| 530537263 |
|
Vasp |
|
2014 |
0 |
0 |
0 |
0 |
|
-0.05 |
n.v. |
n.v. |
n.v. |
n.v. |
|
vasodilator-stimulated phosphoprotein isoform 3 |
| 160707909 |
|
Vasp |
|
2014 |
1035 |
637 |
2939 |
4605 |
|
-0.05 |
0.12 |
0.07 |
0.12 |
0.21 |
|
vasodilator-stimulated phosphoprotein isoform 1 |
| 33859662 |
|
Vat1 |
|
24768 |
23021 |
57473 |
106224 |
85687 |
|
0.03 |
0.14 |
0.04 |
0.02 |
-0.14 |
|
synaptic vesicle membrane protein VAT-1 homolog |
| 6678555 |
|
Vav2 |
|
0 |
48 |
0 |
0 |
1274 |
|
n.v. |
1.64 |
n.v. |
n.v. |
0.26 |
|
guanine nucleotide exchange factor VAV2 |
| 124248572 |
|
Vbp1 |
|
0 |
674 |
998 |
6876 |
36905 |
|
n.v. |
0.82 |
0.39 |
-0.05 |
0.13 |
|
prefoldin subunit 3 |
| 31543942 |
|
Vcl |
|
162319 |
33674 |
145379 |
220896 |
1711850 |
|
0.12 |
0.23 |
0.03 |
0.15 |
0.02 |
|
vinculin |
| 225543319 |
|
Vcp |
|
222583 |
22364 |
56721 |
654035 |
165590 |
|
0.08 |
0.05 |
-0.04 |
0.05 |
-0.15 |
|
transitional endoplasmic reticulum ATPase |
| 70778826 |
|
Vcpip1 |
|
0 |
42 |
0 |
810 |
18624 |
|
n.v. |
0.05 |
n.v. |
0.1 |
0.25 |
|
deubiquitinating protein VCIP135 |
| 98986329 |
|
Vcpkmt |
|
0 |
0 |
0 |
0 |
2945 |
|
n.v. |
n.v. |
n.v. |
n.v. |
0.42 |
|
protein-lysine methyltransferase METTL21D |
| 6755963 |
|
Vdac1 |
|
1165434 |
315851 |
144301 |
54909 |
0 |
|
-0.04 |
-0.19 |
-0.41 |
-0.24 |
n.v. |
|
voltage-dependent anion-selective channel protein 1 |
| 6755965 |
|
Vdac2 |
|
653506 |
271034 |
86043 |
12131 |
0 |
|
-0.02 |
-0.18 |
-0.38 |
-0.33 |
n.v. |
|
voltage-dependent anion-selective channel protein 2 |
| 312222784 |
|
Vdac3 |
|
566150 |
77399 |
49048 |
13015 |
0 |
|
-0.01 |
-0.13 |
-0.38 |
-0.22 |
n.v. |
|
voltage-dependent anion-selective channel protein 3
isoform 1 |
| 6755967 |
|
Vdac3 |
|
566150 |
78273 |
49361 |
13015 |
0 |
|
-0.01 |
-0.13 |
-0.38 |
-0.22 |
n.v. |
|
voltage-dependent anion-selective channel protein 3
isoform 2 |
| 240848537 |
|
Veph1 |
|
0 |
488 |
4290 |
532 |
0 |
|
n.v. |
-0.02 |
0.15 |
-0.32 |
n.v. |
|
ventricular zone-expressed PH domain-containing protein 1 |
| 6678567 |
|
Vhl |
|
0 |
0 |
0 |
0 |
86 |
|
n.v. |
n.v. |
n.v. |
n.v. |
0.89 |
|
von Hippel-Lindau disease tumor suppressor |
| 190684696 |
|
Vil1 |
|
0 |
0 |
0 |
0 |
27963 |
|
n.v. |
n.v. |
n.v. |
n.v. |
-0.01 |
|
villin-1 |
| 257096031 |
|
Vill |
|
110 |
691 |
10275 |
0 |
4080 |
|
0.98 |
-0.22 |
-0.63 |
n.v. |
0.01 |
|
villin-like protein isoform 1 |
| 257096033 |
|
Vill |
|
110 |
691 |
9951 |
0 |
4080 |
|
0.98 |
-0.22 |
-0.69 |
n.v. |
0.01 |
|
villin-like protein isoform 2 |
| 31982755 |
|
Vim |
|
715600 |
0 |
2644 |
0 |
0 |
|
0.01 |
n.v. |
-0.44 |
n.v. |
n.v. |
|
vimentin |
| 111119010 |
|
Vimp |
|
0 |
109 |
13 |
0 |
0 |
|
n.v. |
-0.3 |
-0.17 |
n.v. |
n.v. |
|
selenoprotein S |
| 217035166 |
|
Vipas39 |
|
0 |
0 |
6 |
0 |
0 |
|
n.v. |
n.v. |
-0.21 |
n.v. |
n.v. |
|
spermatogenesis-defective protein 39 homolog isoform b |
| 217272818 |
|
Vipas39 |
|
0 |
0 |
6 |
0 |
0 |
|
n.v. |
n.v. |
-0.21 |
n.v. |
n.v. |
|
spermatogenesis-defective protein 39 homolog isoform a |
| 30519915 |
|
Vkorc1 |
|
0 |
2227 |
208 |
0 |
0 |
|
n.v. |
-0.47 |
-0.85 |
n.v. |
n.v. |
|
vitamin K epoxide reductase complex subunit 1 precursor |
| 556503385 |
|
Vkorc1l1 |
|
2307 |
0 |
0 |
0 |
0 |
|
0.08 |
n.v. |
n.v. |
n.v. |
n.v. |
|
vitamin K epoxide reductase complex subunit 1-like
protein 1 isoform 3 |
| 47717109 |
|
Vkorc1l1 |
|
0 |
1171 |
0 |
0 |
0 |
|
n.v. |
0.27 |
n.v. |
n.v. |
n.v. |
|
vitamin K epoxide reductase complex subunit 1-like
protein 1 isoform 2 |
| 46309457 |
|
Vkorc1l1 |
|
2307 |
1171 |
0 |
0 |
0 |
|
0.08 |
0.27 |
n.v. |
n.v. |
n.v. |
|
vitamin K epoxide reductase complex subunit 1-like
protein 1 isoform 1 |
| 238637303 |
|
Vldlr |
|
0 |
2 |
57 |
0 |
0 |
|
n.v. |
0.08 |
0.15 |
n.v. |
n.v. |
|
very low-density lipoprotein receptor isoform a
precursor |
| 238637305 |
|
Vldlr |
|
0 |
2 |
57 |
0 |
0 |
|
n.v. |
0.08 |
0.15 |
n.v. |
n.v. |
|
very low-density lipoprotein receptor isoform b
precursor |
| 124486867 |
|
Vma21 |
|
0 |
795 |
319 |
0 |
0 |
|
n.v. |
-0.29 |
-0.35 |
n.v. |
n.v. |
|
vacuolar ATPase assembly integral membrane protein
VMA21 |
| 262050612 |
|
Vmac |
|
0 |
0 |
0 |
0 |
129 |
|
n.v. |
n.v. |
n.v. |
n.v. |
0.05 |
|
vimentin-type intermediate filament-associated
coiled-coil protein isoform 2 |
| 30725792 |
|
Vmac |
|
0 |
0 |
0 |
0 |
428 |
|
n.v. |
n.v. |
n.v. |
n.v. |
-0.17 |
|
vimentin-type intermediate filament-associated
coiled-coil protein isoform 1 |
| 282847329 |
|
Vmn1r11 |
|
0 |
1651 |
3193 |
0 |
2195 |
|
n.v. |
0.24 |
0.07 |
n.v. |
-0.37 |
|
vomeronasal 1 receptor, C3 |
| 285026477 |
|
Vmn1r68 |
|
0 |
0 |
258 |
0 |
0 |
|
n.v. |
n.v. |
0.28 |
n.v. |
n.v. |
|
vomernasal 1 receptor Vmn1r68 |
| 22003898 |
|
Vmn1r69 |
|
0 |
0 |
258 |
0 |
0 |
|
n.v. |
n.v. |
0.28 |
n.v. |
n.v. |
|
vomeronasal 1 receptor, E9 |
| 27753991 |
|
Vmp1 |
|
0 |
570 |
190 |
0 |
0 |
|
n.v. |
-0.31 |
-0.3 |
n.v. |
n.v. |
|
vacuole membrane protein 1 |
| 82617569 |
|
Vprbp |
|
0 |
0 |
0 |
4666 |
268 |
|
n.v. |
n.v. |
n.v. |
-0.74 |
-0.29 |
|
protein VPRBP |
| 58037259 |
|
Vps11 |
|
0 |
885 |
67 |
0 |
0 |
|
n.v. |
0.08 |
-0.22 |
n.v. |
n.v. |
|
vacuolar protein sorting-associated protein 11 homolog |
| 66392160 |
|
Vps13a |
|
0 |
1202 |
603 |
0 |
0 |
|
n.v. |
-0.09 |
-0.08 |
n.v. |
n.v. |
|
vacuolar protein sorting-associated protein 13A |
| 122114537 |
|
Vps13c |
|
0 |
16251 |
29480 |
36794 |
407 |
|
n.v. |
0.22 |
-0.06 |
-0.05 |
-0.2 |
|
vacuolar protein sorting-associated protein 13C |
| 451172096 |
|
Vps13d |
|
0 |
0 |
13 |
0 |
0 |
|
n.v. |
n.v. |
-0.19 |
n.v. |
n.v. |
|
vacuolar protein sorting-associated protein 13D isoform
2 |
| 451805038 |
|
Vps13d |
|
0 |
0 |
13 |
0 |
0 |
|
n.v. |
n.v. |
-0.19 |
n.v. |
n.v. |
|
vacuolar protein sorting-associated protein 13D isoform
1 |
| 254939640 |
|
Vps16 |
|
0 |
1495 |
3976 |
598 |
0 |
|
n.v. |
0.01 |
-0.09 |
-0.17 |
n.v. |
|
vacuolar protein sorting-associated protein 16 homolog |
| 254675217 |
|
Vps18 |
|
0 |
1113 |
1853 |
180 |
0 |
|
n.v. |
-0.14 |
-0.08 |
-0.16 |
n.v. |
|
vacuolar protein sorting-associated protein 18 homolog |
| 548923764 |
|
Vps25 |
|
201 |
0 |
0 |
0 |
0 |
|
-0.01 |
n.v. |
n.v. |
n.v. |
n.v. |
|
vacuolar protein-sorting-associated protein 25 isoform 1 |
| 25092662 |
|
Vps25 |
|
201 |
3618 |
3298 |
11443 |
12637 |
|
1.8 |
0.14 |
0.09 |
0.33 |
0.2 |
|
vacuolar protein-sorting-associated protein 25 isoform 2 |
| 164518904 |
|
Vps26a |
|
6993 |
6903 |
20778 |
142879 |
103732 |
|
0.08 |
0.09 |
-0.04 |
0.05 |
0 |
|
vacuolar protein sorting-associated protein 26A isoform
b |
| 19526826 |
|
Vps26a |
|
6993 |
6903 |
20778 |
142879 |
103732 |
|
0.08 |
0.09 |
-0.04 |
0.05 |
0 |
|
vacuolar protein sorting-associated protein 26A isoform
a |
| 29825827 |
|
Vps26b |
|
2783 |
2728 |
7798 |
39823 |
8503 |
|
0.09 |
0.12 |
-0.04 |
0 |
0.03 |
|
vacuolar protein sorting-associated protein 26B |
| 13385320 |
|
Vps28 |
|
0 |
2835 |
3436 |
843 |
19673 |
|
n.v. |
0.16 |
0.08 |
0.14 |
0.06 |
|
vacuolar protein sorting-associated protein 28 homolog |
| 9790285 |
|
Vps29 |
|
6334 |
2380 |
19032 |
48499 |
41264 |
|
0.12 |
0.09 |
-0.03 |
0.07 |
-0.01 |
|
vacuolar protein sorting-associated protein 29 |
| 254588041 |
|
Vps33a |
|
0 |
313 |
1775 |
941 |
0 |
|
n.v. |
0.68 |
-0.06 |
-0.2 |
n.v. |
|
vacuolar protein sorting-associated protein 33A |
| 158937308 |
|
Vps33b |
|
0 |
0 |
3 |
8317 |
0 |
|
n.v. |
n.v. |
0.05 |
0.14 |
n.v. |
|
vacuolar protein sorting-associated protein 33B |
| 13928670 |
|
Vps35 |
|
55339 |
16251 |
86245 |
264074 |
82485 |
|
0.11 |
0.11 |
-0.03 |
0.03 |
0.04 |
|
vacuolar protein sorting-associated protein 35 |
| 30794416 |
|
Vps36 |
|
0 |
1799 |
2603 |
1523 |
19705 |
|
n.v. |
0.02 |
0.03 |
0.12 |
0 |
|
vacuolar protein-sorting-associated protein 36 |
| 29244484 |
|
Vps37b |
|
0 |
0 |
146 |
0 |
2303 |
|
n.v. |
n.v. |
-0.03 |
n.v. |
0.07 |
|
vacuolar protein sorting-associated protein 37B |
| 31088908 |
|
Vps37c |
|
0 |
25 |
417 |
0 |
696 |
|
n.v. |
1.5 |
0.37 |
n.v. |
0.66 |
|
vacuolar protein sorting-associated protein 37C |
| 22164794 |
|
Vps39 |
|
0 |
1716 |
262 |
0 |
0 |
|
n.v. |
-0.15 |
-0.12 |
n.v. |
n.v. |
|
vam6/Vps39-like protein isoform 1 |
| 30578384 |
|
Vps39 |
|
0 |
1716 |
262 |
0 |
0 |
|
n.v. |
-0.15 |
-0.12 |
n.v. |
n.v. |
|
vam6/Vps39-like protein isoform 2 |
| 7305631 |
|
Vps45 |
|
3478 |
2977 |
3159 |
5943 |
0 |
|
-0.01 |
-0.07 |
0.02 |
-0.07 |
n.v. |
|
vacuolar protein sorting-associated protein 45 |
| 18699726 |
|
Vps4a |
|
0 |
0 |
2021 |
0 |
4059 |
|
n.v. |
n.v. |
0.21 |
n.v. |
0.23 |
|
vacuolar protein sorting-associated protein 4A |
| 164698506 |
|
Vps4b |
|
37 |
3970 |
3048 |
5370 |
12230 |
|
0.44 |
0.35 |
0.19 |
0.07 |
0.12 |
|
vacuolar protein sorting-associated protein 4B |
| 124486662 |
|
Vps51 |
|
0 |
1641 |
1493 |
32308 |
11802 |
|
n.v. |
0.1 |
0 |
0.07 |
0.19 |
|
vacuolar protein sorting-associated protein 51 homolog |
| 148747162 |
|
Vps52 |
|
0 |
737 |
435 |
45405 |
2549 |
|
n.v. |
0.29 |
-0.13 |
-0.03 |
-0.13 |
|
vacuolar protein sorting-associated protein 52 homolog |
| 377833518 |
|
Vps52 |
|
0 |
737 |
435 |
45405 |
2549 |
|
n.v. |
0.29 |
-0.13 |
-0.03 |
-0.13 |
|
PREDICTED: LOW QUALITY PROTEIN: vacuolar protein
sorting-associated protein 52 homolog |
| 31980873 |
|
Vps53 |
|
0 |
685 |
3219 |
34175 |
1114 |
|
n.v. |
0.14 |
-0.2 |
-0.01 |
-0.17 |
|
vacuolar protein sorting-associated protein 53 homolog |
| 124486983 |
|
Vps8 |
|
0 |
0 |
325 |
0 |
3491 |
|
n.v. |
n.v. |
0.01 |
n.v. |
0.12 |
|
vacuolar protein sorting-associated protein 8 homolog |
| 71067120 |
|
Vrk1 |
|
7981 |
169 |
556 |
0 |
0 |
|
-0.33 |
-0.1 |
-0.27 |
n.v. |
n.v. |
|
serine/threonine-protein kinase VRK1 isoform c |
| 71067122 |
|
Vrk1 |
|
7981 |
169 |
556 |
0 |
0 |
|
-0.33 |
-0.1 |
-0.27 |
n.v. |
n.v. |
|
serine/threonine-protein kinase VRK1 isoform b |
| 6755985 |
|
Vrk1 |
|
7981 |
169 |
569 |
377 |
0 |
|
-0.33 |
-0.1 |
-0.24 |
-0.09 |
n.v. |
|
serine/threonine-protein kinase VRK1 isoform a |
| 148664203 |
|
Vsig10 |
|
2215 |
2263 |
7100 |
3201 |
171 |
|
-0.14 |
0.01 |
-0.01 |
-0.28 |
-0.66 |
|
V-set and immunoglobulin domain-containing protein 10
precursor |
| 27754140 |
|
Vta1 |
|
0 |
25 |
992 |
20988 |
38212 |
|
n.v. |
-0.27 |
0.22 |
0.04 |
-0.1 |
|
vacuolar protein sorting-associated protein VTA1 homolog |
| 13928668 |
|
Vti1a |
|
0 |
234 |
436 |
1072 |
86 |
|
n.v. |
0.02 |
-0.08 |
0.23 |
0.94 |
|
vesicle transport through interaction with t-SNAREs
homolog 1A |
| 31980617 |
|
Vti1b |
|
0 |
2081 |
536 |
0 |
0 |
|
n.v. |
-0.21 |
-0.1 |
n.v. |
n.v. |
|
vesicle transport through interaction with t-SNAREs
homolog 1B |
| 225543183 |
|
Vwa5a |
|
2416 |
5434 |
7600 |
22977 |
63090 |
|
-0.36 |
0.19 |
0.04 |
0.12 |
0.02 |
|
von Willebrand factor A domain-containing protein 5A |
| 226958579 |
|
Vwa8 |
|
0 |
2893 |
0 |
0 |
0 |
|
n.v. |
-0.26 |
n.v. |
n.v. |
n.v. |
|
von Willebrand factor A domain-containing protein 8
isoform 1 precursor |
| 226958581 |
|
Vwa8 |
|
0 |
2292 |
0 |
0 |
0 |
|
n.v. |
-0.26 |
n.v. |
n.v. |
n.v. |
|
von Willebrand factor A domain-containing protein 8
isoform 2 precursor |
| 117647251 |
|
Vwa9 |
|
0 |
0 |
0 |
434 |
0 |
|
n.v. |
n.v. |
n.v. |
0.14 |
n.v. |
|
UPF0464 protein C15orf44 homolog |
| 226371681 |
|
Wac |
|
0 |
0 |
0 |
24082 |
0 |
|
n.v. |
n.v. |
n.v. |
-0.07 |
n.v. |
|
WW domain-containing adapter protein with coiled-coil
isoform 2 |
| 256818746 |
|
Wars |
|
0 |
10895 |
15399 |
45733 |
119143 |
|
n.v. |
0.23 |
0.05 |
0.18 |
0.03 |
|
tryptophan--tRNA ligase, cytoplasmic isoform 2 |
| 256818802 |
|
Wars |
|
0 |
10895 |
15399 |
45733 |
119143 |
|
n.v. |
0.23 |
0.05 |
0.18 |
0.03 |
|
tryptophan--tRNA ligase, cytoplasmic isoform 1 |
| 13994209 |
|
Wasf1 |
|
0 |
0 |
0 |
565 |
0 |
|
n.v. |
n.v. |
n.v. |
-0.07 |
n.v. |
|
wiskott-Aldrich syndrome protein family member 1 |
| 23510313 |
|
Wasf2 |
|
0 |
1296 |
3819 |
5804 |
942 |
|
n.v. |
0.18 |
0.08 |
-0.13 |
-0.11 |
|
wiskott-Aldrich syndrome protein family member 2 |
| 83649760 |
|
Wash |
|
0 |
881 |
1272 |
3020 |
214 |
|
n.v. |
-0.28 |
0.12 |
0.69 |
1.59 |
|
WAS protein family homolog 1 |
| 268370040 |
|
Wasl |
|
0 |
0 |
1288 |
5632 |
4851 |
|
n.v. |
n.v. |
0.15 |
0.19 |
0.12 |
|
neural Wiskott-Aldrich syndrome protein isoform 1 |
| 268370042 |
|
Wasl |
|
0 |
0 |
132 |
1252 |
1028 |
|
n.v. |
n.v. |
0.34 |
0.19 |
0.02 |
|
neural Wiskott-Aldrich syndrome protein isoform 2 |
| 267844920 |
|
Wbp11 |
|
0 |
50 |
91 |
0 |
0 |
|
n.v. |
0.17 |
-0.06 |
n.v. |
n.v. |
|
WW domain-binding protein 11 |
| 295317409 |
|
Wbp1l |
|
0 |
0 |
503 |
0 |
0 |
|
n.v. |
n.v. |
-0.15 |
n.v. |
n.v. |
|
WW domain binding protein 1-like isoform 2 precursor |
| 295317411 |
|
Wbp1l |
|
0 |
0 |
503 |
0 |
0 |
|
n.v. |
n.v. |
-0.15 |
n.v. |
n.v. |
|
WW domain binding protein 1-like isoform 1 precursor |
| 295317413 |
|
Wbp1l |
|
0 |
0 |
503 |
0 |
0 |
|
n.v. |
n.v. |
-0.15 |
n.v. |
n.v. |
|
WW domain binding protein 1-like isoform 3 |
| 8394539 |
|
Wbp2 |
|
0 |
0 |
609 |
0 |
11256 |
|
n.v. |
n.v. |
0.04 |
n.v. |
0.23 |
|
WW domain-binding protein 2 |
| 33468951 |
|
Wbp5 |
|
0 |
0 |
0 |
344 |
6308 |
|
n.v. |
n.v. |
n.v. |
0.23 |
0.47 |
|
WW domain-binding protein 5 |
| 15809010 |
|
Wbscr16 |
|
0 |
142 |
0 |
0 |
0 |
|
n.v. |
-0.06 |
n.v. |
n.v. |
n.v. |
|
Williams-Beuren syndrome chromosomal region 16 protein
homolog |
| 125988405 |
|
Wbscr22 |
|
0 |
0 |
0 |
2112 |
0 |
|
n.v. |
n.v. |
n.v. |
0.2 |
n.v. |
|
uncharacterized methyltransferase WBSCR22 |
| 50355999 |
|
Wbscr27 |
|
0 |
539 |
389 |
0 |
44627 |
|
n.v. |
0.22 |
0.31 |
n.v. |
0.09 |
|
Williams-Beuren syndrome chromosomal region 27 protein |
| 34732713 |
|
Wbscr28 |
|
0 |
0 |
79 |
0 |
0 |
|
n.v. |
n.v. |
-0.05 |
n.v. |
n.v. |
|
Williams-Beuren syndrome chromosomal region 28 protein
homolog isoform a |
| 34732715 |
|
Wbscr28 |
|
0 |
0 |
79 |
0 |
0 |
|
n.v. |
n.v. |
-0.05 |
n.v. |
n.v. |
|
Williams-Beuren syndrome chromosomal region 28 protein
homolog isoform b |
| 162287109 |
|
Wdfy1 |
|
0 |
219 |
3508 |
0 |
0 |
|
n.v. |
0.19 |
-0.08 |
n.v. |
n.v. |
|
WD repeat and FYVE domain containing 1 isoform 1 |
| 254540214 |
|
Wdfy2 |
|
0 |
67 |
101 |
0 |
0 |
|
n.v. |
0.43 |
0.06 |
n.v. |
n.v. |
|
WD repeat and FYVE domain-containing protein 2 |
| 39930599 |
|
Wdfy3 |
|
0 |
290 |
7 |
213 |
0 |
|
n.v. |
-0.03 |
0.01 |
-0.09 |
n.v. |
|
WD repeat and FYVE domain-containing protein 3 |
| 40254224 |
|
Wdhd1 |
|
403 |
0 |
6 |
0 |
6447 |
|
0.23 |
n.v. |
0.15 |
0.72 |
-0.01 |
|
WD repeat and HMG-box DNA-binding protein 1 |
| 31981772 |
|
Wdpcp |
|
24622 |
666 |
1756 |
20595 |
4755 |
|
0.05 |
0.24 |
0.03 |
0.1 |
-0.04 |
|
WD repeat-containing and planar cell polarity effector
protein fritz homolog |
| 6755995 |
|
Wdr1 |
|
4302 |
18299 |
34606 |
84148 |
255422 |
|
-0.07 |
0.14 |
0.01 |
0.17 |
0.03 |
|
WD repeat-containing protein 1 |
| 227908800 |
|
Wdr11 |
|
55 |
1323 |
5580 |
16036 |
0 |
|
-0.08 |
-0.11 |
0.03 |
-0.05 |
n.v. |
|
WD repeat-containing protein 11 |
| 10946614;312261271 |
|
Wdr12 |
|
0 |
0 |
353 |
0 |
0 |
|
n.v. |
n.v. |
-0.55 |
n.v. |
n.v. |
|
ribosome biogenesis protein WDR12 |
| 312261271 |
|
Wdr12 |
|
0 |
0 |
0 |
5574 |
3009 |
|
n.v. |
n.v. |
n.v. |
-0.04 |
-0.23 |
|
ribosome biogenesis protein WDR12 |
| 261878588 |
|
Wdr13 |
|
0 |
0 |
0 |
663 |
0 |
|
n.v. |
n.v. |
n.v. |
0.77 |
n.v. |
|
WD repeat-containing protein 13 isoform 1 |
| 83649741 |
|
Wdr18 |
|
0 |
0 |
2592 |
18254 |
0 |
|
n.v. |
n.v. |
-0.18 |
-0.23 |
n.v. |
|
WD repeat-containing protein 18 |
| 154240688 |
|
Wdr19 |
|
0 |
0 |
578 |
1621 |
0 |
|
n.v. |
n.v. |
0.1 |
0.03 |
n.v. |
|
WD repeat-containing protein 19 |
| 61742804 |
|
Wdr20 |
|
0 |
0 |
417 |
565 |
0 |
|
n.v. |
n.v. |
0.2 |
-0.32 |
n.v. |
|
WD repeat domain 20 |
| 21735451 |
|
Wdr20rt |
|
0 |
0 |
189 |
565 |
0 |
|
n.v. |
n.v. |
0.18 |
-0.32 |
n.v. |
|
WD repeat-containing protein 20 |
| 264681550 |
|
Wdr26 |
|
0 |
0 |
85 |
13220 |
0 |
|
n.v. |
n.v. |
0.09 |
0.04 |
n.v. |
|
WD repeat-containing protein 26 |
| 30425338 |
|
Wdr3 |
|
0 |
0 |
26 |
0 |
0 |
|
n.v. |
n.v. |
-0.08 |
n.v. |
n.v. |
|
WD repeat-containing protein 3 |
| 21362285 |
|
Wdr33 |
|
2343 |
0 |
0 |
0 |
0 |
|
0.07 |
n.v. |
n.v. |
n.v. |
n.v. |
|
pre-mRNA 3' end processing protein WDR33 isoform 1 |
| 139948827 |
|
Wdr34 |
|
0 |
2 |
0 |
0 |
0 |
|
n.v. |
0.13 |
n.v. |
n.v. |
n.v. |
|
WD repeat-containing protein 34 |
| 226958501 |
|
Wdr35 |
|
0 |
0 |
445 |
123 |
0 |
|
n.v. |
n.v. |
-0.03 |
-0.1 |
n.v. |
|
WD repeat-containing protein 35 isoform 1 |
| 226958503 |
|
Wdr35 |
|
0 |
0 |
445 |
123 |
0 |
|
n.v. |
n.v. |
-0.03 |
-0.1 |
n.v. |
|
WD repeat-containing protein 35 isoform 2 |
| 31542010 |
|
Wdr36 |
|
0 |
0 |
20 |
0 |
0 |
|
n.v. |
n.v. |
-0.09 |
n.v. |
n.v. |
|
WD repeat domain 36 isoform 3 |
| 158517940 |
|
Wdr36 |
|
0 |
0 |
139 |
0 |
835 |
|
n.v. |
n.v. |
-0.08 |
n.v. |
0.83 |
|
WD repeat domain 36 isoform 1 |
| 158517942 |
|
Wdr36 |
|
0 |
0 |
139 |
0 |
835 |
|
n.v. |
n.v. |
-0.08 |
n.v. |
0.83 |
|
WD repeat domain 36 isoform 2 |
| 27369593 |
|
Wdr37 |
|
0 |
0 |
79 |
4772 |
0 |
|
n.v. |
n.v. |
-0.36 |
0.01 |
n.v. |
|
WD repeat-containing protein 37 isoform a |
| 86476061 |
|
Wdr37 |
|
0 |
0 |
79 |
4666 |
0 |
|
n.v. |
n.v. |
-0.36 |
0.07 |
n.v. |
|
WD repeat-containing protein 37 isoform b |
| 255308863 |
|
Wdr4 |
|
0 |
0 |
189 |
0 |
7732 |
|
n.v. |
n.v. |
-0.02 |
n.v. |
0.09 |
|
tRNA (guanine-N(7)-)-methyltransferase subunit WDR4 |
| 123702001 |
|
Wdr41 |
|
0 |
0 |
0 |
74 |
0 |
|
n.v. |
n.v. |
n.v. |
-0.05 |
n.v. |
|
WD repeat-containing protein 41 |
| 124249073 |
|
Wdr44 |
|
0 |
0 |
0 |
1326 |
257 |
|
n.v. |
n.v. |
n.v. |
-0.08 |
0.39 |
|
WD repeat-containing protein 44 |
| 27363472 |
|
Wdr45 |
|
0 |
484 |
543 |
229 |
2902 |
|
n.v. |
0.02 |
0.04 |
0.32 |
-0.22 |
|
WD repeat domain phosphoinositide-interacting protein 4 |
| 27229002 |
|
Wdr45b |
|
0 |
2092 |
675 |
0 |
0 |
|
n.v. |
-0.3 |
-0.09 |
n.v. |
n.v. |
|
WD repeat domain phosphoinositide-interacting protein 3 |
| 10181122 |
|
Wdr46 |
|
2343 |
0 |
15 |
0 |
0 |
|
0.07 |
n.v. |
-0.43 |
n.v. |
n.v. |
|
WD repeat-containing protein 46 |
| 170172546 |
|
Wdr47 |
|
0 |
0 |
28 |
1203 |
503 |
|
n.v. |
n.v. |
-0.01 |
0 |
-0.23 |
|
WD repeat-containing protein 47 |
| 33468987 |
|
Wdr48 |
|
0 |
1618 |
6371 |
434 |
386 |
|
n.v. |
-0.12 |
0.03 |
-1.66 |
-0.07 |
|
WD repeat-containing protein 48 |
| 309264766 |
|
Wdr49 |
|
0 |
0 |
0 |
15061 |
0 |
|
n.v. |
n.v. |
n.v. |
-0.11 |
n.v. |
|
PREDICTED: WD repeat-containing protein 49 |
| 407263036 |
|
Wdr49 |
|
0 |
0 |
0 |
15061 |
0 |
|
n.v. |
n.v. |
n.v. |
-0.11 |
n.v. |
|
PREDICTED: WD repeat-containing protein 49 |
| 18252790 |
|
Wdr5 |
|
3917 |
2622 |
291 |
10633 |
7422 |
|
0.06 |
0.04 |
0.03 |
0.01 |
0.03 |
|
WD repeat-containing protein 5 |
| 256818776 |
|
Wdr52 |
|
0 |
378 |
231 |
0 |
0 |
|
n.v. |
-0.04 |
0.23 |
n.v. |
n.v. |
|
WD repeat-containing protein 52 |
| 12963827 |
|
Wdr54 |
|
0 |
0 |
0 |
0 |
1971 |
|
n.v. |
n.v. |
n.v. |
n.v. |
-0.02 |
|
WD repeat-containing protein 54 |
| 13878227 |
|
Wdr6 |
|
0 |
0 |
2019 |
0 |
3234 |
|
n.v. |
n.v. |
0.1 |
n.v. |
0.01 |
|
WD repeat-containing protein 6 |
| 70778824 |
|
Wdr61 |
|
0 |
0 |
0 |
4903 |
0 |
|
n.v. |
n.v. |
n.v. |
0.09 |
n.v. |
|
WD repeat-containing protein 61 isoform b |
| 13277350;70778817 |
|
Wdr61 |
|
641 |
44 |
0 |
5623 |
589 |
|
-0.17 |
0.01 |
n.v. |
0.08 |
0.08 |
|
WD repeat-containing protein 61 isoform a |
| 124487149 |
|
Wdr70 |
|
0 |
113 |
0 |
0 |
1671 |
|
n.v. |
0.09 |
n.v. |
n.v. |
0.31 |
|
WD repeat-containing protein 70 |
| 148226059 |
|
Wdr72 |
|
67513 |
829 |
274 |
16420 |
0 |
|
-0.06 |
-0.01 |
-0.15 |
-0.14 |
n.v. |
|
WD repeat domain 72 |
| 254910981 |
|
Wdr73 |
|
0 |
0 |
0 |
0 |
814 |
|
n.v. |
n.v. |
n.v. |
n.v. |
-0.09 |
|
WD repeat-containing protein 73 |
| 19527374 |
|
Wdr74 |
|
0 |
0 |
331 |
0 |
0 |
|
n.v. |
n.v. |
-0.8 |
n.v. |
n.v. |
|
WD repeat-containing protein 74 |
| 124487321 |
|
Wdr76 |
|
0 |
0 |
0 |
2423 |
0 |
|
n.v. |
n.v. |
n.v. |
-0.41 |
n.v. |
|
WD repeat-containing protein 76 |
| 19263322 |
|
Wdr77 |
|
0 |
497 |
762 |
52183 |
28691 |
|
n.v. |
0.12 |
0.13 |
0.19 |
0 |
|
methylosome protein 50 |
| 242118003 |
|
Wdr81 |
|
0 |
25 |
47 |
606 |
0 |
|
n.v. |
0.04 |
-0.14 |
0.31 |
n.v. |
|
WD repeat-containing protein 81 |
| 148223079 |
|
Wdr82 |
|
3185 |
1238 |
960 |
7154 |
664 |
|
0.07 |
-0.02 |
-0.03 |
-0.08 |
-0.41 |
|
WD repeat-containing protein 82 |
| 71067130 |
|
Wdr83 |
|
0 |
38 |
97 |
0 |
0 |
|
n.v. |
0.82 |
-0.09 |
n.v. |
n.v. |
|
WD repeat domain-containing protein 83 |
| 61656182 |
|
Wdr91 |
|
0 |
230 |
721 |
2161 |
0 |
|
n.v. |
0 |
-0.09 |
0.28 |
n.v. |
|
WD repeat-containing protein 91 |
| 30725770 |
|
Wdr92 |
|
2343 |
0 |
609 |
13081 |
0 |
|
0.07 |
n.v. |
-0.25 |
0.16 |
n.v. |
|
WD repeat-containing protein 92 |
| 227452250 |
|
Wdsub1 |
|
0 |
0 |
0 |
0 |
203 |
|
n.v. |
n.v. |
n.v. |
n.v. |
0.65 |
|
WD repeat, SAM and U-box domain-containing protein 1
isoform 2 |
| 58037281 |
|
Wdsub1 |
|
0 |
0 |
0 |
0 |
203 |
|
n.v. |
n.v. |
n.v. |
n.v. |
0.65 |
|
WD repeat, SAM and U-box domain-containing protein 1
isoform 1 |
| 40556280 |
|
Wdtc1 |
|
0 |
0 |
0 |
0 |
471 |
|
n.v. |
n.v. |
n.v. |
n.v. |
-0.19 |
|
WD and tetratricopeptide repeats protein 1 |
| 58037459 |
|
Wdyhv1 |
|
0 |
0 |
0 |
0 |
1189 |
|
n.v. |
n.v. |
n.v. |
n.v. |
0.27 |
|
protein N-terminal glutamine amidohydrolase |
| 6755997 |
|
Wfs1 |
|
0 |
142 |
1234 |
0 |
0 |
|
n.v. |
-0.44 |
-0.37 |
n.v. |
n.v. |
|
wolframin |
| 358679337 |
|
Wibg |
|
0 |
0 |
38 |
0 |
0 |
|
n.v. |
n.v. |
0.17 |
n.v. |
n.v. |
|
partner of Y14 and mago isoform 4 |
| 283945598 |
|
Wibg |
|
0 |
954 |
6519 |
10510 |
236 |
|
n.v. |
0.1 |
-0.03 |
-0.13 |
-0.22 |
|
partner of Y14 and mago isoform 1 |
| 283945600 |
|
Wibg |
|
0 |
954 |
6519 |
10109 |
236 |
|
n.v. |
0.1 |
-0.03 |
-0.13 |
-0.22 |
|
partner of Y14 and mago isoform 2 |
| 98986316 |
|
Wls |
|
110 |
1983 |
1248 |
0 |
0 |
|
-0.19 |
-0.01 |
-0.27 |
n.v. |
n.v. |
|
protein wntless homolog precursor |
| 257900530 |
|
Wnk1 |
|
0 |
0 |
124 |
0 |
28916 |
|
n.v. |
n.v. |
-0.37 |
n.v. |
0.32 |
|
serine/threonine-protein kinase WNK1 isoform 1 |
| 297206804 |
|
Wnk1 |
|
0 |
0 |
124 |
0 |
28916 |
|
n.v. |
n.v. |
-0.37 |
n.v. |
0.32 |
|
serine/threonine-protein kinase WNK1 isoform 2 |
| 297206806 |
|
Wnk1 |
|
0 |
0 |
124 |
0 |
28916 |
|
n.v. |
n.v. |
-0.37 |
n.v. |
0.32 |
|
serine/threonine-protein kinase WNK1 isoform 3 |
| 312283629 |
|
Wnk1 |
|
0 |
0 |
124 |
0 |
28916 |
|
n.v. |
n.v. |
-0.37 |
n.v. |
0.32 |
|
serine/threonine-protein kinase WNK1 isoform 4 |
| 312283631 |
|
Wnk1 |
|
0 |
0 |
124 |
0 |
28916 |
|
n.v. |
n.v. |
-0.37 |
n.v. |
0.32 |
|
serine/threonine-protein kinase WNK1 isoform 5 |
| 157057176 |
|
Wnk2 |
|
0 |
0 |
0 |
0 |
5001 |
|
n.v. |
n.v. |
n.v. |
n.v. |
0.4 |
|
serine/threonine-protein kinase WNK2 |
| 28316732 |
|
Wnk4 |
|
0 |
0 |
0 |
123 |
11052 |
|
n.v. |
n.v. |
n.v. |
0.34 |
0.39 |
|
serine/threonine-protein kinase WNK4 |
| 170763502 |
|
Wrn |
|
0 |
0 |
287 |
0 |
0 |
|
n.v. |
n.v. |
0.43 |
n.v. |
n.v. |
|
Werner syndrome ATP-dependent helicase homolog |
| 407261615 |
|
Wrn |
|
0 |
0 |
287 |
0 |
0 |
|
n.v. |
n.v. |
0.43 |
n.v. |
n.v. |
|
PREDICTED: Werner syndrome ATP-dependent helicase homolog |
| 254540120 |
|
Wrnip1 |
|
0 |
0 |
0 |
327 |
0 |
|
n.v. |
n.v. |
n.v. |
-0.17 |
n.v. |
|
ATPase WRNIP1 |
| 165377291 |
|
Wtap |
|
0 |
0 |
0 |
516 |
182 |
|
n.v. |
n.v. |
n.v. |
-0.58 |
-0.31 |
|
pre-mRNA-splicing regulator WTAP isoform a |
| 82524278 |
|
Wwc1 |
|
0 |
0 |
0 |
819 |
4776 |
|
n.v. |
n.v. |
n.v. |
-0.02 |
0 |
|
protein KIBRA |
| 46575912 |
|
Wwc2 |
|
0 |
0 |
0 |
0 |
4530 |
|
n.v. |
n.v. |
n.v. |
n.v. |
-0.23 |
|
protein WWC2 |
| 31980962 |
|
Wwox |
|
0 |
0 |
19 |
0 |
0 |
|
n.v. |
n.v. |
-0.34 |
n.v. |
n.v. |
|
WW domain-containing oxidoreductase |
| 112734836 |
|
Wwp1 |
|
0 |
173 |
1766 |
0 |
0 |
|
n.v. |
0.48 |
0.11 |
n.v. |
n.v. |
|
NEDD4-like E3 ubiquitin-protein ligase WWP1 |
| 443906717 |
|
Wwp1 |
|
0 |
173 |
1766 |
0 |
0 |
|
n.v. |
0.48 |
0.11 |
n.v. |
n.v. |
|
NEDD4-like E3 ubiquitin-protein ligase WWP1 isoform
2 |
| 13385304 |
|
Wwp2 |
|
0 |
0 |
1592 |
0 |
0 |
|
n.v. |
n.v. |
0.05 |
n.v. |
n.v. |
|
NEDD4-like E3 ubiquitin-protein ligase WWP2 |
| 13385660 |
|
Xab2 |
|
531 |
0 |
0 |
0 |
0 |
|
0.23 |
n.v. |
n.v. |
n.v. |
n.v. |
|
pre-mRNA-splicing factor SYF1 |
| 157951674 |
|
Xiap |
|
0 |
0 |
0 |
0 |
407 |
|
n.v. |
n.v. |
n.v. |
n.v. |
0.35 |
|
E3 ubiquitin-protein ligase XIAP |
| 406855427 |
|
Xpnpep1 |
|
5949 |
7002 |
6421 |
18573 |
115352 |
|
0.3 |
0.03 |
-0.02 |
0.19 |
-0.03 |
|
xaa-Pro aminopeptidase 1 |
| 28893421 |
|
Xpnpep3 |
|
494 |
1273 |
0 |
0 |
0 |
|
-0.4 |
-0.35 |
n.v. |
n.v. |
n.v. |
|
probable Xaa-Pro aminopeptidase 3 |
| 38604071 |
|
Xpo1 |
|
17903 |
261 |
18442 |
104333 |
153242 |
|
-0.08 |
-0.02 |
-0.11 |
0.04 |
-0.02 |
|
exportin-1 |
| 10048438 |
|
Xpo4 |
|
0 |
0 |
222 |
0 |
5055 |
|
n.v. |
n.v. |
-0.06 |
n.v. |
0.04 |
|
exportin-4 |
| 24429570 |
|
Xpo5 |
|
238 |
2726 |
8729 |
43956 |
58313 |
|
0 |
0.09 |
-0.03 |
0.11 |
0.06 |
|
exportin-5 |
| 12746422 |
|
Xpo7 |
|
0 |
58 |
3395 |
21831 |
28284 |
|
n.v. |
-0.22 |
0.1 |
0 |
0.01 |
|
exportin-7 |
| 124486686 |
|
Xpot |
|
0 |
305 |
382 |
1809 |
14479 |
|
n.v. |
0.57 |
0.11 |
-0.09 |
-0.04 |
|
exportin-T |
| 170295844 |
|
Xrcc1 |
|
1501 |
0 |
42 |
4559 |
0 |
|
0.21 |
n.v. |
-0.05 |
-0.23 |
n.v. |
|
DNA repair protein XRCC1 |
| 160333605 |
|
Xrcc5 |
|
0 |
1488 |
4909 |
80914 |
22083 |
|
n.v. |
0.16 |
-0.08 |
0.03 |
0.12 |
|
X-ray repair cross-complementing protein 5 |
| 145587104 |
|
Xrcc6 |
|
1098 |
1795 |
4348 |
73506 |
3288 |
|
0 |
-0.46 |
0 |
0.04 |
-0.05 |
|
X-ray repair cross-complementing protein 6 |
| 227116360 |
|
Xrcc6bp1 |
|
0 |
90 |
0 |
0 |
0 |
|
n.v. |
-0.17 |
n.v. |
n.v. |
n.v. |
|
mitochondrial inner membrane protease ATP23 homolog
isoform 1 |
| 115495455 |
|
Xrn1 |
|
0 |
0 |
718 |
0 |
0 |
|
n.v. |
n.v. |
0.11 |
n.v. |
n.v. |
|
5'-3' exoribonuclease 1 |
| 117606214 |
|
Xrn2 |
|
15560 |
10 |
1443 |
3282 |
771 |
|
0.13 |
-0.42 |
0.06 |
-0.16 |
0.22 |
|
5'-3' exoribonuclease 2 |
| 256000811 |
|
Xrra1 |
|
1501 |
0 |
0 |
0 |
0 |
|
0.01 |
n.v. |
n.v. |
n.v. |
n.v. |
|
X-ray radiation resistance-associated protein 1 |
| 313760620 |
|
Xylb |
|
0 |
403 |
730 |
0 |
28991 |
|
n.v. |
0.82 |
-0.03 |
n.v. |
0.19 |
|
xylulose kinase isoform 2 |
| 84794607 |
|
Xylb |
|
0 |
403 |
730 |
0 |
29944 |
|
n.v. |
0.82 |
-0.03 |
n.v. |
0.19 |
|
xylulose kinase isoform 1 |
| 40254385 |
|
Yaf2 |
|
18 |
0 |
0 |
25 |
0 |
|
0.1 |
-1.47 |
n.v. |
-0.06 |
n.v. |
|
YY1-associated factor 2 |
| 283945493 |
|
Yap1 |
|
0 |
0 |
0 |
0 |
225 |
|
n.v. |
n.v. |
n.v. |
n.v. |
1.04 |
|
yorkie homolog isoform 1 |
| 6678615 |
|
Yap1 |
|
0 |
0 |
0 |
0 |
225 |
|
n.v. |
n.v. |
n.v. |
n.v. |
1.04 |
|
yorkie homolog isoform 2 |
| 411147387 |
|
Yars |
|
0 |
891 |
9608 |
52625 |
34131 |
|
n.v. |
0.14 |
-0.03 |
0.01 |
-0.12 |
|
tyrosine--tRNA ligase, cytoplasmic |
| 39930579 |
|
Yars2 |
|
0 |
664 |
0 |
0 |
0 |
|
n.v. |
-0.09 |
n.v. |
n.v. |
n.v. |
|
tyrosine--tRNA ligase, mitochondrial |
| 54607131 |
|
Ybey |
|
0 |
167 |
0 |
0 |
0 |
|
n.v. |
0.16 |
n.v. |
n.v. |
n.v. |
|
rRNA maturation factor homolog |
| 113205059 |
|
Ybx1 |
|
113095 |
15379 |
110563 |
256192 |
7465 |
|
0.03 |
0.24 |
0.2 |
-0.05 |
-0.07 |
|
nuclease-sensitive element-binding protein 1 |
| 117956377 |
|
Ybx2 |
|
13308 |
8573 |
83384 |
167403 |
0 |
|
0.49 |
0.17 |
0.17 |
-0.05 |
n.v. |
|
Y-box-binding protein 2 |
| 20806532 |
|
Ybx3 |
|
15981 |
11813 |
121375 |
208364 |
7861 |
|
0.36 |
0.16 |
0.17 |
-0.05 |
0.27 |
|
Y-box-binding protein 3 short isoform |
| 47059495 |
|
Ybx3 |
|
15981 |
11813 |
121576 |
208658 |
7861 |
|
0.36 |
0.16 |
0.16 |
-0.05 |
0.27 |
|
Y-box-binding protein 3 long isoform |
| 326806988 |
|
Yes1 |
|
2691 |
6453 |
12020 |
10936 |
44016 |
|
0.15 |
0.07 |
-0.04 |
-0.1 |
0.06 |
|
tyrosine-protein kinase Yes |
| 25282409 |
|
Yif1a |
|
0 |
106 |
1138 |
655 |
0 |
|
n.v. |
0.29 |
-0.08 |
0.18 |
n.v. |
|
protein YIF1A |
| 158937258 |
|
Yif1b |
|
0 |
392 |
237 |
0 |
0 |
|
n.v. |
-0.01 |
-0.08 |
n.v. |
n.v. |
|
protein YIF1B isoform 1 |
| 158937260 |
|
Yif1b |
|
0 |
392 |
237 |
0 |
0 |
|
n.v. |
-0.01 |
-0.08 |
n.v. |
n.v. |
|
protein YIF1B isoform 2 |
| 247269773 |
|
Yipf3 |
|
0 |
2534 |
0 |
0 |
0 |
|
n.v. |
-3.75 |
n.v. |
n.v. |
n.v. |
|
protein YIPF3 |
| 28076889 |
|
Yipf4 |
|
0 |
678 |
543 |
0 |
0 |
|
n.v. |
-0.34 |
-0.26 |
n.v. |
n.v. |
|
protein YIPF4 |
| 12963631 |
|
Yipf5 |
|
0 |
19 |
54 |
0 |
64 |
|
n.v. |
-0.99 |
-0.53 |
n.v. |
-0.86 |
|
protein YIPF5 |
| 46519049 |
|
Yipf6 |
|
0 |
0 |
23 |
286 |
0 |
|
n.v. |
n.v. |
0.54 |
0.31 |
n.v. |
|
protein YIPF6 |
| 31543971 |
|
Ykt6 |
|
0 |
4551 |
2179 |
5697 |
10988 |
|
n.v. |
0.21 |
0.05 |
0.09 |
0.07 |
|
synaptobrevin homolog YKT6 |
| 7305635 |
|
Yme1l1 |
|
311 |
2950 |
37 |
0 |
0 |
|
0.21 |
-0.12 |
-1.03 |
n.v. |
n.v. |
|
ATP-dependent zinc metalloprotease YME1L1 |
| 47059139 |
|
Ypel5 |
|
0 |
182 |
22 |
12458 |
782 |
|
n.v. |
-0.11 |
-0.73 |
-0.02 |
0.05 |
|
protein yippee-like 5 |
| 247494089 |
|
Yrdc |
|
0 |
0 |
0 |
0 |
1639 |
|
n.v. |
n.v. |
n.v. |
n.v. |
0.58 |
|
yrdC domain-containing protein, mitochondrial
precursor |
| 30424609 |
|
Ythdf1 |
|
0 |
190 |
4561 |
704 |
0 |
|
n.v. |
0.4 |
0.15 |
0.01 |
n.v. |
|
YTH domain family protein 1 |
| 225543110 |
|
Ythdf2 |
|
0 |
215 |
5825 |
729 |
0 |
|
n.v. |
0.48 |
0.07 |
0.12 |
n.v. |
|
YTH domain family protein 2 |
| 225543495 |
|
Ythdf3 |
|
0 |
2025 |
21351 |
5222 |
0 |
|
n.v. |
-0.99 |
0.14 |
0.01 |
n.v. |
|
YTH domain family protein 3 isoform 1 |
| 225543497 |
|
Ythdf3 |
|
0 |
2025 |
21351 |
5222 |
0 |
|
n.v. |
-0.99 |
0.14 |
0.01 |
n.v. |
|
YTH domain family protein 3 isoform 2 |
| 31543974 |
|
Ywhab |
|
486665 |
67859 |
122833 |
325196 |
496182 |
|
0.07 |
0.07 |
-0.05 |
0.01 |
-0.01 |
|
14-3-3 protein beta/alpha |
| 226874906 |
|
Ywhae |
|
553299 |
84559 |
144367 |
377559 |
843855 |
|
0.06 |
0.13 |
-0.04 |
0.01 |
0.02 |
|
14-3-3 protein epsilon |
| 31543976 |
|
Ywhag |
|
364033 |
60638 |
89517 |
240893 |
544107 |
|
0.06 |
0.13 |
-0.05 |
0.01 |
-0.01 |
|
14-3-3 protein gamma |
| 6756037 |
|
Ywhah |
|
384884 |
68673 |
117739 |
341403 |
1201039 |
|
0.06 |
0.12 |
-0.03 |
0.02 |
0.02 |
|
14-3-3 protein eta |
| 6756039 |
|
Ywhaq |
|
599650 |
73046 |
191816 |
359232 |
625788 |
|
0.05 |
0.06 |
-0.06 |
0.01 |
0.05 |
|
14-3-3 protein theta |
| 6756041;359385698 |
|
Ywhaz |
|
890368 |
0 |
0 |
0 |
0 |
|
0.05 |
n.v. |
n.v. |
n.v. |
n.v. |
|
14-3-3 protein zeta/delta isoform 1 |
| 359385696;359385698 |
|
Ywhaz |
|
0 |
127871 |
300449 |
616226 |
1152150 |
|
n.v. |
0.09 |
-0.04 |
0.05 |
0.03 |
|
14-3-3 protein zeta/delta isoform 1 |
| 359385700 |
|
Ywhaz |
|
886011 |
129102 |
279607 |
605011 |
1310104 |
|
0.05 |
0.09 |
-0.04 |
0.04 |
0.04 |
|
14-3-3 protein zeta/delta isoform 2 |
| 31982421 |
|
Yy1 |
|
0 |
0 |
0 |
90 |
0 |
|
n.v. |
n.v. |
n.v. |
1.82 |
n.v. |
|
transcriptional repressor protein YY1 |
| 31559926 |
|
Zadh2 |
|
0 |
75 |
40 |
0 |
0 |
|
n.v. |
-0.12 |
-1.37 |
n.v. |
n.v. |
|
zinc-binding alcohol dehydrogenase domain-containing
protein 2 |
| 12746436 |
|
Zak |
|
0 |
0 |
1004 |
0 |
0 |
|
n.v. |
n.v. |
0.58 |
n.v. |
n.v. |
|
mitogen-activated protein kinase kinase kinase MLT
isoform 1 |
| 256665241 |
|
Zan |
|
3661 |
0 |
2919 |
5984 |
0 |
|
0.14 |
n.v. |
0.04 |
0 |
n.v. |
|
zonadhesin |
| 31088890 |
|
Zbed4 |
|
0 |
0 |
111 |
3233 |
0 |
|
n.v. |
n.v. |
-0.07 |
-0.19 |
n.v. |
|
zinc finger BED domain-containing protein 4 |
| 258645088 |
|
Zbtb11 |
|
0 |
0 |
0 |
0 |
0 |
|
n.v. |
n.v. |
n.v. |
1.04 |
n.v. |
|
zinc finger and BTB domain containing 11 |
| 21746142 |
|
Zbtb8os |
|
0 |
121 |
290 |
0 |
1253 |
|
n.v. |
0.08 |
0.14 |
n.v. |
-0.28 |
|
protein archease |
| 27502351 |
|
Zc2hc1a |
|
0 |
0 |
0 |
0 |
96 |
|
n.v. |
n.v. |
n.v. |
n.v. |
0.82 |
|
zinc finger C2HC domain-containing protein 1A |
| 115270986 |
|
Zc3h11a |
|
769 |
0 |
26 |
0 |
0 |
|
0.1 |
n.v. |
0.38 |
n.v. |
n.v. |
|
zinc finger CCCH domain-containing protein 11A |
| 231570586 |
|
Zc3h14 |
|
1501 |
0 |
0 |
0 |
0 |
|
0.01 |
n.v. |
n.v. |
n.v. |
n.v. |
|
zinc finger CCCH domain-containing protein 14 isoform a |
| 34368584 |
|
Zc3h15 |
|
0 |
113 |
9272 |
33037 |
54 |
|
n.v. |
-1.07 |
0.1 |
-0.03 |
0.49 |
|
zinc finger CCCH domain-containing protein 15 |
| 71725355 |
|
Zc3h18 |
|
915 |
294 |
0 |
1809 |
0 |
|
0.32 |
0.17 |
n.v. |
-0.02 |
n.v. |
|
zinc finger CCCH domain-containing protein 18 isoform b |
| 71979671 |
|
Zc3h18 |
|
915 |
294 |
0 |
1809 |
0 |
|
0.32 |
0.17 |
n.v. |
-0.02 |
n.v. |
|
zinc finger CCCH domain-containing protein 18 isoform a |
| 156717216 |
|
Zc3h6 |
|
0 |
0 |
0 |
8 |
0 |
|
n.v. |
n.v. |
n.v. |
0.08 |
n.v. |
|
zinc finger CCCH domain-containing protein 6 |
| 226958485 |
|
Zc3h7a |
|
0 |
0 |
1220 |
0 |
0 |
|
n.v. |
n.v. |
0.25 |
n.v. |
n.v. |
|
zinc finger CCCH-type containing 7A |
| 124486616 |
|
Zc3h7b |
|
0 |
0 |
6370 |
33 |
0 |
|
n.v. |
n.v. |
0.17 |
3.45 |
n.v. |
|
zinc finger CCCH domain-containing protein 7B |
| 85719326 |
|
Zc3h8 |
|
0 |
0 |
417 |
0 |
0 |
|
n.v. |
n.v. |
-0.72 |
n.v. |
n.v. |
|
zinc finger CCCH domain-containing protein 8 |
| 21746169 |
|
Zc3hav1 |
|
0 |
0 |
274 |
0 |
0 |
|
n.v. |
n.v. |
0.5 |
n.v. |
n.v. |
|
zinc finger CCCH-type antiviral protein 1 isoform 2 |
| 227116322 |
|
Zc3hav1 |
|
0 |
0 |
274 |
0 |
0 |
|
n.v. |
n.v. |
0.5 |
n.v. |
n.v. |
|
zinc finger CCCH-type antiviral protein 1 isoform 1 |
| 27754058 |
|
Zcchc10 |
|
0 |
44 |
0 |
0 |
0 |
|
n.v. |
0.31 |
n.v. |
n.v. |
n.v. |
|
zinc finger CCHC domain-containing protein 10 |
| 55925630 |
|
Zcchc13 |
|
0 |
0 |
1 |
0 |
0 |
|
n.v. |
n.v. |
-0.02 |
n.v. |
n.v. |
|
zinc finger CCHC domain-containing protein 13 |
| 23346607 |
|
Zcchc17 |
|
0 |
336 |
0 |
0 |
0 |
|
n.v. |
0.53 |
n.v. |
n.v. |
n.v. |
|
nucleolar protein of 40 kDa |
| 124249222 |
|
Zcchc4 |
|
0 |
0 |
41 |
0 |
0 |
|
n.v. |
n.v. |
0.32 |
n.v. |
n.v. |
|
zinc finger CCHC domain-containing protein 4 |
| 254588108 |
|
Zcchc6 |
|
0 |
4 |
0 |
1784 |
0 |
|
n.v. |
0.46 |
n.v. |
0.12 |
n.v. |
|
terminal uridylyltransferase 7 |
| 169808385 |
|
Zcchc8 |
|
0 |
0 |
0 |
2439 |
0 |
|
n.v. |
n.v. |
n.v. |
-0.06 |
n.v. |
|
zinc finger CCHC domain-containing protein 8 |
| 21450253 |
|
Zdhhc5 |
|
0 |
0 |
1 |
0 |
0 |
|
n.v. |
n.v. |
0.18 |
n.v. |
n.v. |
|
palmitoyltransferase ZDHHC5 |
| 31542271 |
|
Zer1 |
|
0 |
0 |
0 |
1383 |
0 |
|
n.v. |
n.v. |
n.v. |
-0.08 |
n.v. |
|
protein zer-1 homolog |
| 31982674 |
|
Zfand1 |
|
0 |
681 |
170 |
3397 |
3041 |
|
n.v. |
0.36 |
0.14 |
0.3 |
0.1 |
|
AN1-type zinc finger protein 1 |
| 229577434;229577442 |
|
Zfand2b |
|
0 |
0 |
0 |
0 |
1692 |
|
n.v. |
n.v. |
n.v. |
n.v. |
-0.19 |
|
AN1-type zinc finger protein 2B |
| 22507321 |
|
Zfand3 |
|
0 |
0 |
0 |
0 |
2067 |
|
n.v. |
n.v. |
n.v. |
n.v. |
-0.47 |
|
AN1-type zinc finger protein 3 |
| 6677605 |
|
Zfand5 |
|
0 |
0 |
16 |
188 |
129 |
|
n.v. |
n.v. |
0.13 |
0.34 |
0.09 |
|
AN1-type zinc finger protein 5 |
| 15805026 |
|
Zfand6 |
|
0 |
0 |
0 |
2226 |
5494 |
|
n.v. |
n.v. |
n.v. |
0.08 |
0.17 |
|
AN1-type zinc finger protein 6 |
| 90991706 |
|
Zfc3h1 |
|
0 |
0 |
31 |
0 |
0 |
|
n.v. |
n.v. |
0.63 |
n.v. |
n.v. |
|
proline/serine-rich coiled-coil 2 |
| 110225364 |
|
Zfhx3 |
|
0 |
0 |
0 |
0 |
514 |
|
n.v. |
n.v. |
n.v. |
n.v. |
-0.23 |
|
zinc finger homeobox protein 3 |
| 261823966 |
|
Zfml |
|
0 |
340 |
0 |
0 |
0 |
|
n.v. |
-0.05 |
n.v. |
n.v. |
n.v. |
|
zinc finger protein 638 isoform 1 |
| 110626083 |
|
Zfp142 |
|
0 |
376 |
0 |
0 |
0 |
|
n.v. |
-0.02 |
n.v. |
n.v. |
n.v. |
|
zinc finger protein 142 |
| 157823829 |
|
Zfp185 |
|
0 |
0 |
119 |
0 |
0 |
|
n.v. |
n.v. |
0.52 |
n.v. |
n.v. |
|
zinc finger protein 185 isoform a |
| 157823865 |
|
Zfp185 |
|
0 |
0 |
119 |
0 |
0 |
|
n.v. |
n.v. |
0.52 |
n.v. |
n.v. |
|
zinc finger protein 185 isoform b |
| 161760658 |
|
Zfp189 |
|
0 |
71 |
0 |
0 |
0 |
|
n.v. |
3.11 |
n.v. |
n.v. |
n.v. |
|
zinc finger protein 189 |
| 194328715 |
|
Zfp207 |
|
0 |
0 |
3225 |
0 |
0 |
|
n.v. |
n.v. |
-0.11 |
n.v. |
n.v. |
|
zinc finger protein 207 isoform 1 |
| 194328717 |
|
Zfp207 |
|
0 |
0 |
3225 |
0 |
0 |
|
n.v. |
n.v. |
-0.11 |
n.v. |
n.v. |
|
zinc finger protein 207 isoform 2 |
| 194328719 |
|
Zfp207 |
|
0 |
0 |
3225 |
0 |
0 |
|
n.v. |
n.v. |
-0.11 |
n.v. |
n.v. |
|
zinc finger protein 207 isoform 3 |
| 6756051 |
|
Zfp207 |
|
0 |
0 |
3225 |
0 |
0 |
|
n.v. |
n.v. |
-0.11 |
n.v. |
n.v. |
|
zinc finger protein 207 isoform 4 |
| 254939702 |
|
Zfp236 |
|
0 |
0 |
1545 |
0 |
0 |
|
n.v. |
n.v. |
0.4 |
n.v. |
n.v. |
|
zinc finger protein 236 |
| 58037307 |
|
Zfp248 |
|
1501 |
0 |
0 |
0 |
0 |
|
0.01 |
n.v. |
n.v. |
n.v. |
n.v. |
|
zinc finger protein 248 |
| 6756053 |
|
Zfp259 |
|
0 |
23 |
76 |
0 |
28220 |
|
n.v. |
0.76 |
0.2 |
n.v. |
-0.17 |
|
zinc finger protein ZPR1 |
| 169234810 |
|
Zfp292 |
|
0 |
0 |
0 |
0 |
18538 |
|
n.v. |
n.v. |
n.v. |
n.v. |
0.17 |
|
zinc finger protein 292 |
| 56118256 |
|
Zfp324 |
|
0 |
0 |
0 |
0 |
332 |
|
n.v. |
n.v. |
n.v. |
n.v. |
-1.23 |
|
zinc finger protein 324A |
| 269784644 |
|
Zfp326 |
|
4833 |
0 |
78 |
0 |
0 |
|
0.04 |
n.v. |
-0.18 |
n.v. |
n.v. |
|
DBIRD complex subunit ZNF326 |
| 6754396 |
|
Zfp346 |
|
0 |
0 |
212 |
0 |
0 |
|
n.v. |
n.v. |
0.15 |
n.v. |
n.v. |
|
zinc finger protein 346 |
| 238018076 |
|
Zfp428 |
|
0 |
0 |
0 |
0 |
1981 |
|
n.v. |
n.v. |
n.v. |
n.v. |
0.22 |
|
zinc finger protein 428 |
| 226437661 |
|
Zfp511 |
|
0 |
0 |
0 |
0 |
1435 |
|
n.v. |
n.v. |
n.v. |
n.v. |
0 |
|
zinc finger protein 511 |
| 254553392 |
|
Zfp512 |
|
2032 |
0 |
0 |
0 |
0 |
|
-0.3 |
n.v. |
n.v. |
n.v. |
n.v. |
|
zinc finger protein 512 |
| 154759288 |
|
Zfp593 |
|
0 |
46 |
0 |
3724 |
0 |
|
n.v. |
1.05 |
n.v. |
-0.27 |
n.v. |
|
zinc finger protein 593 |
| 34147169 |
|
Zfp598 |
|
0 |
0 |
634 |
8 |
0 |
|
n.v. |
n.v. |
0.26 |
-1.07 |
n.v. |
|
zinc finger protein 598 |
| 255683357 |
|
Zfp605 |
|
0 |
708 |
3673 |
0 |
0 |
|
n.v. |
0.11 |
0.18 |
n.v. |
n.v. |
|
zinc finger protein 605 |
| 121247404 |
|
Zfp61 |
|
0 |
0 |
70 |
0 |
0 |
|
n.v. |
n.v. |
0.01 |
n.v. |
n.v. |
|
zinc finger protein 61 |
| 283837868 |
|
Zfp612 |
|
0 |
0 |
0 |
1645 |
0 |
|
n.v. |
n.v. |
n.v. |
-0.05 |
n.v. |
|
zinc finger protein 612 |
| 21362307 |
|
Zfp622 |
|
0 |
0 |
146 |
10281 |
0 |
|
n.v. |
n.v. |
-0.52 |
-0.13 |
n.v. |
|
zinc finger protein 622 |
| 148276994 |
|
Zfp628 |
|
3661 |
0 |
2919 |
5984 |
0 |
|
0.14 |
n.v. |
0.04 |
0 |
n.v. |
|
zinc finger protein 628 |
| 18875370 |
|
Zfp704 |
|
0 |
0 |
0 |
0 |
375 |
|
n.v. |
n.v. |
n.v. |
n.v. |
-0.26 |
|
zinc finger protein 704 |
| 21312658 |
|
Zfp706 |
|
0 |
0 |
2918 |
475 |
2859 |
|
n.v. |
n.v. |
-0.35 |
-0.21 |
0.12 |
|
zinc finger protein 706 |
| 28893511 |
|
Zfp771 |
|
0 |
0 |
0 |
2447 |
0 |
|
n.v. |
n.v. |
n.v. |
-0.36 |
n.v. |
|
zinc finger protein 771 |
| 124430545 |
|
Zfp804a |
|
0 |
0 |
29 |
0 |
0 |
|
n.v. |
n.v. |
-0.06 |
n.v. |
n.v. |
|
zinc finger protein 804A |
| 253735674 |
|
Zfp804b |
|
0 |
0 |
29 |
0 |
0 |
|
n.v. |
n.v. |
-0.06 |
n.v. |
n.v. |
|
zinc finger protein 804B |
| 31560213 |
|
Zfp830 |
|
0 |
0 |
7 |
0 |
0 |
|
n.v. |
n.v. |
-0.07 |
n.v. |
n.v. |
|
zinc finger protein 830 |
| 75677466 |
|
Zfp865 |
|
0 |
0 |
0 |
0 |
0 |
|
-0.17 |
n.v. |
n.v. |
n.v. |
n.v. |
|
zinc finger protein 865 |
| 90669983 |
|
Zfp91 |
|
0 |
0 |
0 |
2046 |
0 |
|
n.v. |
n.v. |
n.v. |
0.03 |
n.v. |
|
E3 ubiquitin-protein ligase ZFP91 |
| 13195658 |
|
Zfpl1 |
|
5583 |
1023 |
230 |
8 |
0 |
|
0.11 |
-0.03 |
-0.15 |
0.63 |
n.v. |
|
zinc finger protein-like 1 |
| 168480106 |
|
Zfr |
|
0 |
0 |
2044 |
917 |
0 |
|
n.v. |
n.v. |
0.09 |
-0.32 |
n.v. |
|
zinc finger RNA-binding protein |
| 110625853 |
|
Zfyve1 |
|
0 |
211 |
61 |
0 |
54 |
|
n.v. |
0.49 |
0.17 |
n.v. |
-0.07 |
|
zinc finger FYVE domain-containing protein 1 |
| 258679475 |
|
Zfyve19 |
|
567 |
0 |
0 |
0 |
2388 |
|
0.13 |
n.v. |
n.v. |
n.v. |
-0.55 |
|
zinc finger FYVE domain-containing protein 19 isoform 1 |
| 258679477 |
|
Zfyve19 |
|
567 |
0 |
0 |
0 |
2388 |
|
0.13 |
n.v. |
n.v. |
n.v. |
-0.55 |
|
zinc finger FYVE domain-containing protein 19 isoform 2 |
| 31541996 |
|
Zfyve20 |
|
0 |
0 |
0 |
0 |
803 |
|
n.v. |
n.v. |
n.v. |
n.v. |
-0.23 |
|
rabenosyn-5 |
| 112818584 |
|
Zfyve26 |
|
0 |
0 |
138 |
0 |
0 |
|
n.v. |
n.v. |
-0.56 |
n.v. |
n.v. |
|
zinc finger FYVE domain-containing protein 26 |
| 40254321 |
|
Zhx3 |
|
0 |
0 |
0 |
0 |
1896 |
|
n.v. |
n.v. |
n.v. |
n.v. |
-0.19 |
|
zinc fingers and homeoboxes protein 3 |
| 41053864 |
|
Zmiz1 |
|
3661 |
0 |
2919 |
5984 |
0 |
|
0.14 |
n.v. |
0.04 |
0 |
n.v. |
|
zinc finger MIZ domain-containing protein 1 |
| 27370012 |
|
Zmpste24 |
|
0 |
635 |
222 |
0 |
0 |
|
n.v. |
-0.19 |
-0.31 |
n.v. |
n.v. |
|
CAAX prenyl protease 1 homolog |
| 37595742 |
|
Zmym2 |
|
0 |
0 |
0 |
278 |
246 |
|
n.v. |
n.v. |
n.v. |
0.26 |
-0.09 |
|
zinc finger MYM-type protein 2 |
| 359279940 |
|
Zmym5 |
|
0 |
0 |
0 |
884 |
0 |
|
n.v. |
n.v. |
n.v. |
-0.16 |
n.v. |
|
zinc finger MYM-type protein 5 |
| 124487311 |
|
Znfx1 |
|
0 |
54 |
198 |
401 |
900 |
|
n.v. |
-0.06 |
0 |
0.37 |
-0.09 |
|
NFX1-type zinc finger-containing protein 1 |
| 124487366 |
|
Znhit6 |
|
0 |
0 |
0 |
810 |
139 |
|
n.v. |
n.v. |
n.v. |
0.52 |
-0.04 |
|
box C/D snoRNA protein 1 |
| 74315981 |
|
Zranb2 |
|
0 |
12114 |
6324 |
18819 |
0 |
|
n.v. |
0.16 |
0.03 |
0.02 |
n.v. |
|
zinc finger Ran-binding domain-containing protein 2 |
| 124430705 |
|
Zranb3 |
|
0 |
0 |
3 |
0 |
0 |
|
n.v. |
n.v. |
0.32 |
n.v. |
n.v. |
|
DNA annealing helicase and endonuclease ZRANB3 |
| 124430709 |
|
Zswim8 |
|
0 |
0 |
9 |
0 |
0 |
|
n.v. |
n.v. |
0.43 |
n.v. |
n.v. |
|
zinc finger SWIM domain-containing protein 8 isoform 1 |
| 355390253 |
|
Zswim8 |
|
0 |
0 |
9 |
0 |
0 |
|
n.v. |
n.v. |
0.43 |
n.v. |
n.v. |
|
zinc finger SWIM domain-containing protein 8 isoform 2 |
| 355390255 |
|
Zswim8 |
|
0 |
0 |
9 |
0 |
0 |
|
n.v. |
n.v. |
0.43 |
n.v. |
n.v. |
|
zinc finger SWIM domain-containing protein 8 isoform 3 |
| 22165349 |
|
Zw10 |
|
110 |
0 |
260 |
2325 |
525 |
|
0.01 |
n.v. |
-0.06 |
0.15 |
0.75 |
|
centromere/kinetochore protein zw10 homolog |
| 257153357 |
|
Zwilch |
|
0 |
0 |
0 |
6540 |
0 |
|
n.v. |
n.v. |
n.v. |
0 |
n.v. |
|
protein zwilch homolog |
| 21326440 |
|
Zwint |
|
0 |
0 |
0 |
2652 |
0 |
|
n.v. |
n.v. |
n.v. |
-1.01 |
n.v. |
|
ZW10 interactor |
| 125490365 |
|
Zxdb |
|
3661 |
0 |
2919 |
5984 |
0 |
|
0.14 |
n.v. |
0.04 |
0 |
n.v. |
|
zinc finger X-linked protein ZXDA/ZXDB |
| 158937319 |
|
Zxdc |
|
3661 |
0 |
2919 |
5984 |
0 |
|
0.14 |
n.v. |
0.04 |
0 |
n.v. |
|
zinc finger protein ZXDC isoform 1 |
| 27370506 |
|
Zxdc |
|
3661 |
0 |
2919 |
5984 |
0 |
|
0.14 |
n.v. |
0.04 |
0 |
n.v. |
|
zinc finger protein ZXDC isoform 2 |
| 6756085 |
|
Zyx |
|
0 |
29 |
56 |
0 |
28712 |
|
n.v. |
0.52 |
0.92 |
n.v. |
0.24 |
|
zyxin |
| 113865905 |
|
Zzef1 |
|
0 |
0 |
0 |
4780 |
43 |
|
n.v. |
n.v. |
n.v. |
0.1 |
-0.24 |
|
zinc finger ZZ-type and EF-hand domain-containing protein
1 |
| 126090572 |
|
A230046K03Rik |
|
73 |
616 |
1333 |
9184 |
3020 |
|
-0.27 |
0.34 |
-0.47 |
0.14 |
0.01 |
|
WASH complex subunit 7 |
| 25072201 |
|
A630007B06Rik |
|
0 |
0 |
0 |
0 |
8728 |
|
n.v. |
n.v. |
n.v. |
n.v. |
0.02 |
|
uncharacterized protein C10orf118 homolog |
| 440546392 |
|
AA414768 |
|
0 |
0 |
9 |
0 |
2752 |
|
n.v. |
n.v. |
0.03 |
n.v. |
0.38 |
|
expressed sequence AA414768 |
| 162417980 |
|
AA986860 |
|
0 |
0 |
1125 |
0 |
0 |
|
n.v. |
n.v. |
-0.24 |
n.v. |
n.v. |
|
specifically androgen-regulated gene protein |
| 10946822 |
|
0610007P14Rik |
|
5492 |
2292 |
1220 |
0 |
0 |
|
0.14 |
-0.19 |
-0.3 |
n.v. |
n.v. |
|
probable ergosterol biosynthetic protein 28 |
| 13384686 |
|
0610009B22Rik |
|
0 |
75 |
309 |
6409 |
54 |
|
n.v. |
0.22 |
0.02 |
-0.01 |
-0.08 |
|
uncharacterized protein LOC66050 |
| 13384692 |
|
0610009D07Rik |
|
7377 |
526 |
1351 |
11566 |
0 |
|
0.01 |
0.47 |
0 |
0.01 |
n.v. |
|
pre-mRNA branch site protein p14 |
| 117956375 |
|
0610010F05Rik |
|
0 |
0 |
80 |
0 |
0 |
|
n.v. |
n.v. |
0.21 |
n.v. |
n.v. |
|
uncharacterized protein KIAA1841 |
| 21389318 |
|
0610010K14Rik |
|
0 |
0 |
0 |
65 |
1917 |
|
n.v. |
n.v. |
n.v. |
-0.2 |
-0.31 |
|
chromatin complexes subunit BAP18 isoform 4 |
| 294862278 |
|
0610010K14Rik |
|
0 |
0 |
0 |
65 |
1917 |
|
n.v. |
n.v. |
n.v. |
-0.2 |
-0.31 |
|
chromatin complexes subunit BAP18 isoform 1 |
| 294862282 |
|
0610010K14Rik |
|
0 |
0 |
0 |
65 |
1917 |
|
n.v. |
n.v. |
n.v. |
-0.2 |
-0.31 |
|
chromatin complexes subunit BAP18 isoform 3 |
| 294862289 |
|
0610010K14Rik |
|
0 |
0 |
0 |
65 |
1917 |
|
n.v. |
n.v. |
n.v. |
-0.2 |
-0.31 |
|
chromatin complexes subunit BAP18 isoform 5 |
| 294862292 |
|
0610010K14Rik |
|
0 |
0 |
0 |
65 |
1917 |
|
n.v. |
n.v. |
n.v. |
-0.2 |
-0.31 |
|
chromatin complexes subunit BAP18 isoform 6 |
| 295054298 |
|
0610010K14Rik |
|
0 |
0 |
0 |
65 |
1917 |
|
n.v. |
n.v. |
n.v. |
-0.2 |
-0.31 |
|
chromatin complexes subunit BAP18 isoform 2 |
| 58037115 |
|
0610011F06Rik |
|
0 |
1355 |
919 |
966 |
10142 |
|
n.v. |
0.27 |
-0.05 |
0.12 |
0.27 |
|
UPF0585 protein C16orf13 homolog |
| 9910458 |
|
0610031J06Rik |
|
0 |
319 |
0 |
0 |
0 |
|
n.v. |
-0.57 |
n.v. |
n.v. |
n.v. |
|
lysosomal protein NCU-G1 precursor |
| 21539639 |
|
0610037L13Rik |
|
0 |
0 |
718 |
1236 |
17264 |
|
n.v. |
n.v. |
-0.36 |
0.17 |
0.03 |
|
UPF0587 protein C1orf123 homolog |
| 294345426 |
|
1110001A16Rik |
|
0 |
232 |
0 |
0 |
0 |
|
n.v. |
-0.17 |
n.v. |
n.v. |
n.v. |
|
uncharacterized protein LOC68554 |
| 13384728 |
|
1110001J03Rik |
|
0 |
236 |
0 |
0 |
0 |
|
n.v. |
-0.27 |
n.v. |
n.v. |
n.v. |
|
UPF0562 protein C7orf55 homolog |
| 9790217 |
|
1110004F10Rik |
|
0 |
0 |
0 |
1973 |
19930 |
|
n.v. |
n.v. |
n.v. |
0.13 |
0.21 |
|
small acidic protein |
| 21312030 |
|
1110007C09Rik |
|
37 |
1244 |
23 |
0 |
0 |
|
0.01 |
-0.23 |
-0.17 |
n.v. |
n.v. |
|
bcl10-interacting CARD protein |
| 13385630 |
|
1110008F13Rik |
|
0 |
161 |
0 |
0 |
0 |
|
n.v. |
-0.16 |
n.v. |
n.v. |
n.v. |
|
uncharacterized protein C20orf24 homolog |
| 227908787 |
|
1110008L16Rik |
|
0 |
397 |
0 |
0 |
0 |
|
n.v. |
0.16 |
n.v. |
n.v. |
n.v. |
|
mitochondrial ribonuclease P protein 3 precursor |
| 21312070 |
|
1110012L19Rik |
|
0 |
0 |
0 |
0 |
439 |
|
n.v. |
n.v. |
n.v. |
n.v. |
0.02 |
|
uncharacterized protein CXorf40 homolog |
| 268370114 |
|
1110057K04Rik |
|
21601 |
5749 |
4959 |
0 |
0 |
|
-0.11 |
0.03 |
-0.14 |
n.v. |
n.v. |
|
UPF0554 protein C2orf43 homolog isoform 2 |
| 268370116 |
|
1110057K04Rik |
|
21601 |
5749 |
4984 |
0 |
0 |
|
-0.11 |
0.03 |
-0.14 |
n.v. |
n.v. |
|
UPF0554 protein C2orf43 homolog isoform 3 |
| 269995975 |
|
1110057K04Rik |
|
21601 |
7523 |
4984 |
0 |
0 |
|
-0.11 |
-0.04 |
-0.14 |
n.v. |
n.v. |
|
UPF0554 protein C2orf43 homolog isoform 1 |
| 229577372 |
|
1110058L19Rik |
|
0 |
56 |
0 |
0 |
0 |
|
n.v. |
-0.78 |
n.v. |
n.v. |
n.v. |
|
UPF0369 protein C6orf57 homolog precursor |
| 21312338 |
|
1600014C10Rik |
|
0 |
0 |
0 |
0 |
2313 |
|
n.v. |
n.v. |
n.v. |
n.v. |
-0.31 |
|
protein C19orf12 homolog |
| 253735769 |
|
1600015I10Rik |
|
0 |
0 |
1117 |
0 |
0 |
|
n.v. |
n.v. |
0.09 |
n.v. |
n.v. |
|
diamine oxidase-like protein 1 precursor |
| 124487358 |
|
1700009N14Rik |
|
325298 |
54394 |
67014 |
127032 |
1182190 |
|
0.03 |
0.01 |
0.03 |
0.01 |
0 |
|
uncharacterized protein LOC75471 |
| 254675147 |
|
1700011E24Rik |
|
0 |
0 |
3108 |
5975 |
0 |
|
n.v. |
n.v. |
0.06 |
-0.19 |
n.v. |
|
uncharacterized protein C2orf61 homolog |
| 241982748 |
|
1700011I03Rik |
|
0 |
113 |
0 |
0 |
0 |
|
n.v. |
0.31 |
n.v. |
n.v. |
n.v. |
|
uncharacterized protein LOC75444 |
| 21450635 |
|
1700019D03Rik |
|
0 |
46 |
209 |
0 |
0 |
|
n.v. |
-0.6 |
-0.24 |
n.v. |
n.v. |
|
UPF0733 protein C2orf88 homolog |
| 268607534 |
|
1700020D05Rik |
|
330 |
50 |
0 |
0 |
0 |
|
0.37 |
-0.12 |
n.v. |
n.v. |
n.v. |
|
mage-g2 protein |
| 13385904 |
|
1700021F05Rik |
|
1519 |
129 |
0 |
327 |
0 |
|
-0.37 |
-0.61 |
n.v. |
-0.13 |
n.v. |
|
uncharacterized protein C6orf203 homolog |
| 13385590 |
|
1700037H04Rik |
|
220 |
2108 |
915 |
1613 |
11041 |
|
0.1 |
0.1 |
0.02 |
0.37 |
0.12 |
|
UPF0687 protein C20orf27 homolog |
| 90093343 |
|
1700052N19Rik |
|
0 |
0 |
0 |
0 |
9221 |
|
n.v. |
n.v. |
n.v. |
n.v. |
0.26 |
|
UPF0364 protein C6orf211 homolog |
| 343098457 |
|
1700055N04Rik |
|
696 |
14865 |
21828 |
5132 |
1349 |
|
0.38 |
-0.09 |
-0.15 |
-0.21 |
-0.57 |
|
aldehyde dehydrogenase 3 family, member B2-like |
| 85702063 |
|
1700071K01Rik |
|
201769 |
15938 |
9343 |
753 |
0 |
|
0.02 |
-0.25 |
-0.4 |
-0.3 |
n.v. |
|
prohibitin-like |
| 227500514 |
|
1700080E11Rik |
|
0 |
0 |
19 |
0 |
0 |
|
n.v. |
n.v. |
0.6 |
n.v. |
n.v. |
|
uncharacterized protein LOC73532 |
| 13384876 |
|
1810009A15Rik |
|
0 |
628 |
4592 |
10928 |
0 |
|
n.v. |
0.24 |
0.01 |
0.01 |
n.v. |
|
uncharacterized protein LOC66276 |
| 21729757 |
|
1810009N02Rik |
|
0 |
0 |
0 |
0 |
3309 |
|
n.v. |
n.v. |
n.v. |
n.v. |
-0.08 |
|
acetylserotonin O-methyltransferase-like |
| 153791234 |
|
1810022K09Rik |
|
0 |
0 |
0 |
0 |
0 |
|
n.v. |
n.v. |
n.v. |
0.37 |
n.v. |
|
uncharacterized protein C8orf59 homolog |
| 30519953 |
|
1810026J23Rik |
|
0 |
1428 |
0 |
0 |
0 |
|
n.v. |
-0.2 |
n.v. |
n.v. |
n.v. |
|
uncharacterized protein C19orf52 homolog |
| 21313570 |
|
1810037I17Rik |
|
0 |
720 |
218 |
115 |
0 |
|
n.v. |
-0.25 |
-0.44 |
-0.19 |
n.v. |
|
uncharacterized protein C4orf3 homolog |
| 74315955 |
|
2010002M12Rik |
|
0 |
328 |
907 |
417 |
0 |
|
n.v. |
0.62 |
0.18 |
0.64 |
n.v. |
|
uncharacterized protein LOC112419 |
| 13385000 |
|
2010012O05Rik |
|
0 |
0 |
0 |
0 |
139 |
|
n.v. |
n.v. |
n.v. |
n.v. |
0.48 |
|
UPF0693 protein C10orf32 homolog |
| 21312554 |
|
2010107E04Rik |
|
0 |
3257 |
354 |
0 |
0 |
|
n.v. |
-0.15 |
-0.33 |
n.v. |
n.v. |
|
6.8 kDa mitochondrial proteolipid |
| 21312460 |
|
2010107G23Rik |
|
1721 |
1678 |
565 |
827 |
0 |
|
0.14 |
-0.23 |
-0.29 |
-0.19 |
n.v. |
|
uncharacterized protein C10orf35 homolog |
| 254675126 |
|
2010300C02Rik |
|
0 |
56576 |
0 |
0 |
0 |
|
n.v. |
0.18 |
n.v. |
n.v. |
n.v. |
|
uncharacterized protein LOC72097 |
| 82918901 |
|
2210011C24Rik |
|
0 |
0 |
310 |
0 |
0 |
|
n.v. |
n.v. |
-0.28 |
n.v. |
n.v. |
|
PREDICTED: uncharacterized protein LOC113230 isoform 3 |
| 39930441 |
|
2210016L21Rik |
|
0 |
637 |
0 |
0 |
246 |
|
n.v. |
0.15 |
n.v. |
n.v. |
0.25 |
|
uncharacterized protein C12orf43 homolog |
| 229576965 |
|
2310007B03Rik |
|
0 |
0 |
3 |
0 |
0 |
|
n.v. |
n.v. |
0.84 |
n.v. |
n.v. |
|
uncharacterized protein C2orf54 homolog |
| 21313500 |
|
2310011J03Rik |
|
0 |
0 |
0 |
0 |
1917 |
|
n.v. |
n.v. |
n.v. |
n.v. |
0.12 |
|
UPF0449 protein C19orf25 homolog |
| 13259376 |
|
2310033P09Rik |
|
0 |
1680 |
1974 |
1956 |
0 |
|
n.v. |
0.12 |
-0.23 |
-0.33 |
n.v. |
|
multiple myeloma tumor-associated protein 2 homolog |
| 170014744 |
|
2310035C23Rik |
|
0 |
0 |
0 |
4011 |
3898 |
|
n.v. |
n.v. |
n.v. |
0.07 |
-0.1 |
|
lisH domain and HEAT repeat-containing protein KIAA1468
isoform 1 |
| 170014746 |
|
2310035C23Rik |
|
0 |
0 |
0 |
4011 |
3898 |
|
n.v. |
n.v. |
n.v. |
0.07 |
-0.1 |
|
lisH domain and HEAT repeat-containing protein KIAA1468
isoform 2 |
| 85362708 |
|
2310036O22Rik |
|
0 |
328 |
91 |
1531 |
2345 |
|
n.v. |
-0.01 |
-0.08 |
-0.19 |
-0.81 |
|
uncharacterized protein C19orf43 homolog |
| 13385462 |
|
2310039H08Rik |
|
0 |
0 |
0 |
0 |
900 |
|
n.v. |
n.v. |
n.v. |
n.v. |
0.01 |
|
uncharacterized protein C6orf226 homolog |
| 120952555 |
|
2310047M10Rik |
|
0 |
0 |
32 |
0 |
0 |
|
n.v. |
n.v. |
0.26 |
n.v. |
n.v. |
|
uncharacterized protein C17orf59 homolog |
| 262072980 |
|
2410002F23Rik |
|
0 |
73 |
3 |
720 |
0 |
|
n.v. |
0.42 |
0.28 |
0.17 |
n.v. |
|
uncharacterized protein LOC668661 |
| 13384984 |
|
2410004B18Rik |
|
0 |
0 |
0 |
0 |
2431 |
|
n.v. |
n.v. |
n.v. |
n.v. |
0.18 |
|
UPF0690 protein C1orf52 homolog |
| 134053873 |
|
2410018M08Rik |
|
256 |
3092 |
0 |
0 |
2752 |
|
0.28 |
0.13 |
n.v. |
n.v. |
-0.61 |
|
SCAN domain containing 3 |
| 407262392 |
|
2410127L17Rik |
|
0 |
0 |
214 |
876 |
685 |
|
n.v. |
n.v. |
-0.29 |
-0.13 |
-0.06 |
|
PREDICTED: UPF0586 protein C9orf41 homolog isoform 2 |
| 407262394 |
|
2410127L17Rik |
|
0 |
0 |
214 |
876 |
685 |
|
n.v. |
n.v. |
-0.29 |
-0.13 |
-0.06 |
|
PREDICTED: UPF0586 protein C9orf41 homolog isoform 3 |
| 407262390 |
|
2410127L17Rik |
|
0 |
127 |
416 |
876 |
685 |
|
n.v. |
0.11 |
-0.21 |
-0.13 |
-0.06 |
|
PREDICTED: UPF0586 protein C9orf41 homolog isoform 1 |
| 85701660 |
|
2510002D24Rik |
|
0 |
0 |
3 |
0 |
0 |
|
n.v. |
n.v. |
-0.29 |
n.v. |
n.v. |
|
UPF0545 protein C22orf39 homolog |
| 72384371 |
|
2510003E04Rik |
|
0 |
374 |
0 |
1744 |
1574 |
|
n.v. |
0.13 |
n.v. |
-0.15 |
-0.06 |
|
KIF1-binding protein |
| 225543561 |
|
2510039O18Rik |
|
0 |
1486 |
0 |
0 |
0 |
|
n.v. |
-0.37 |
n.v. |
n.v. |
n.v. |
|
uncharacterized protein KIAA2013 precursor |
| 160333472 |
|
2510049J12Rik |
|
0 |
0 |
0 |
0 |
2174 |
|
n.v. |
n.v. |
n.v. |
n.v. |
0.12 |
|
uncharacterized protein LOC70291 |
| 19526920 |
|
2610018G03Rik |
|
0 |
3593 |
13865 |
11427 |
12262 |
|
n.v. |
0.12 |
-0.17 |
0.05 |
0.01 |
|
serine/threonine-protein kinase MST4 |
| 47498088 |
|
2610034B18Rik |
|
0 |
355 |
1247 |
2055 |
16353 |
|
n.v. |
-0.11 |
-0.03 |
0.07 |
0.08 |
|
UPF0552 protein C15orf38 homolog |
| 198278498 |
|
2700029M09Rik |
|
0 |
31 |
350 |
638 |
10410 |
|
n.v. |
-0.22 |
0.01 |
0.08 |
-0.19 |
|
UPF0609 protein C4orf27 homolog |
| 295389569 |
|
2700050L05Rik |
|
0 |
0 |
3 |
0 |
0 |
|
n.v. |
n.v. |
0.12 |
n.v. |
n.v. |
|
erythroid differentiation-related factor 1 |
| 13386026 |
|
2700060E02Rik |
|
2398 |
1687 |
17277 |
10674 |
6651 |
|
0.12 |
0.14 |
0.04 |
-0.11 |
0.01 |
|
UPF0568 protein C14orf166 homolog |
| 13386028 |
|
2700062C07Rik |
|
0 |
0 |
0 |
508 |
0 |
|
n.v. |
n.v. |
n.v. |
-0.2 |
n.v. |
|
UPF0711 protein C18orf21 homolog |
| 254540194 |
|
2700089E24Rik |
|
0 |
209 |
0 |
0 |
0 |
|
n.v. |
-0.17 |
n.v. |
n.v. |
n.v. |
|
uncharacterized protein LOC381820 isoform 3 |
| 409264588 |
|
2700089E24Rik |
|
0 |
209 |
0 |
0 |
0 |
|
n.v. |
-0.17 |
n.v. |
n.v. |
n.v. |
|
uncharacterized protein LOC381820 isoform 1 |
| 409264649 |
|
2700089E24Rik |
|
0 |
209 |
0 |
0 |
0 |
|
n.v. |
-0.17 |
n.v. |
n.v. |
n.v. |
|
uncharacterized protein LOC381820 isoform 2 |
| 76781489 |
|
2700094K13Rik |
|
1428 |
856 |
2995 |
11067 |
3170 |
|
-0.14 |
-0.1 |
-0.06 |
-0.22 |
0.06 |
|
selenoprotein H |
| 62510085 |
|
2810408M09Rik |
|
0 |
157 |
7 |
57 |
2206 |
|
n.v. |
0.1 |
0.01 |
-0.04 |
0.06 |
|
uncharacterized protein LOC381406 |
| 71773932 |
|
2810417H13Rik |
|
0 |
0 |
3 |
98 |
2228 |
|
n.v. |
n.v. |
-0.58 |
0.08 |
0.28 |
|
PCNA-associated factor |
| 13385020 |
|
2810428I15Rik |
|
0 |
0 |
0 |
0 |
760 |
|
n.v. |
n.v. |
n.v. |
n.v. |
-0.22 |
|
uncharacterized protein C19orf60 homolog |
| 28077063 |
|
3110002H16Rik |
|
0 |
353 |
214 |
0 |
0 |
|
n.v. |
-0.11 |
-0.14 |
n.v. |
n.v. |
|
uncharacterized protein C18orf8 homolog |
| 13385576 |
|
3110040N11Rik |
|
0 |
0 |
10 |
0 |
2999 |
|
n.v. |
n.v. |
1.12 |
n.v. |
0.11 |
|
UPF0235 protein C15orf40 homolog |
| 146134371 |
|
3110082I17Rik |
|
714 |
238 |
3014 |
1326 |
300 |
|
-0.17 |
0.24 |
-0.03 |
-0.39 |
-1.26 |
|
uncharacterized protein C7orf50 homolog |
| 269914154 |
|
4732456N10Rik |
|
1848743 |
58223 |
66148 |
173976 |
169210 |
|
-0.05 |
-0.2 |
-0.66 |
-0.44 |
-0.63 |
|
uncharacterized protein LOC239673 |
| 34328303 |
|
4921504E06Rik |
|
0 |
0 |
79 |
0 |
0 |
|
n.v. |
n.v. |
-0.05 |
n.v. |
n.v. |
|
uncharacterized protein LOC70909 |
| 13385182 |
|
4921524J17Rik |
|
0 |
0 |
0 |
0 |
75 |
|
n.v. |
n.v. |
n.v. |
n.v. |
0.61 |
|
UPF0547 protein C16orf87 homolog |
| 147905039 |
|
4922501C03Rik |
|
3130 |
1146 |
9885 |
254 |
0 |
|
0.09 |
0.18 |
0.22 |
0.07 |
n.v. |
|
centrosomal protein of 162 kDa |
| 197116351 |
|
4930404A10Rik |
|
0 |
0 |
3805 |
0 |
0 |
|
n.v. |
n.v. |
0.08 |
n.v. |
n.v. |
|
uncharacterized protein LOC74847 |
| 171906608 |
|
4930430F08Rik |
|
0 |
0 |
0 |
0 |
932 |
|
n.v. |
n.v. |
n.v. |
n.v. |
0.4 |
|
uncharacterized protein C12orf29 homolog |
| 166851844 |
|
4930506M07Rik |
|
0 |
0 |
282 |
37277 |
62576 |
|
n.v. |
n.v. |
-0.21 |
0.04 |
0.14 |
|
shootin-1 isoform 1 |
| 30424776 |
|
4930506M07Rik |
|
0 |
0 |
155 |
29943 |
42667 |
|
n.v. |
n.v. |
-0.46 |
0.06 |
0.15 |
|
shootin-1 isoform 2 |
| 240120058 |
|
4930544G11Rik |
|
74268 |
7440 |
45697 |
34396 |
104867 |
|
0.04 |
0.16 |
0.03 |
0.05 |
0.09 |
|
ras homolog gene family, member A-like |
| 254692981 |
|
4930579G24Rik |
|
0 |
0 |
0 |
0 |
514 |
|
n.v. |
n.v. |
n.v. |
n.v. |
0.07 |
|
uncharacterized protein C4orf46 homolog |
| 313747468 |
|
4931406C07Rik |
|
0 |
5006 |
4792 |
524 |
49596 |
|
n.v. |
0.11 |
0.01 |
-0.01 |
0.09 |
|
ester hydrolase C11orf54 homolog |
| 282721066 |
|
4931409K22Rik |
|
0 |
0 |
645 |
5615 |
0 |
|
n.v. |
n.v. |
-0.43 |
-0.15 |
n.v. |
|
IQ and AAA domain-containing protein 1-like |
| 124487449 |
|
4931429I11Rik |
|
0 |
0 |
0 |
0 |
1050 |
|
n.v. |
n.v. |
n.v. |
n.v. |
0.34 |
|
uncharacterized protein LOC70989 |
| 237757320 |
|
4933406M09Rik |
|
4503 |
524 |
17863 |
0 |
0 |
|
-0.03 |
0.32 |
0.19 |
n.v. |
n.v. |
|
uncharacterized protein LOC240755 |
| 33859728 |
|
4933427D14Rik |
|
0 |
0 |
0 |
0 |
1788 |
|
n.v. |
n.v. |
n.v. |
n.v. |
-0.16 |
|
uncharacterized protein KIAA0753 |
| 110625765 |
|
5730455P16Rik |
|
0 |
106 |
195 |
1359 |
64 |
|
n.v. |
0.45 |
0.14 |
0.12 |
0.29 |
|
protein Njmu-R1 |
| 28076961 |
|
5730508B09Rik |
|
622 |
559 |
228 |
0 |
0 |
|
0 |
-0.02 |
-0.3 |
-0.4 |
n.v. |
|
uncharacterized protein C4orf32 homolog |
| 58037511 |
|
6030458C11Rik |
|
0 |
0 |
0 |
0 |
739 |
|
n.v. |
n.v. |
n.v. |
n.v. |
-0.02 |
|
UPF0489 protein C5orf22 homolog isoform b |
| 87196345 |
|
8030462N17Rik |
|
0 |
0 |
0 |
0 |
942 |
|
n.v. |
n.v. |
n.v. |
n.v. |
-0.65 |
|
uncharacterized protein C18orf25 homolog |
| 31560063 |
|
8430419L09Rik |
|
0 |
27 |
208 |
0 |
0 |
|
n.v. |
-0.89 |
-0.09 |
n.v. |
n.v. |
|
uncharacterized protein KIAA1467 |
| 31981784 |
|
9030617O03Rik |
|
0 |
6150 |
0 |
0 |
375 |
|
n.v. |
-0.14 |
n.v. |
n.v. |
0.24 |
|
UPF0317 protein C14orf159 homolog, mitochondrial
precursor |
| 270047485 |
|
9030624J02Rik |
|
0 |
0 |
3325 |
9675 |
0 |
|
n.v. |
n.v. |
-0.33 |
0.12 |
n.v. |
|
UPF0505 protein C16orf62 homolog |
| 139947660 |
|
9130011E15Rik |
|
0 |
73 |
9 |
671 |
1649 |
|
n.v. |
0.35 |
0.34 |
-0.21 |
0.33 |
|
UPF0668 protein C10orf76 homolog |
| 110625972 |
|
9330182L06Rik |
|
0 |
785 |
181 |
0 |
0 |
|
n.v. |
0.01 |
-0.02 |
n.v. |
n.v. |
|
UPF0577 protein KIAA1324-like homolog precursor |
| 145587094 |
|
9430016H08Rik |
|
0 |
1125 |
0 |
0 |
0 |
|
n.v. |
-0.45 |
n.v. |
n.v. |
n.v. |
|
uncharacterized protein C2orf47 homolog, mitochondrial
precursor |
| 21311929 |
|
9430023L20Rik |
|
0 |
113 |
63 |
0 |
0 |
|
n.v. |
-0.35 |
-0.16 |
n.v. |
n.v. |
|
autophagy-related protein 101 |
| 242397485 |
|
9430038I01Rik |
|
0 |
0 |
0 |
0 |
86 |
|
n.v. |
n.v. |
n.v. |
n.v. |
0.17 |
|
uncharacterized protein LOC77252 |
| 257467625 |
|
9530053A07Rik |
|
0 |
635 |
0 |
409 |
814 |
|
n.v. |
-0.23 |
n.v. |
-0.12 |
-0.21 |
|
Fc fragment of IgG binding protein-like precursor |
| 28892859 |
|
9630033F20Rik |
|
0 |
0 |
54 |
0 |
3545 |
|
n.v. |
n.v. |
-0.03 |
n.v. |
0.13 |
|
fructose-2,6-bisphosphatase TIGAR |
| 257467641 |
|
9830001H06Rik |
|
0 |
0 |
259 |
0 |
0 |
|
n.v. |
n.v. |
0.24 |
n.v. |
n.v. |
|
suppressor of glucose by autophagy |
| 295293085 |
|
9930021J03Rik |
|
0 |
0 |
31 |
0 |
0 |
|
n.v. |
n.v. |
0.63 |
n.v. |
n.v. |
|
uncharacterized protein LOC240613 |
|
|
|
|
|
|
|
|
|
|
|
|
|
|
|
|
|
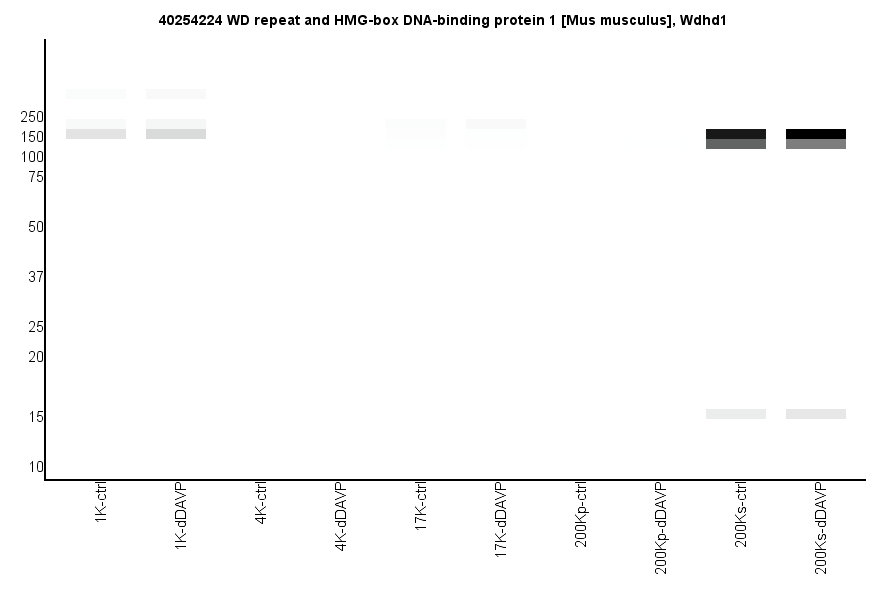
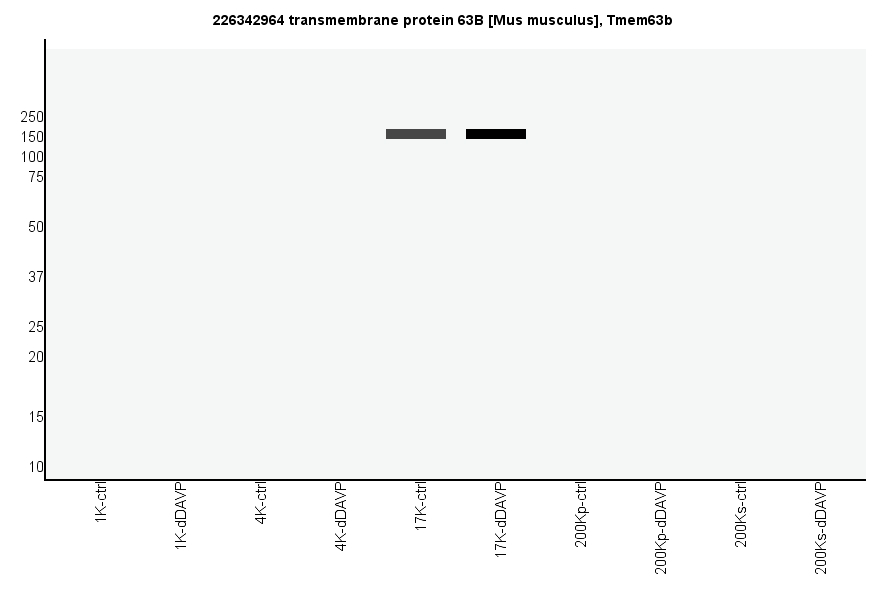
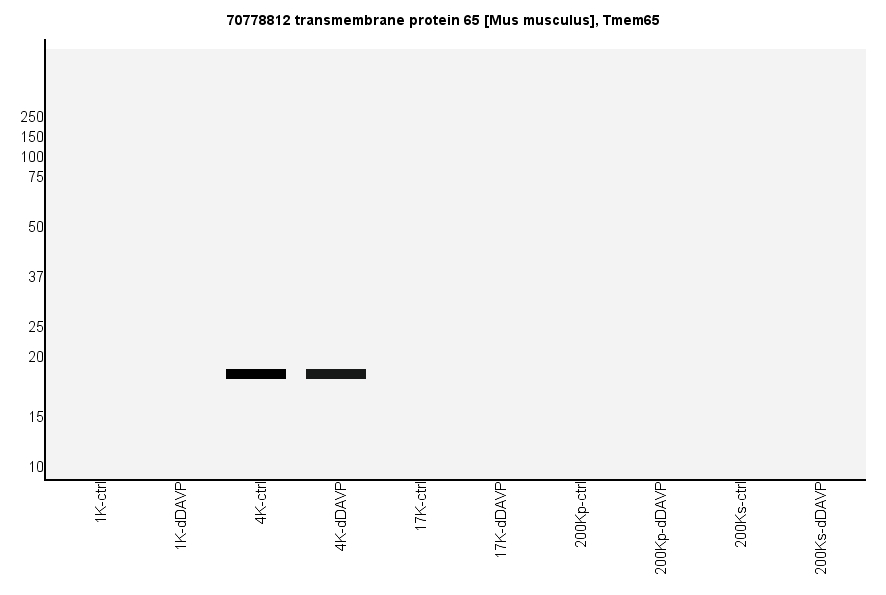
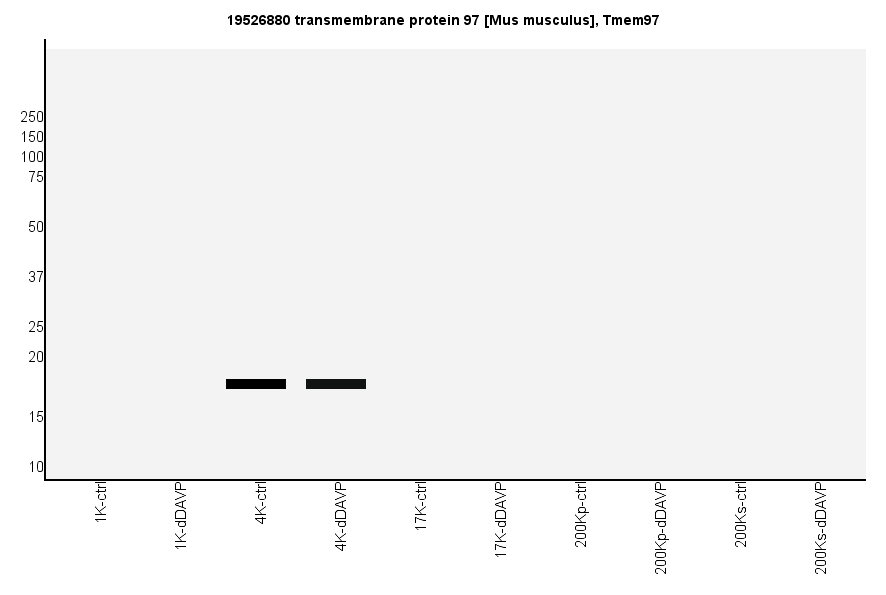
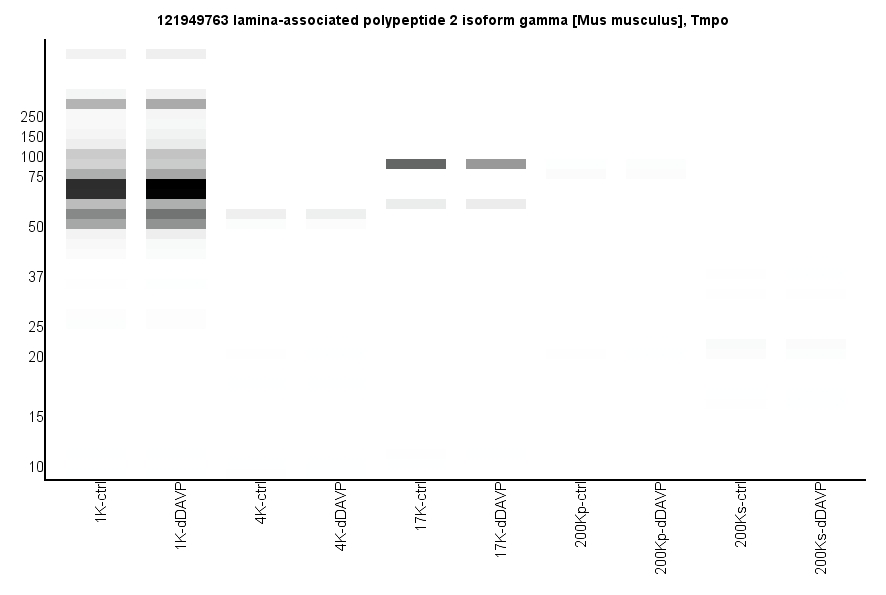
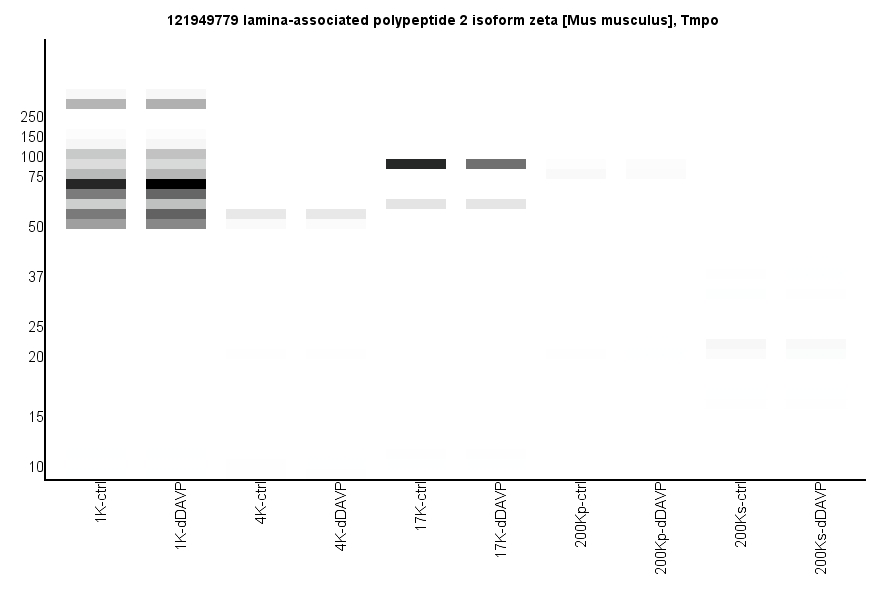
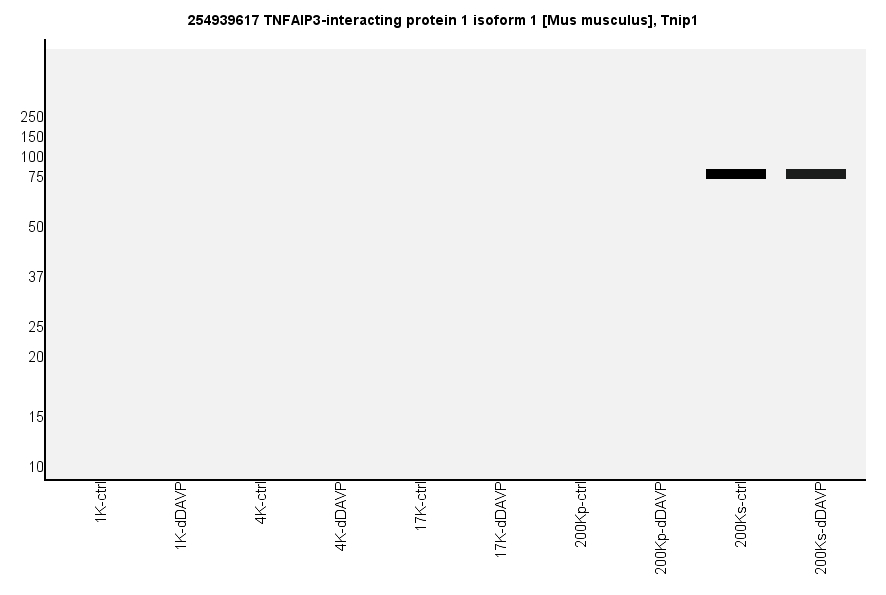
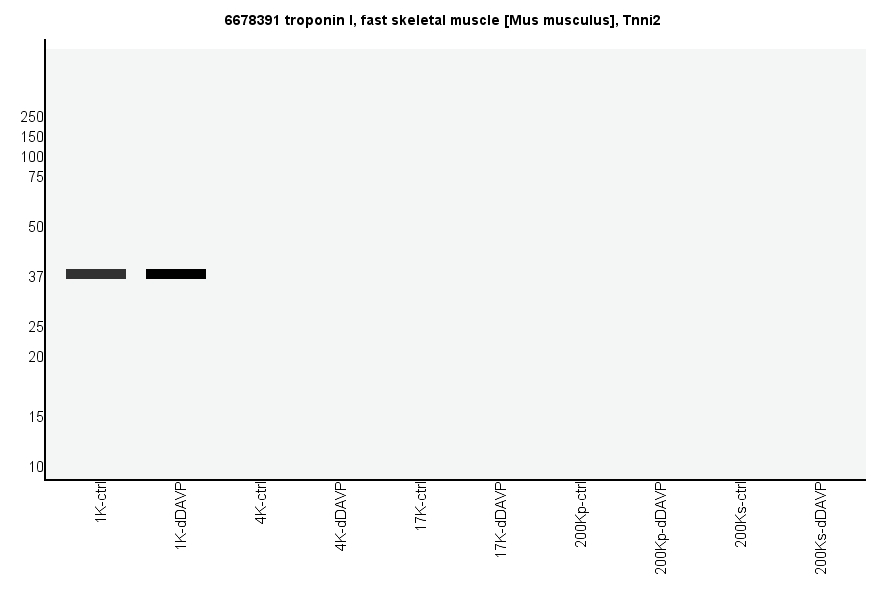
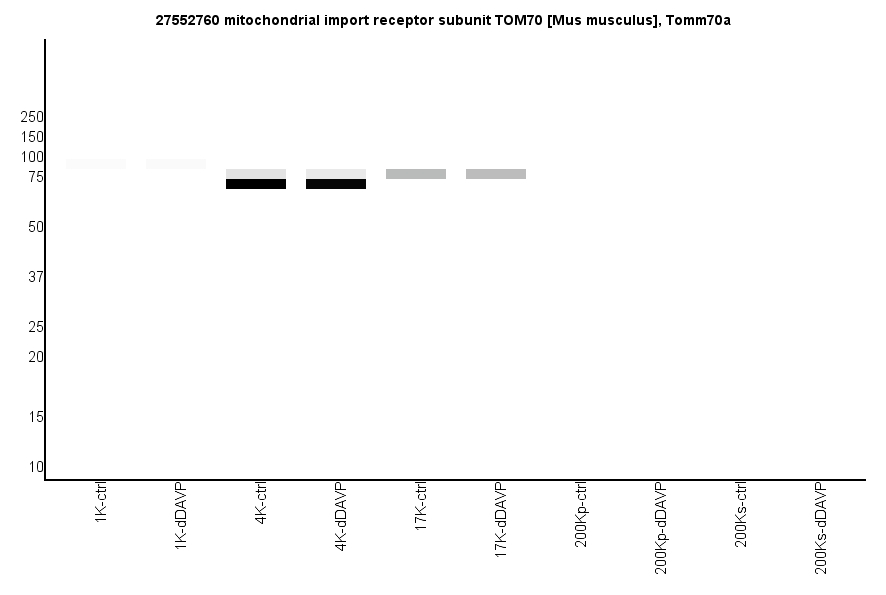
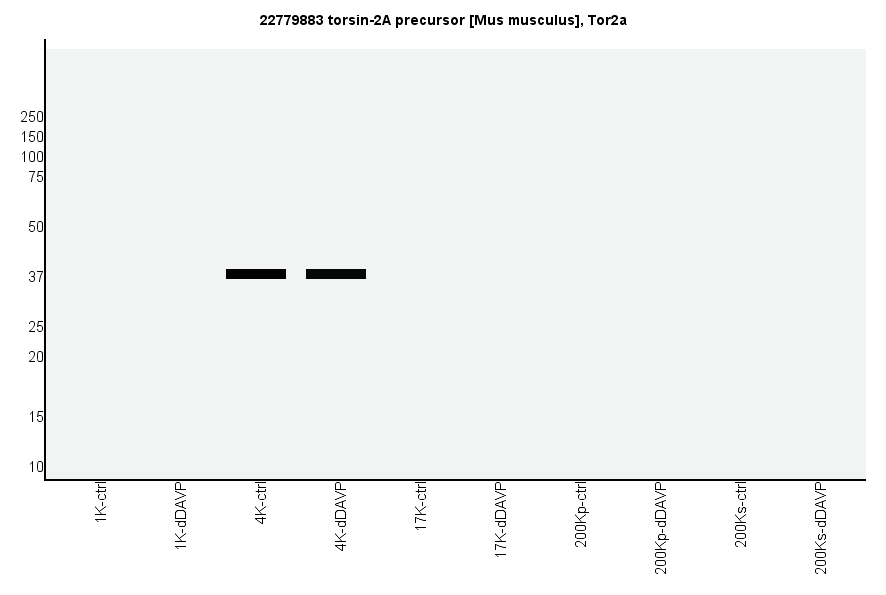
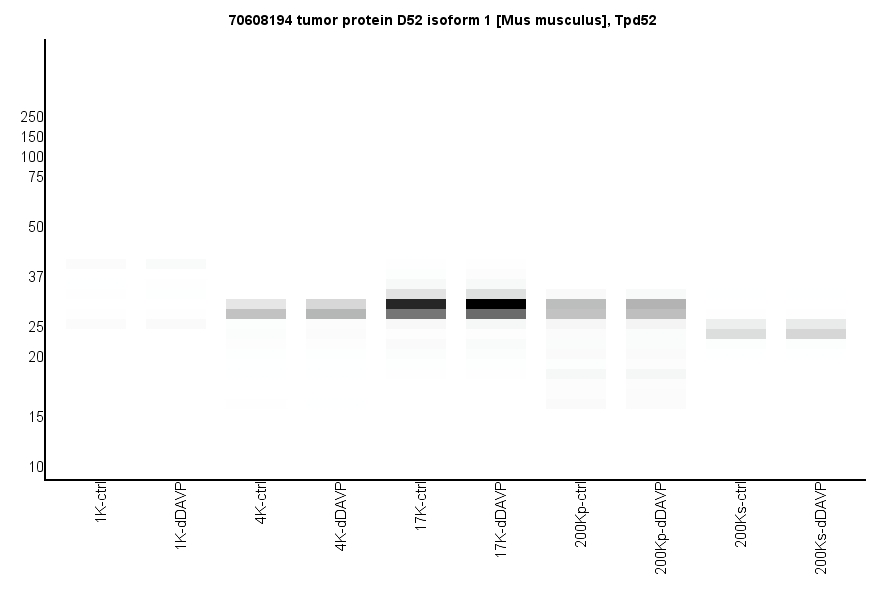
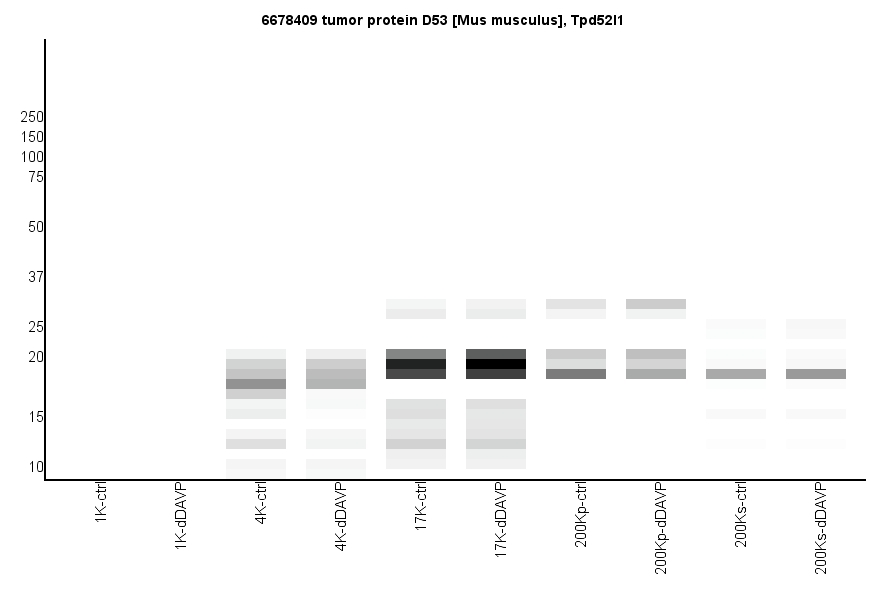
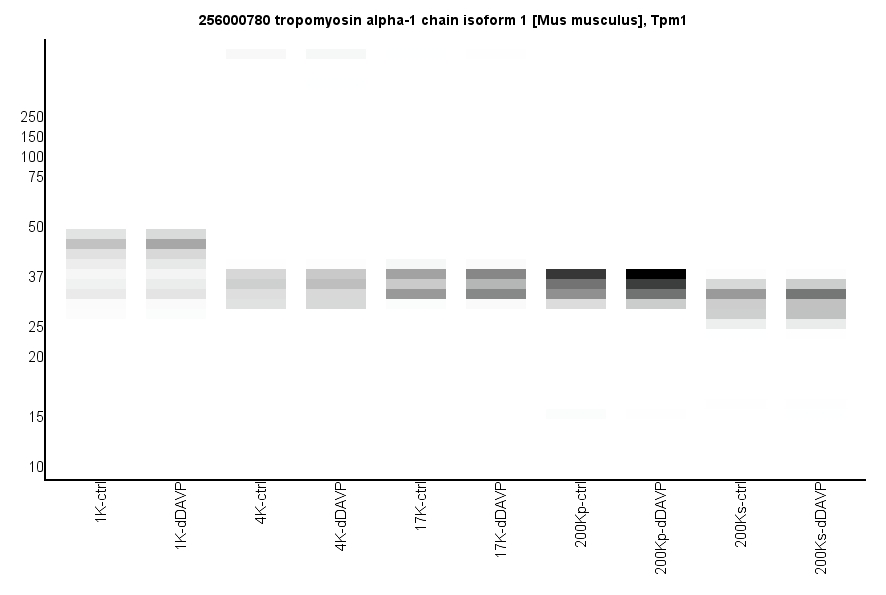
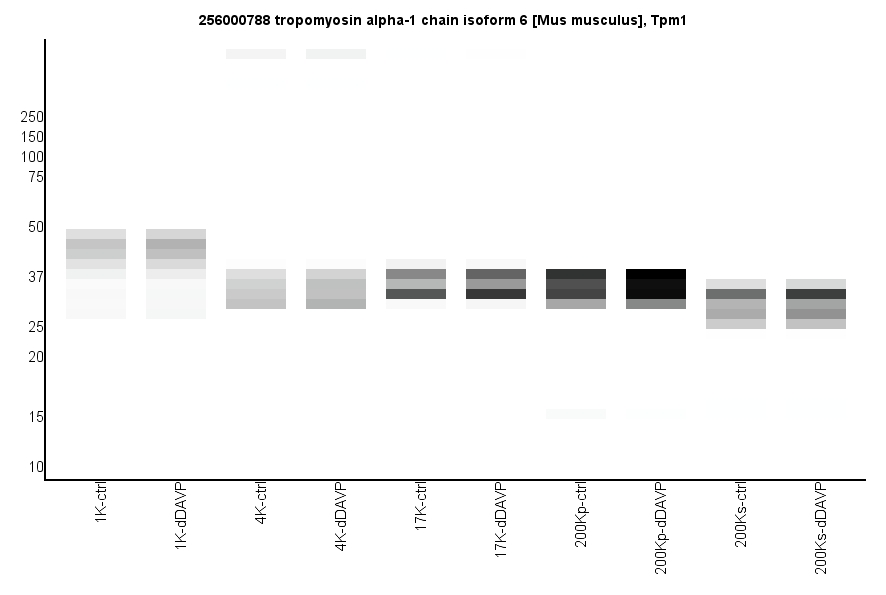
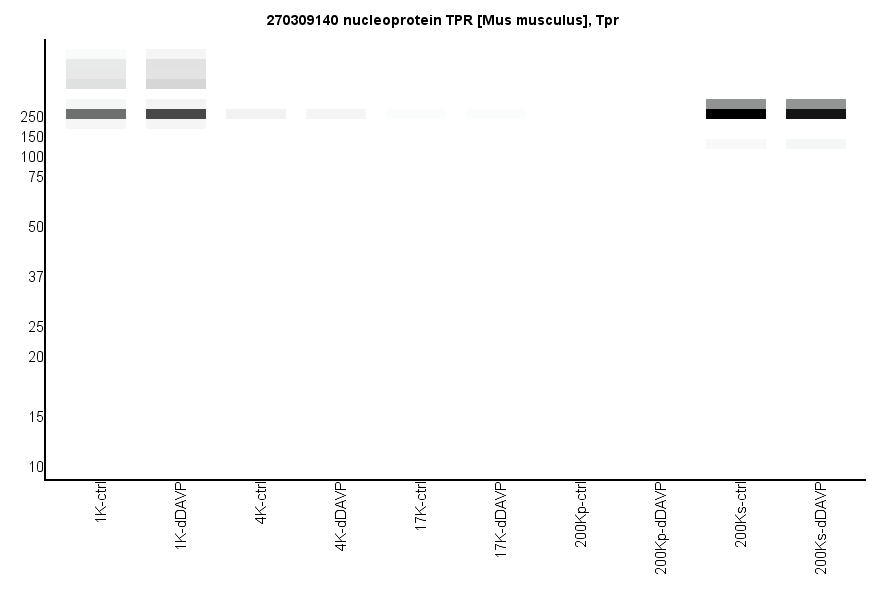
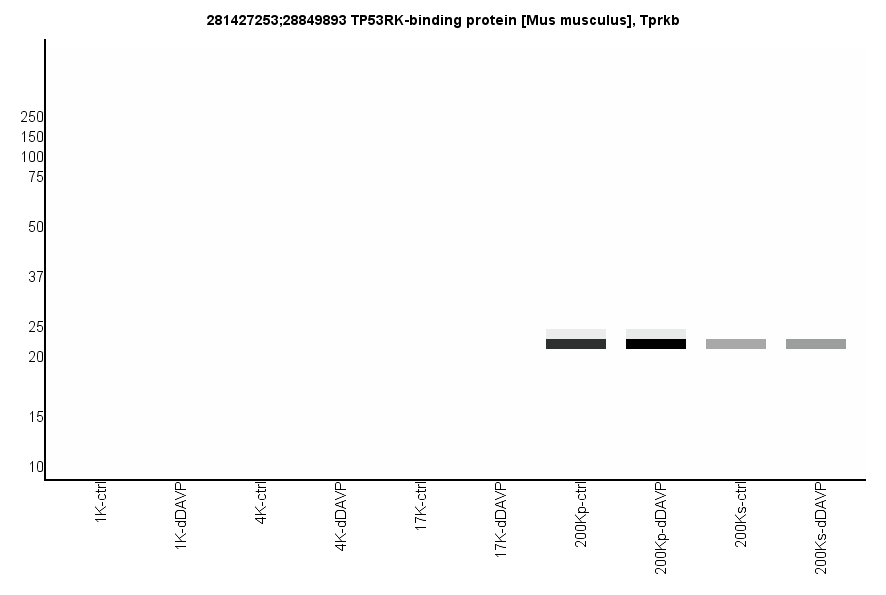
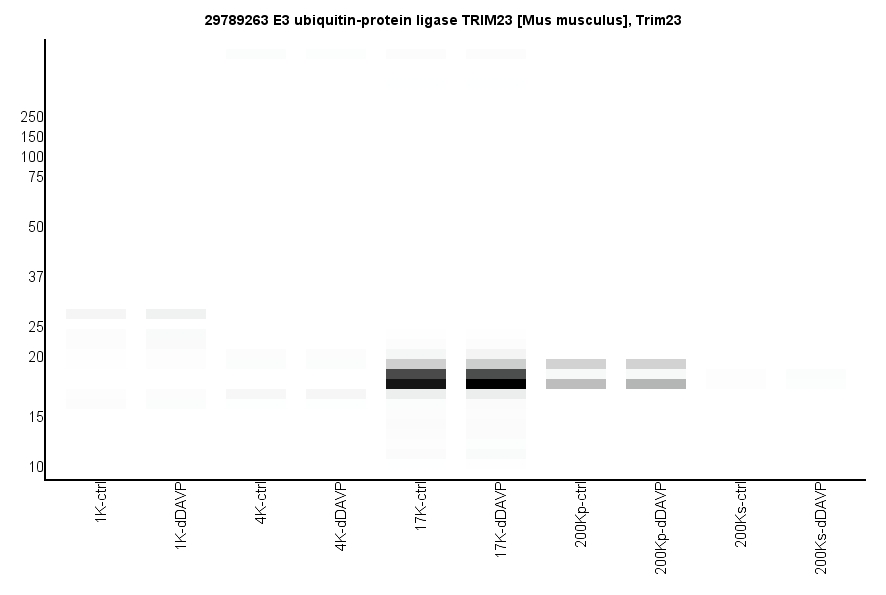
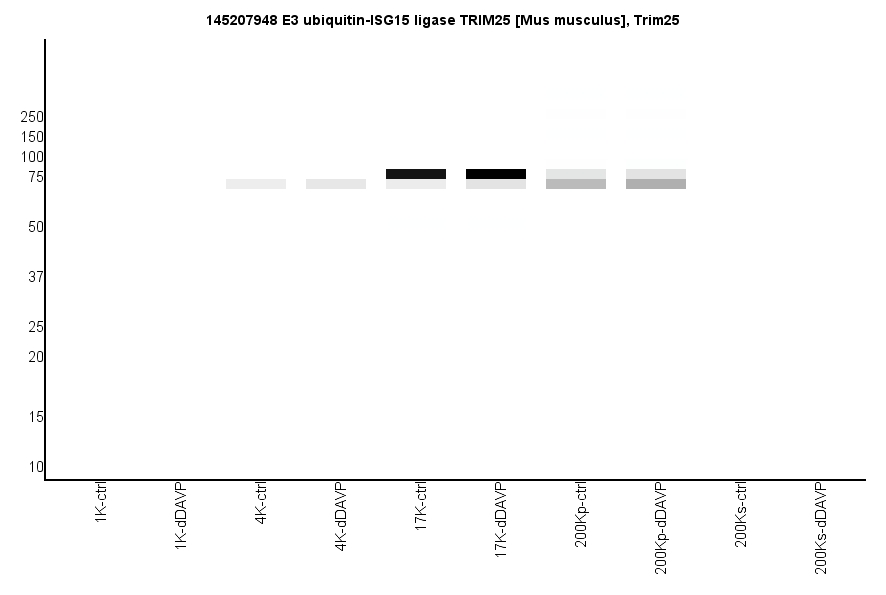
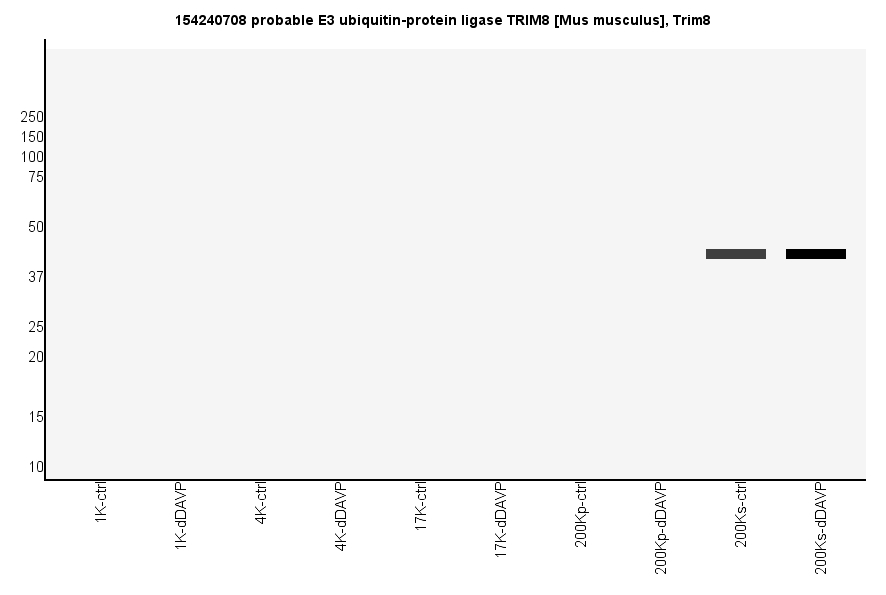
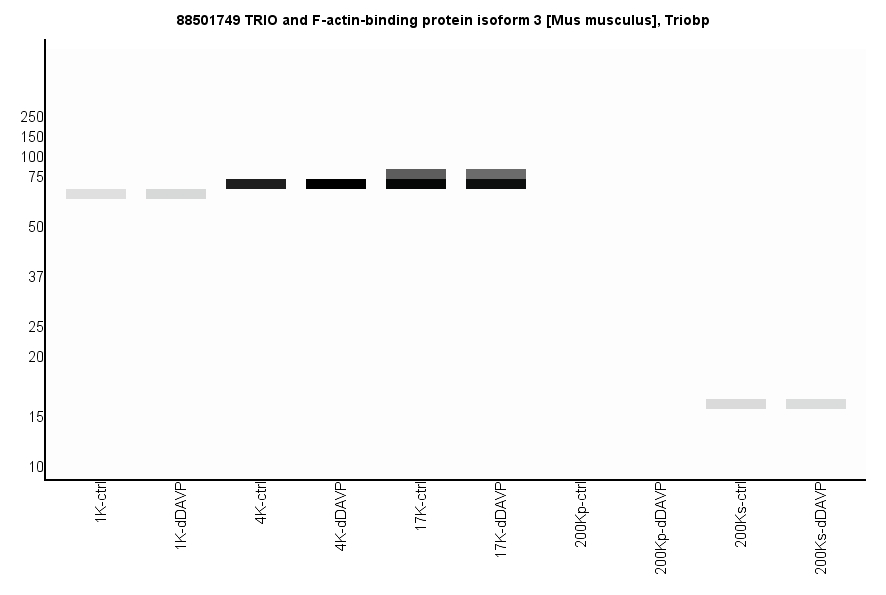
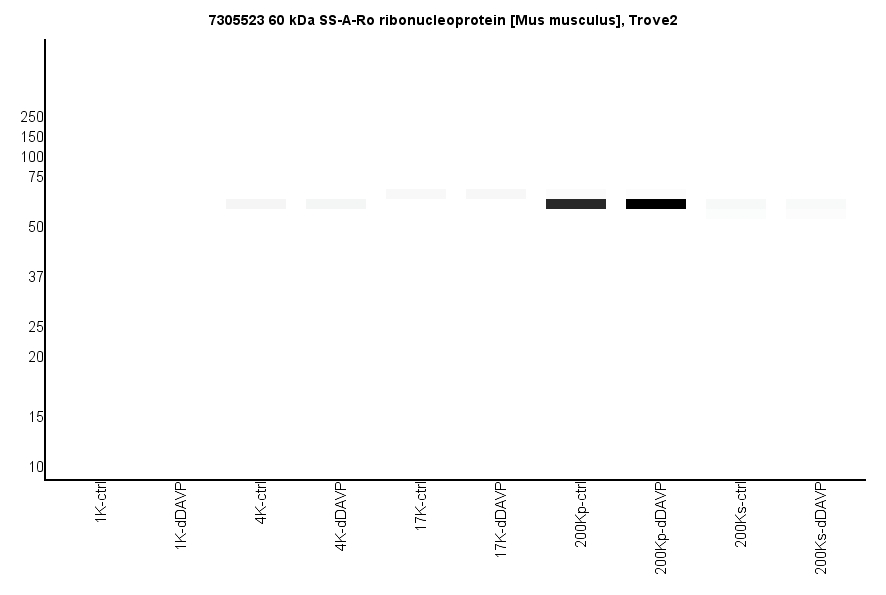
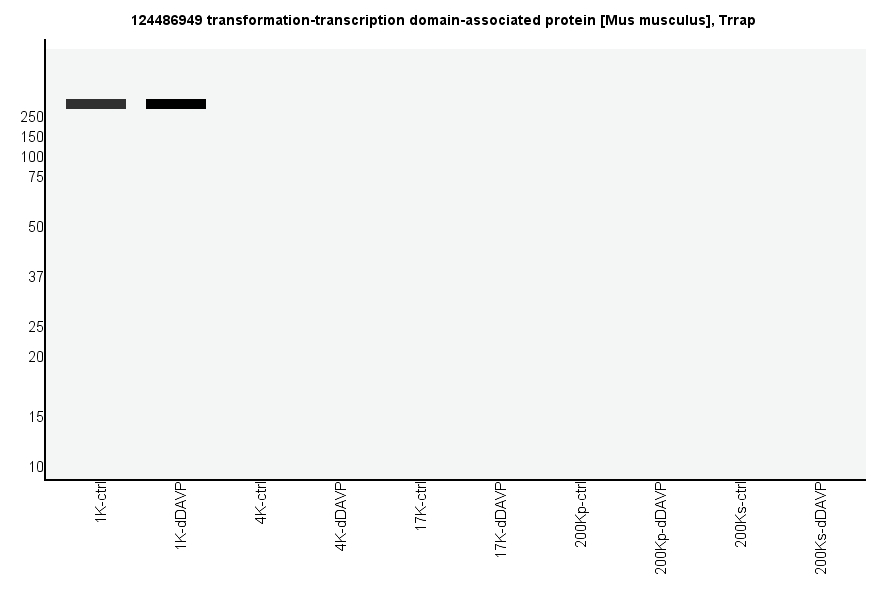
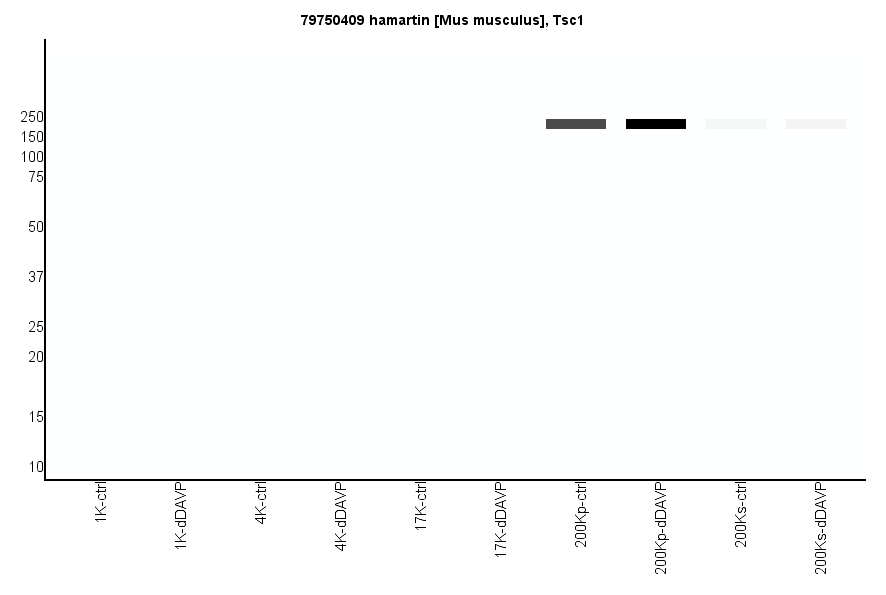
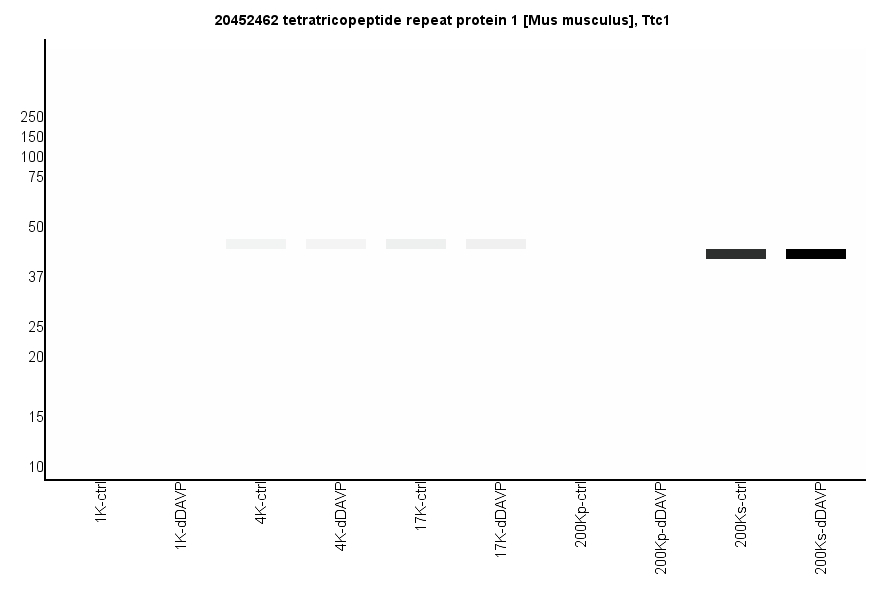
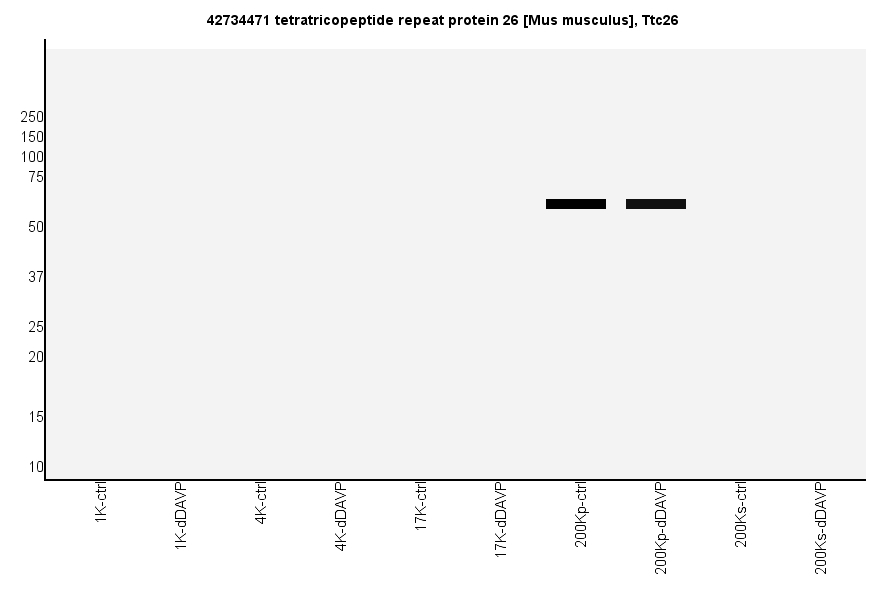
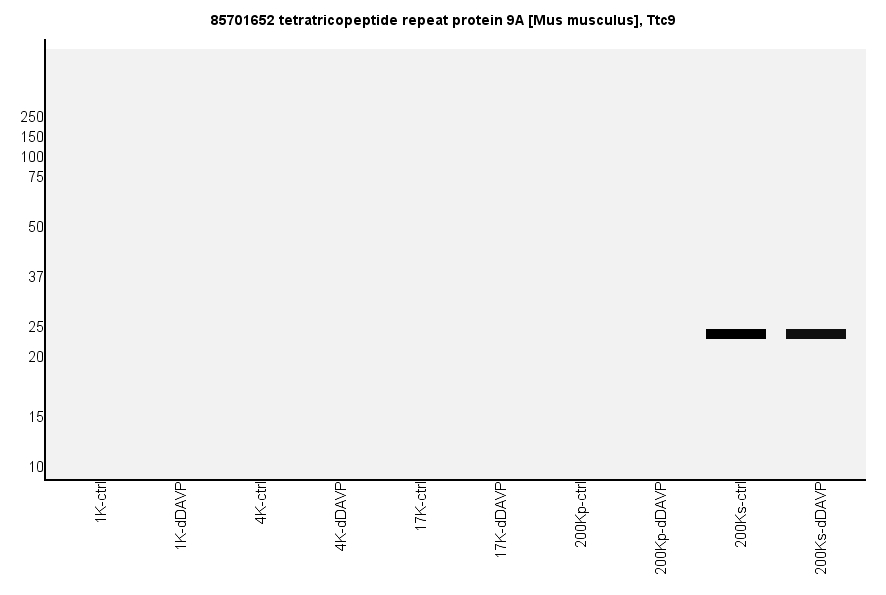
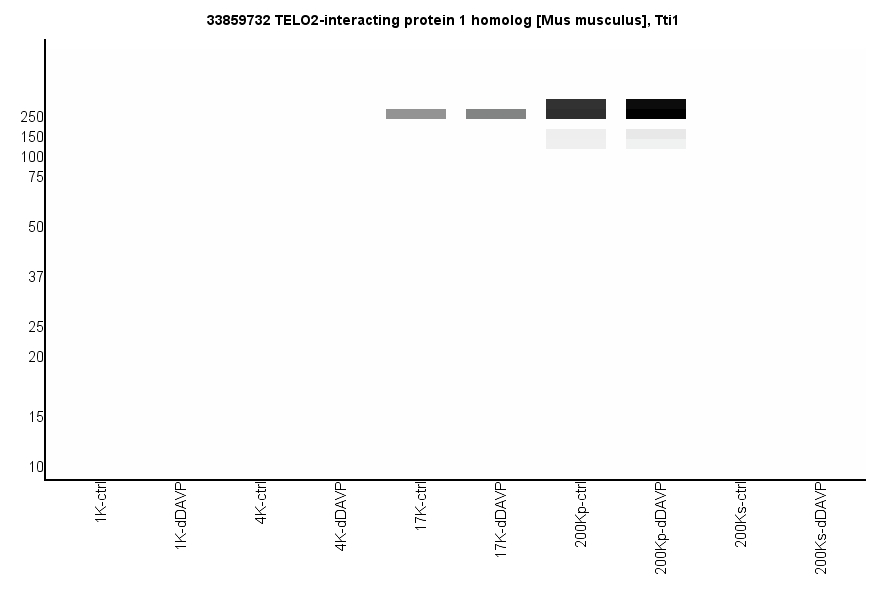
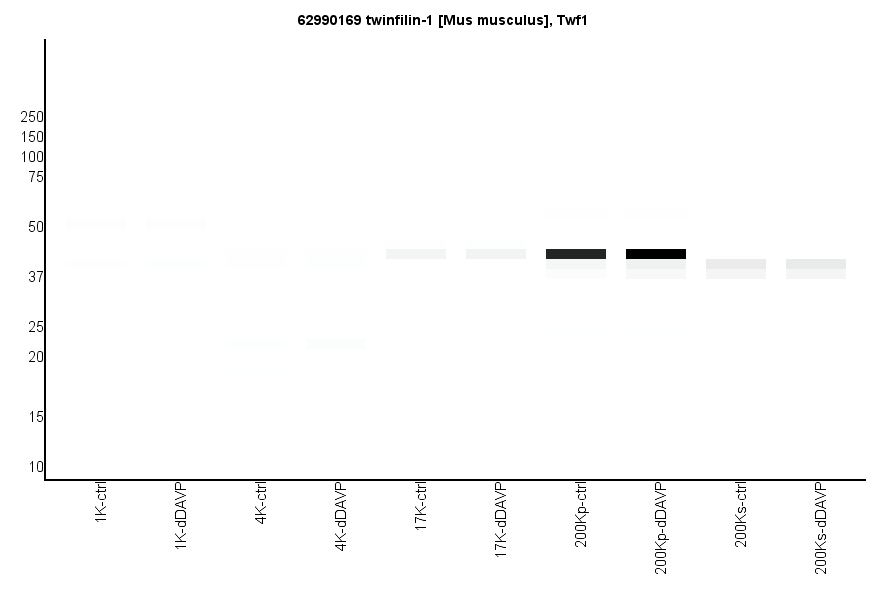
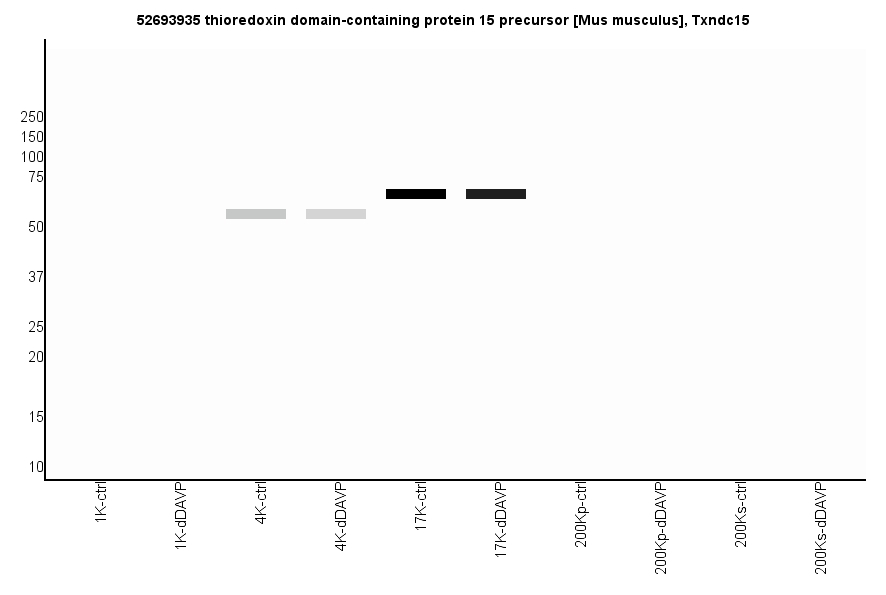
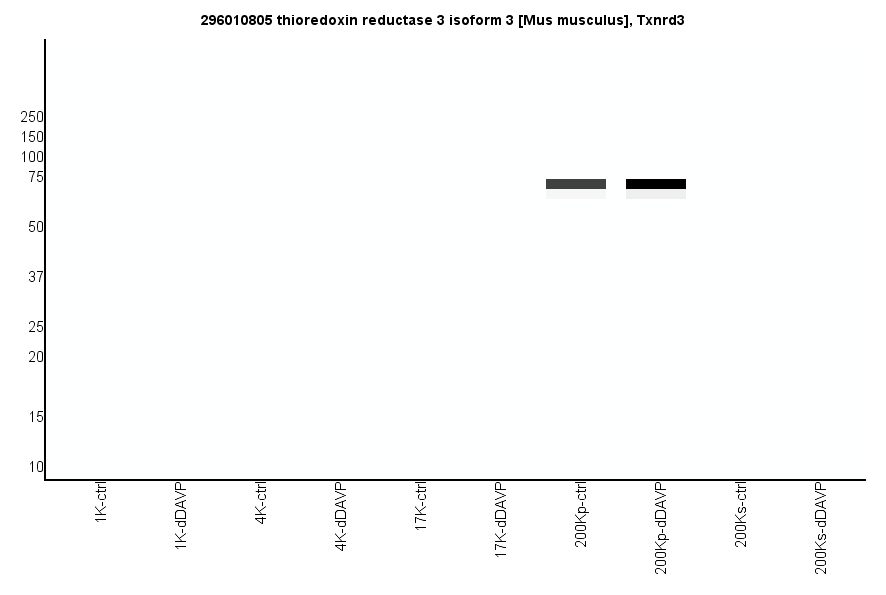